
INTRODUCTION
Altered cell differentiation has long been observed during tumorigenesis and poor differentiation is strongly linked to worse prognosis. The molecular mechanism of how altered differentiation is linked to tumorigenesis is poorly understood. Lymphomas are the most common hematological malignancy and account for 5.3% of all cancers in the United States [1]. Depending on the cell type affected, lymphomas can be divided into two major categories: T and B cell lymphomas, the latter accounting for more than 80% of cases [2]. However, the etiology of lymphomagenesis remains largely unknown.
GATA3, a lineage specifier, is critical in regulating self-renewal of hematopoietic stem cells [3–5], and controlling lymphoid cell differentiation [6, 7]. The function of GATA3 in T cell commitment and development has been extensively studied [6–9]. More recently, it has been reported that GATA3 promotes T cell specification by repressing B cell potential in pro-T cells [10, 11], and decreased GATA3 expression is essential for early B cell commitment [12]. Clinical studies revealed that somatic mutations in GATA3 were frequently detected in early T cell precursor acute lymphoblastic leukemia [13] and that inherited genetic variation in GATA3 is associated with susceptibility to developing lymphoma and acute lymphoblastic leukemia [14, 15], suggesting that GATA3 may play an important role in suppressing lymphoid malignancies.
GATA3 is expressed in 33–45% of peripheral T cell lymphomas and a subset of T cell lymphomas that correlated with poor survival was found to have increased GATA3 expression [16, 17]. In transgenic mice, forced expression of GATA3 during T cell development induced T cell lymphomas [18]. These findings suggest that GATA3 functions as a tumor-promoting factor in T cells. However, little is known about the role of GATA3 in B cell tumorigenesis.
In addition to cell differentiation, GATA3 also regulates cell proliferation. Notably, two independent groups demonstrated that loss of Gata3 impairs T cell proliferation [3, 19]. Additionally, loss of Gata3 results in impaired cell cycle entry and proliferation of hematopoietic stem cells (HSCs) [5], although a discrepant report that deletion of Gata3 enhances self-renewal of HSCs without affecting the cell cycle has also been observed [4]. We, and others, found that GATA3 promotes the proliferation of mammary luminal epithelial cells in vivo [20] and T cells in vitro [19] by suppressing p18Ink4c (p18) expression.
p18 is a member of the INK4 family that inhibits CDK4 and CDK6, whose activation by mitogen-induced D-type cyclins leads to phosphorylation and functional inactivation of RB, p107, and p130 [21, 22]. Deletion or reduced expression of p18 has been observed in different types of human cancers [22, 23]. Expression of p18 is absent in nearly half of Hodgkin lymphoma cases and correlates with shorter survival compared to patients with p18 positive tumors [24]. Moreover, homozygous deletion of p18 is frequently detected in B cell lymphomas [25, 26] and its deletion in mice promotes the development of various tumors, including medulloblastoma, glioblastoma, tumors of neuroendocrine organs, lungs, mammary and prostate [20, 27–32]. Confoundingly, although p18 loss stimulates T and B cell proliferation in response to mitogenic signals, it rarely leads to lymphoma development in mice [33, 34].
Since Gata3 deficiency results in aberrant differentiation of lymphoid cells and impaired T cell proliferation and p18 is a downstream target of GATA3 that represses lymphoid cell proliferation, we hypothesized that p18 loss can rescue impaired T cell proliferation, allowing us to determine the effect of Gata3 deficiency in lymphoid cell development and tumorigenesis. In the present study, we generated a mutant mouse strain with heterozygous germline deletion of Gata3 to determine how haploid loss of Gata3 affects lymphoid cell proliferation, differentiation, and tumorigenesis. We demonstrate that Gata3 suppresses B cell proliferation and differentiation. Notably, Gata3 cooperates with p18 to repress B cell lymphomas, suggesting that Gata3 functions as a tumor suppressor in B cells in addition to its role as a tumor promoter in T cells.
RESULTS
Haploid loss of Gata3 enhances B cell populations in the bone marrow and spleen and reduces T cell populations in the thymus
Due to the early embryonic lethality caused by homozygous germline deletion of Gata3 in mice, the role of Gata3 in regulation of multiple cell lineages including mammary epithelial cells, hematopoietic stem cells, lymphoid progenitors, and T cells has been investigated using conditional Gata3 deletion in vivo and ex vivo [35–37]. Since Gata3 functions in multiple cell lineages, we generated germline Gata3+/− mice by crossing Gata3f/+ mice with BALB/c-CMV-cre mice, a germline “Cre-deleter” strain [38] which enabled us to determine the effects of haploid loss of Gata3 in all cell lineages. We confirmed reduced Gata3 expression in Gata3+/− thymocytes, splenocytes and B cells (B220+) from the bone marrow (BM) and spleen (Figure 1A and Supplementary Figure S1A). Characterization of Gata3+/− mice revealed that there was a significant increase in splenic B220+ cells relative to WT counterparts (57.7% ± 6.0% vs. 48% ± 3.2%, p < 0.05, Figure 1B). In BM, the B220+IgM+ (mature B) cell population was significantly increased (11.4% ± 1.1% vs. 8.6% ± 1.0%, p < 0.05) and the B220+IgM− (immature B) cell population was enhanced (20.0% ± 4.5% vs. 14.7% ± 2.8%, p = 0.56) compared to WT littermates (Figure 1C). Though the percentage of the splenic CD3+ T cell population was significantly decreased in Gata3+/− spleens relative to WT age-matched counterparts (32.0% ± 7.7% vs. 42.8% ± 3.8%, Figure 1B), the absolute numbers of splenic CD3+ T cells were comparable between Gata3+/− and WT spleens (25.42 × 10⁶ vs. 25.41 × 10⁶, Figure 1B and Supplementary Figure S3B), suggesting that the percentage decrease of splenic CD3+ T cells in Gata3+/− spleens are relative to the increase of splenic B cells. Notably, the percentage and absolute number of CD4+ T cells were significantly decreased in Gata3+/− thymi relative to WT counterparts (9.1% ± 2.2% vs. 14.6% ± 2.8%, and 5.58 × 10⁶ vs. 9.98 × 10⁶, Figure 1D and Supplementary Figure S3A), consistent with previous reports [8, 39]. We determined the expression of a few transcription factors regulated by Gata3, Pu.1 and Lmo2 which are critical for B cell development, and Ets- 1 and Bcl11b which are important in T cell development [10, 11, 40]. We found that the expression of Ets-1 and Bcl11b was significantly decreased but Pu.1 and Lmo2 were significantly increased in Gata3+/− thymocytes when compared to WT counterparts (Figure 1E). These results suggest that haploid loss of Gata3 increases B cell populations in the BM and spleen, and decreases CD4+ thymocyte populations, consistent with previous findings showing that Gata3 promotes T and suppresses B cell differentiation [10–12].
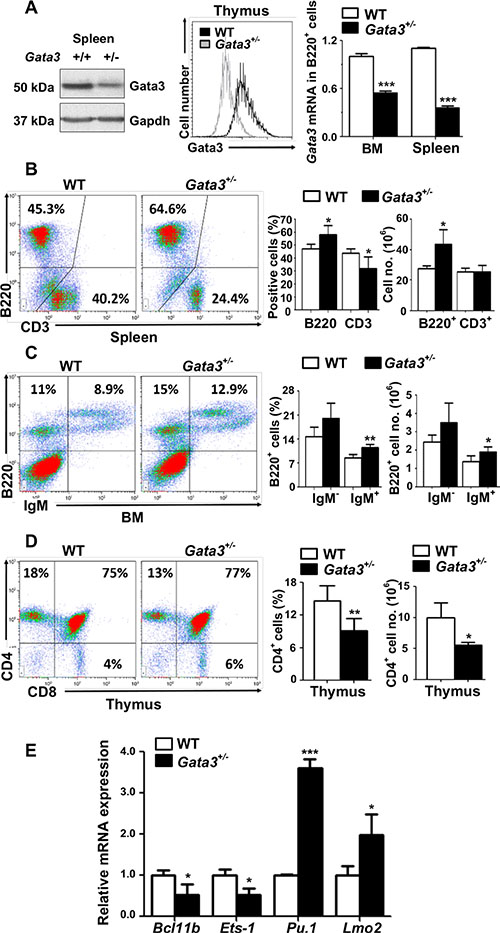
Figure 1: Haploid loss of Gata3 enhances B cell populations in the bone marrow and spleen, but reduces T cell populations in the thymus. (A) Tissues from the spleen or thymocytes of WT and Gata3+/− mice at 2 months of age were analyzed for Gata3 expression by Western blot (left panel) and flow cytometry (middle panel). Sorted B220+ B cells from the BM or spleen were analyzed for Gata3 expression by Q-RT-PCR (right panel). Data represent the mean ± SD from triplicates of 2 mice per genotype. (B–D). Cells from the spleen, BM and thymus of WT (n = 5) and Gata3+/− (n = 5) mice at 2 months of age were analyzed by flow cytometry. Representative profiles are shown. no., number. (E) mRNA levels of the indicated genes in thymocytes from WT and Gata3+/− mice at 2 months of age were determined by Q-RT-PCR. Data represent the mean ± SD from triplicates of 3 mice per genotype.
Haploid loss of Gata3 reduces thymocyte proliferation with induction of p18, but enhances B cell proliferation in the bone marrow and spleen
There is growing evidence suggesting that GATA3 controls proliferation of stem cells and progenitors [3–5, 20] in addition to its role in cell differentiation. We hypothesized that Gata3 regulates both T and B cell proliferation. To test this hypothesis, we analyzed BrdU incorporation and Ki67 staining in thymocytes and in B cells isolated from the BM and spleen. Consistent with previous findings [3, 19], we detected a significant decrease of thymocyte proliferation by haploid loss of Gata3, as evidenced by the reduced BrdU incorporation and less Ki67+ cells in Gata3+/– thymocytes in comparison with WT counterparts (8.1% ± 1.3% vs. 20.9% ± 3.6% for BrdU incorporation and 14.4% ± 1.9% vs. 24.8% ± 3.7% for Ki67 positivity, Figure 2A and Supplementary Figure S4). Surprisingly, we observed a significant increase of BrdU+B220+ BM cells and Ki67+B220+ splenocytes in Gata3+/− mice relative to WT counterparts (14.1% ± 2.9% vs. 8.0% ± 0.8% for BrdU+B220+ cells and 10.5% ± 0.35% vs. 6.2% ± 1.0% for Ki67+B220+ cells, Figure 2B, 2C), suggesting that haploid loss of Gata3 enhances B cell proliferation in the spleen and BM. These results also indicate that the increased B cell populations in Gata3+/− BM and spleen partially attributed to the enhanced B cell proliferation.
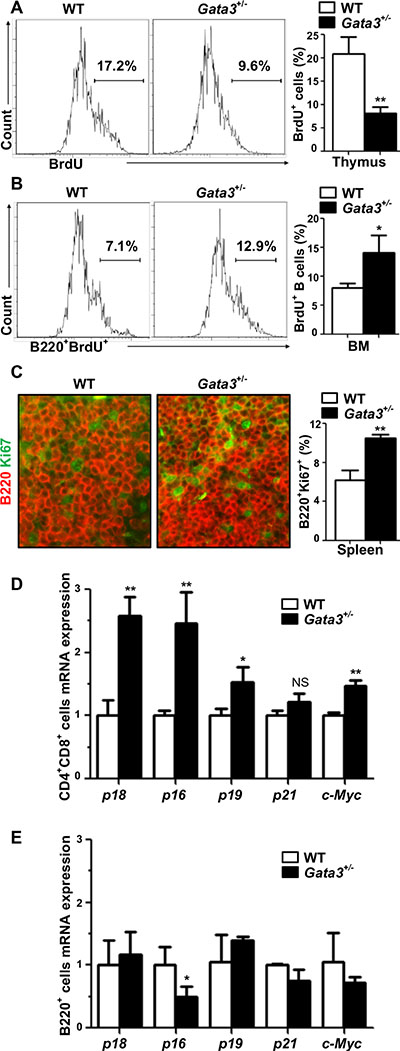
Figure 2: Haploid loss of Gata3 reduces thymocyte proliferation, but stimulates B cell proliferation in the bone marrow and spleen. (A, B) BrdU incorporation in thymocytes and B220+ BM cells from WT and Gata3+/– mice at 2 months of age were analyzed by flow cytometry. Results represent the mean ± SD of 3 animals per group. (C) Immunofluorescence staining of Ki67 (green, nuclear staining) and B220 (red, membrane staining) in spleens from WT and Gata3+/− mice. The percentages of Ki67+ cells were calculated from B220+ cells and quantitated in five randomly selected fields in splenic sections of WT and Gata3+/− mice, and the results represent the mean ± SD of three animals per group. (D, E) Q-RT-PCR analysis for FACS sorted CD4+ CD8+ cells from the thymus and B220+ cells from BM at 2 months of age. Data represent the mean ± SD from triplicates of 2 mice per genotype.
It has been reported that depletion of Gata3 impairs T cell proliferation through upregulation of cell cycle inhibitor p18 [19] or down-regulation of c-Myc [3], which both play an important role in lymphoid cell proliferation [33, 34, 41–43]. Since the cell cycle inhibitors p16Ink4a (p16), p19Ink4d (p19), and p21Cip1 (p21) also play critical roles in preventing proliferation of cells [22], we then determined the expression of p18 and c-Myc, as well as p16, p19, and p21, in lymphoid cells. We found that the expression of p18, p16, p19, and c-Myc were significantly increased in Gata3+/− CD4+CD8+ thymocytes (Figure 2D). Except in the case of p16, the expression of these genes in Gata3+/− B220+ BM cells were not significantly changed compared to WT (Figure 2E). Interestingly, p16 mRNA in Gata3+/− B220+ BM was significantly reduced relative to WT cells (Figure 2E), which may contribute to the increased B cell proliferation in Gata3+/− mice. We previously demonstrated that p18 is a downstream target of GATA3 and restrains mammary luminal progenitor cell proliferation and tumorigenesis [20]. Recently, it has also been confirmed that GATA3 regulates T cell proliferation through repression of p18 in vitro [19]. These findings prompted us to hypothesize that p18 loss may rescue the T cell proliferative defects as a result of Gata3 deficiency, allowing us to investigate the long term effects of Gata3 deficiency in lymphoid malignancies. To test this hypothesis, we crossed p18 null mice with Gata3+/− mice and generated p18−/−;Gata3+/− mice.
Loss of p18 partially restores thymocyte proliferation but further stimulates B cell proliferation induced by Gata3 deficiency
It has been reported that p18 deficient T and B lymphocytes display a hyperproliferative response to mitogenic signals [33]. We performed FACS and found that CD4/CD8 and B220/IgM profiles in the cells from p18−/− thymus, spleen, and BM were comparable to the cells from WT counterparts (Figure 3D vs. Figure 1B; Figure 3B vs. Figure 1C, Supplementary Table S1, and data not shown), indicating that loss of p18 does not affect T and B cell development, consistent with previous findings [33]. We then determined cell proliferation and found that there were slightly more BrdU+ and Ki67+ thymocytes in p18−/− mice than in WT counterparts at two months of age (22.0% ± 0.1% vs. 20.9% ± 3.6% for BrdU+ thymocytes, p > 0.05, 30.5% ± 3.6% vs. 24.8% ± 3.8% for Ki67+ thymocytes, p > 0.05, Figure 3E and Figure 2A, Supplementary Table S2, and Supplementary Figure S4). However, BrdU+ and Ki67+ B cells in p18−/− BM and spleen were significantly increased relative to WT counterparts (14.8% ± 0.3% vs. 8.0% ± 0.8% for BrdU+B220+ BM cells, p < 0.05, Figure 2B and 3C, 9.4% ± 1.2% vs. 6.2% ± 1.0% for Ki67+B220+ splenocytes, p < 0.05, Figures 2C and 3F). These results suggest that loss of p18 stimulates B cell proliferation in mice under homeostatic conditions.
p18−/−;Gata3+/− thymocytes, splenocytes, B220+IgM- immature B and B220+IgM+ mature B cells in BM, expressed less Gata3 mRNA and protein than p18−/− cells (Figure 3A and Supplementary Figure S1B). Consistently, we also observed that in the BM, Gata3+/− B220+IgM- and B220+IgM- cells expressed less Gata3 than WT counterparts (Supplementary Figure S1C). We determined lymphocyte distribution in 2-month-old mice and found that p18−/−;Gata3+/− spleen and BM displayed significantly more B220+ and B220+IgM+ cells than p18−/− counterparts, respectively (Figure 3B, 3D, and Supplementary Table S1). Although the percentages of CD3+ splenocytes and CD4+ thymocytes in p18−/−;Gata3+/− mice were significantly reduced when compared with p18−/− mice (29.1% ± 2.9% vs. 38.1% ± 4.4% for CD3+ splenocytes, p = 0.005, 8.6% ± 1.3% vs. 11.8% ± 2.3% for CD4+ thymocytes, p = 0.03, Figure 3D and Supplementary Table S1), the absolute number of these cells in p18−/−;Gata3+/− mice, CD4+ thymocytes in particular, was not significantly decreased (Figure 3D and data not shown). In line with the findings derived from Gata3+/− thymocytes (Figure 1E), we also detected a significantly increased expression of Pu.1 and Lmo2, as well as significantly decreased expression of Ets-1 and Bcl11b in p18−/−;Gata3+/− thymocytes relative to those in p18−/− counterparts (Figure 3G). Together, these results suggest that haploid loss of Gata3 in p18 null mice promotes B cell development in the BM and spleen. How Gata3 deficiency impacts T cell development in a p18 null background needs further investigation.
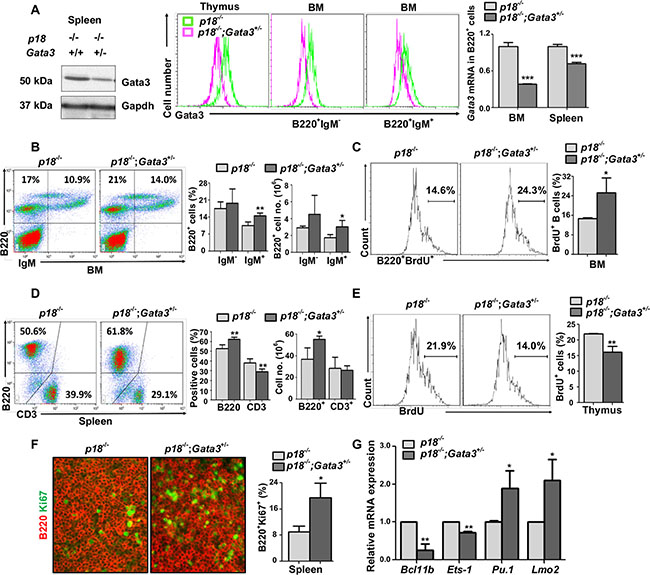
Figure 3: Loss of p18 partially restores Gata3 deficient thymocyte proliferation, and haploid loss of Gata3 in a p18 null background promotes B cell proliferation and differentiation. (A). Splenic tissue, thymocytes, or sorted BM B cells (B220+IgM−and B220+IgM+) from p18−/− and p18−/−;Gata3+/− mice at 2 months of age were analyzed for Gata3 expression by Western blot (left panel) and flow cytometry (middle panel). Sorted B220+ B cells from the spleen and BM were analyzed for Gata3 expression by Q-RT-PCR (right panel). Data represent the mean ± SD from triplicates of 2 mice per genotype. (B, D) Cells from the BM (B) and spleen (D) of p18−/− and p18−/−;Gata3+/− mice at 2 months of age were analyzed. Results represent the mean ± SD of 5 animals per group. (C, E) BrdU incorporation in B220+ BM cells (C) and thymocytes (E) from p18−/− and p18−/−;Gata3+/− mice at 2 months of age were analyzed by flow cytometry. Results represent the mean ± SD of 3 animals per group. (F) Immunofluorescence staining of Ki67 (green, nuclear staining) and B220 (red, membrane staining) in the spleen from p18−/− and p18−/−;Gata3+/− mice. The percentagest of Ki67+ cells were calculated from B220+ cells and quantitated in five randomly selected fields in splenic sections of WT and Gata3+/− mice, and the results represent the mean ± SD of three animals per group. (G) mRNA levels of the indicated genes in thymocytes from p18−/− and p18−/−;Gata3+/− mice at 2 months of age were determined by Q-RT-PCR. Data represent the mean ± SD from triplicates of 3 mice per genotype.
We then determined lymphoid cell proliferation in p18−/−;Gata3+/− mice at young age. We detected significantly more BrdU+B220+ BM cells and Ki67+B220+ splenocytes in p18−/−;Gata3+/− mice at two months of age when compared to p18−/− counterparts (27.5% ± 5.1% vs. 14.8% ± 0.3% for BrdU+B220+ cells and 19.5% ± 4.4% vs. 9.4% ± 1.2% for Ki67+B220+ cells, Figure 3C, 3F and Supplementary Table S2). These data indicate that loss of p18 collaborates with Gata3 deficiency to stimulate B cell proliferation. Importantly, BrdU incorporation in p18−/−;Gata3+/− thymocytes were significantly less than in p18−/− cells (16.1% ± 1.9% vs. 22.0% ± 0.1%) and incorporation in both these cells were significantly more than Gata3+/− thymocytes (16.1% ± 1.9% and 22.0% ± 0.1% vs. 8.1% ± 1.3%, Figures 3E and Figure 2A). In addition, BrdU+ thymocytes in p18−/−;Gata3+/− were not as high as in WT cells (16.1% ± 1.9% vs. 20.9% ± 3.6%, Figure 3E and Figure 2A). To consolidate this finding, we also performed Ki67 staining in the thymus and found that there were significantly less Ki67+ thymocytes in p18−/−;Gata3+/− mice than in p18−/− mice, but more than in Gata3+/− mice (Supplementary Figure S4). These data suggest that loss of p18 partially rescues growth defects in thymocytes caused by Gata3 deficiency. Taken together, these results further suggest that Gata3 promotes thymocyte proliferation partially through the repression of p18, whereas Gata3 collaborates with p18 to inhibit B cell proliferation in the BM and spleen.
Haploid loss of Gata3 in a p18 deficient background leads to development of B cell lymphomas
We followed p18 and Gata3 single and combined mutant mice to older ages and found that the spleens were dramatically enlarged in p18−/− and p18−/−;Gata3+/−mice, respectively, starting at 8 months of age when compared with WT and Gata3+/− counterparts (Figure 4A, 4B). The majority of p18−/−;Gata3+/− mice displayed various degrees of lymphadenopathy whereas no enlargement of the thymus, spleen nor lymph nodes were detected in WT and Gata3+/− mice at a similar age. Histological analysis revealed that some p18−/−;Gata3+/− mice displayed typical lymphoma pathology, such as effacement of normal architecture and uniform cell morphology (Figure 4C, 4F). We performed immunohistochemistry (IHC) and immunofluorescence analysis for p18−/−; Gata3+/− lymphomas and found that the majority of lymphoma cells were B220+ and a small portion of the cells were CD3+ (Figure 4D). p18−/−;Gata3+/− spleens and lymph nodes with lymphomas exhibited aberrant B220+IgM− or B220+IgM+ cell populations relative to age-matched tumor-free counterparts of the same genotype (Figure 5A). These results suggest that p18−/−;Gata3+/− lymphomas were either B or pre-B cell lymphomas.
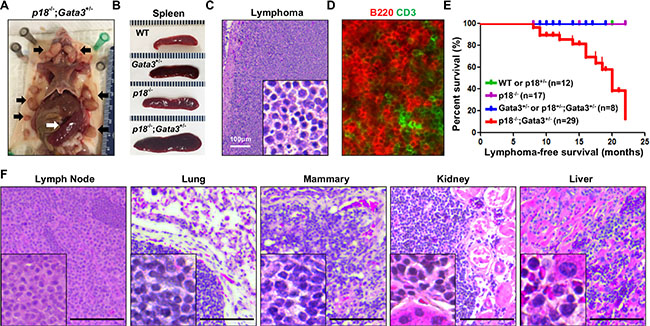
Figure 4: Gata3 deficiency in p18 null mice induces B-cell lymphomas. (A) Representative lymphomas developed in p18−/−;Gata3+/− mice. Note the multiple enlarged lymph nodes (black arrows) and typical enlarged spleen (white arrow). (B) Representative gross appearance of spleens from age-matched (12–14 months of age) WT, Gata3+/−, p18−/− and p18−/−;Gata3+/− mice. (C, D) Representative H&E (C) and immunofluorescence staining (D) of primary lymphomas developed in p18−/−;Gata3+/−mice. (E) Lymphoma-free survival of mice with different genotypes. p = 0.018 among four groups by Log-rank (Mantel-Cox) Test. (F) Representative p18−/−;Gata3+/− lymphomas infiltrated into multiple organs, determined by H&E staining.
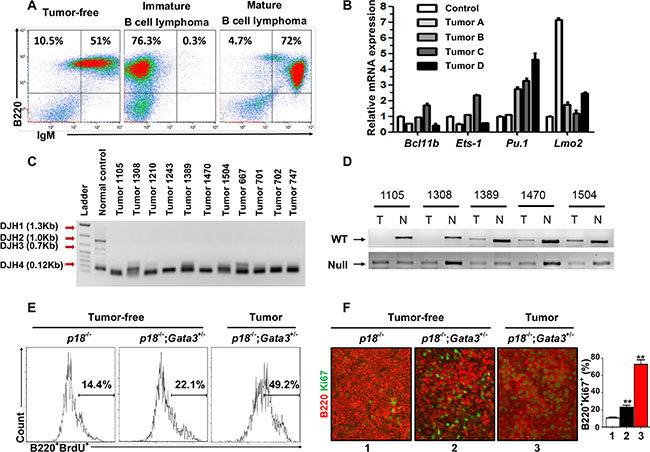
Figure 5: Characterization of lymphomas developed in p18−/−;Gata3+/− mice. (A) Representative lymphomas from p18−/−;Gata3+/− mice at 14–16 months of age were analyzed by FACS with the indicated antibodies. Age-matched spleens from tumor-free mice of the same genotype were used as control. (B) Q-RT-PCR analysis for cells derived from four representative p18−/−;Gata3+/−lymphomas. Splenocytes from the age-matched, lymphoma-free mice of the same genotype were used to normalize the expression for each gene. Data represent the mean ± SD from triplicate experiments. (C) DJ rearrangement of the heavy chain of immunoglobulin in DNA from p18−/−;Gata3+/− lymphomas was determine by PCR. DNA from a WT spleen with polyclonal B-cell populations was shown as a control. (D) Loss of heterozygosity analysis of representative p18−/−;Gata3+/− lymphomas. DNA isolated from microdissected lymphomas or ear tissues from the same mice were analyzed by PCR. (E) Representative BrdU incorporation in cells from a p18−/−;Gata3+/− lymphoma (Lane 3) and splenocytes from the age-matched (14–6 months), p18−/− (Lane 1) and p18−/−;Gata3+/− (Lane 2) lymphoma-free mice. (F) Immunofluorescence staining of Ki67 (green, nuclear staining) and B220 (red, membrane staining) in spleens from p18−/− (Lane 1) and p18−/−;Gata3+/− (Lane 2) lymphoma-free mice and a p18−/−;Gata3+/− lymphoma (Lane 3). The percentages of Ki67+ cells were calculated from B220+ cells and quantitated in five randomly selected fields in splenic sections, and the results represent the mean ± SD of three animals per group.
We determined the expression of transcription factors related with T and B cell differentiation in four representative p18−/−;Gata3+/− lymphomas. We found that all tumors expressed high levels of Pu.1 and Lmo2 relative to lymphoma-free splenocytes from age-matched tumor-free mice with the same genotype (Figure 5B). Notably, except for one lymphoma expressing slightly increased Ets-1 and Bcl11b (Tumor C in Figure 5B), all the remaining lymphomas expressed low or unchanged Ets-1 and Bcl11b. These data confirm that Gata3 also inhibits B cell differentiation during lymphoma development.
After monitoring a cohort of 29 p18−/−;Gata3+/−, 17 p18−/−, 8 Gata3+/− or p18+/−;Gata3+/− and 12 WT or p18+/− mice for 8–22 months, we found that 46% (n = 11) and 50% (n = 18) of p18−/−;Gata3+/− mice developed spontaneous lymphomas at 8–14 and 14–22 months of age, respectively, whereas no WT, Gata3+/− or p18−/− mice formed lymphomas at similar ages (Figure 4 and Table 1). About 1/3 (5 of 14) p18−/−;Gata3+/− lymphomas infiltrated into non-lymphoid organs including the liver, kidney, or lung (Figure 4F). Interestingly, 4 of 14 p18−/−;Gata3+/− mice with lymphomas also developed mammary tumors. The median lymphoma-free survival time was 20 months in p18−/−;Gata3+/− mice and the earliest lymphomas were detected at 8 months of age (Figure 4E). These results indicate that Gata3 deficiency collaborates with p18 loss to induce lymphomagenesis, though the loss of either gene alone rarely leads to lymphoma.
Table 1: Spontaneous lymphoma development in p18−/− Gata3+/− mice
Genotype |
WT or p18+/−a |
p18−/− |
Gata3+/− or p18+/−;Gata3+/–b |
p18−/−;Gata3+/− |
||||
|---|---|---|---|---|---|---|---|---|
Age(Months) |
8–14 |
14–22 |
8–14 |
14–22 |
8–14 |
14–22 |
8–14 |
14–22 |
B-cell Lymphoma |
0/8 |
0/4 |
0/7 |
0/10 |
0/5 |
0/3 |
5/11 (46%) |
9/18 (50%) |
aThis group includes 7 p18+/− mice.
bThis group includes 6 p18+/−;Gata3+/− mice.
To determine the presence of clonal B cells in lymphomas, somatic recombination at the immunoglobulin heavy chain (IgH) locus in lymphomas were analyzed by PCR as previously described [44]. We found that all lymphomas exhibited the same clonal rearrangement (DHJ4 0.12kb), indicating that the lymphomas developed from p18−/−;Gata3+/− mice were clonal (Figure 5C). We performed loss of heterozygosity (LOH) analysis for p18−/−;Gata3+/− lymphomas and found that the remaining WT allele of Gata3 is absent in at least 2 out of 5 tumors examined (Figure 5D), further supporting the role of Gata3 in suppressing B cell lymphomas. Due to the very low level of GATA3 expression in B cells that is undetectable by western blot [3] and IHC (Pei unpublished data), we were unable to determine whether Gata3 expression is further reduced in tumor cells of p18−/−;Gata3+/−lymphomas with LOH relative to lymphoma-free B cells.
We then performed FACS and IHC and found that in lymphoma-free mice at older ages (14–16 months), B220+ cells from p18−/−;Gata3+/− spleens incorporated more BrdU and had a higher percentage of Ki67+ cells (Figure 5E, 5F) than those from age-matched p18−/− cells. Further, the percentages of BrdU+ or Ki67+ B cells from p18−/−; Gata3+/− lymphomas were significantly more than cells from lymphoma-free spleens of the same genotype (Figure 5E, 5F). These data, in addition to the results described above, indicate that Gata3 deficiency cooperates with p18 loss to stimulate B cell proliferation from a young age and to maintain an expanded B cell population throughout life, eventually leading to B cell lymphomas.
p18;Gata3 double mutant lymphoma cells rapidly form lymphoma in recipient mice
We then transplanted two million cells isolated from a p18−/−;Gata3+/− splenic lymphoma (immature B-cell lymphoma) or an asymptomatic spleen into each female NSG mouse (n = 3 for each group) by tail vein injection. After one month, all mice that received lymphoma cell transplants exhibited clinical signs of illness such as hunched posture, loss of appetite, ruffled fur and dyspnea whereas no symptoms were observed in mice that received control splenocytes. Necropsy and histological analysis revealed that mice that received lymphoma cell transplants displayed marked lymphadenopathy and enlarged spleens, with tumor cells infiltrated into multiple non-lymphoid organs including liver and lung (Figure 6A, 6B). Flow cytometry analysis showed that more than 90% of cells from spleen, lymph node, and BM of the lymphoma cell transplants exhibited aberrant B220+ IgM− cell populations (Figure 6C), which were comparable with the populations in the donor lymphoma (Figure 5A, middle panel). No mice received control splenocytes displayed similar flow cytometry profiles in splenocytes (Figure 6C). Together, these results demonstrate that p18−/−;Gata3+/− lymphoma cells are transplantable and highly tumorigenic into secondary immunodeficient mice.
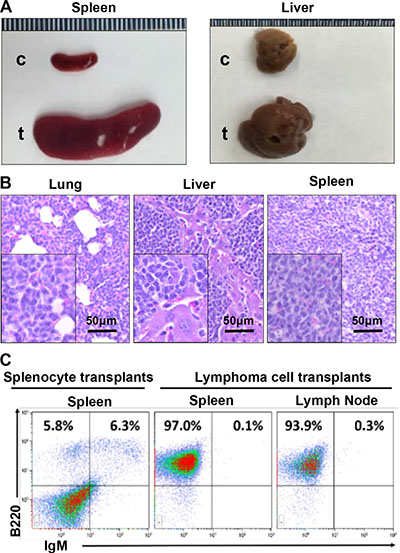
Figure 6: p18−/−;Gata3+/− lymphoma cells are transplantable. (A) Representative gross appearance of spleens and livers from recipient mice transplanted by p18−/−;Gata3+/− lymphoma cells (t) and asymptomatic splenocytes (c). (B) Representative H&E staining for lung, liver, and spleen in mice that received lymphoma cell transplants. Note massiave lymphoma cells infiltrating into these organs. (C) Representative FACS analysis for the cells isolated from receipient mouse spleens and lymph nodes. Splenocytes from the mice that received asymptomatic splenocyte transplants were used and analyzed as control.
DISCUSSION
In this study, we found that heterozygous germline deletion of Gata3 increased the B cell populations in the BM and spleen, but decreased CD4 T cell populations in the thymus, confirming the finding that Gata3 promotes T and suppresses B cell differentiation. Importantly, we discovered that heterozygous germline deletion of Gata3 reduced thymocyte proliferation with induction of p18 but enhanced B cell proliferation in the BM and spleen independent of p18. Moreover, loss of p18 partially restored Gata3 deficient thymocyte proliferation but further stimulated Gata3 deficient B cell proliferation in the BM and spleen. We found that heterozygous germline deletion of Gata3 in p18 deficient background led to development of B cell lymphomas. These results indicate that Gata3 deficiency promotes B cell differentiation and proliferation, and cooperates with p18 loss to induce B cell lymphomas. To the best of our knowledge, this is the first genetic evidence showing that loss of function of Gata3 promotes B cell lymphomagenesis. Our results suggest that Gata3 is a tumor suppressor in B cells as opposed to a tumor promoter in T cells.
Overexpression of GATA3 in T cells induces T cell lymphomas in mice [18]. Two clinical studies showed that GATA3 is aberrantly overexpressed in a subset of T cell lymphomas [16, 17]. Notably, GATA3 is undetectable in the majority of B-cell lymphomas including the nodular lymphocyte predominance type of Hodgkin lymphomas and various B cell non-Hodgkin lymphomas whereas it is aberrantly expressed in some of the Hodgkin and Reed/Sternberg cells (HRS) cells [45–47]. Classical Hodgkin lymphoma (HL) is unique among human lymphomas in the extent to which the lymphoma cells have undergone reprogramming of gene expression and the hallmark of this disease is the presence of HRS cells [48]. Despite their B cell origin, HRS cells have lost expression of many B cell markers and acquired expression of multiple markers that are not found in normal B cells [48]. It has been shown that the deregulated constitutive activity of NF-kB and Notch-1 alters GATA3 expression in HRS cells [46]. Furthermore, GATA3 activity correlates with IL-5 and IL-13 expression in HRS cells, which may contribute to the pathogenesis of HL [46]. Importantly, HRS cells account for only about 1% of cells in the tumor tissue and the majority of cells in classical HL are a mixed immune infiltrate comprising of CD4+ cells. A recent study has reported that CD4-associated GATA3 is expressed at significantly low levels in classical HL tissue [49], suggesting that GATA3 deficiency may contribute to HL development through deregulating CD4+ cells in the HL microenvironment. Furthermore, it has been identified that inherited genetic variation of GATA3 is associated with susceptibility to developing HL, though the risk allele is not associated with GATA3 gene expression [14]. However, whether GATA3 is required for development of HRS and HL remains to be investigated. We demonstrated that haploid loss of Gata3 in mice enhances B cell differentiation at young age and leads to B cell lymphomas in aged mice in the absence of a cell cycle inhibitor, p18. These results suggest that Gata3 abundance is critical in controlling lymphomagenesis with a lineage specific effect, i.e. high expression of GATA3 causes T cell lymphomas and Gata3 deficiency results in B cell lymphomas.
Genome-wide association studies have revealed that inherited genetic variation in GATA3 is associated with susceptibility to developing B cell acute lymphoblastic leukemia and the B cell leukemia risk allele is associated with increased GATA3 expression [15, 50]. Though it is unexpected, the increased risk of a B cell leukemia by overexpression of a non-B-cell-specific transcription factor, e.g. GATA3, is not surprising. Wiemels et al., recently discovered that a B-cell leukemia risk allele in the myeloid specific transcription factor CEBPE is also associated with increased gene expression [51]. These observations suggest that the increased GATA3 and CEBPE expression associated with B cell leukemia risk alleles may be associated with the lineage confusion, a common feature of leukemogenesis [52].
The function of GATA3 in controlling cell fate and differentiation, lymphoid cell differentiation in particular, has been extensively studied [10–12]. Not until recently has the role of GATA3 in regulating cell proliferation been investigated. In the present study, we demonstrated that heterozygous germline deletion of Gata3 reduces T cell proliferation with induction of p18, but enhances B cell proliferation, and that loss of p18 partially restores Gata3 deficient T cell proliferation but further stimulates Gata3 deficient B cell proliferation, eventually leading to development of B cell lymphomas. These data indicate that GATA3 regulates cell proliferation in a cell type dependent manner. The molecular mechanisms underlying the role of GATA3 in promoting T cell proliferation through repressing p18 was reported [19] and further supported by our findings in mammary luminal epithelial cells [20]. Though it was shown that depletion of Gata3 in CD8+ T cells reduces their proliferation and that c-Myc was identified as a target of Gata3 in promoting CD8+ T cell proliferation [3], we failed to detect c-Myc mRNA reduction in Gata3+/− CD4+CD8+ T cells (Figure 2D). This may be mainly caused by the different cell populations checked (CD8+ vs CD4+CD8+) and different Gata3 mutant mice used (Cd4-Cre-Gata3f/f vs. germline Gata3+/−). The mechanisms of GATA3 in suppressing B cell proliferation remains to be determined. It is likely that Gata3 positively regulates p16 in B cells to inhibit their proliferation. Our finding that Gata3 regulates lymphoid cell proliferation in a cell type dependent manner supports a unique role of Gata3 in coordinately controlling lymphoid cell development – Gata3 promotes T cell differentiation and proliferation, but suppresses B cell differentiation and proliferation.
Heterozygous germline deletion of Gata3 alone does not result in lymphoma development, though aberrantly differentiated B cells proliferate slightly faster than WT B cells at early ages, indicating that haploid loss of Gata3 is not sufficient to induce lymphomas. Interestingly, p18−/−;Gata3+/− mice develop B, not T, cell lymphomas despite the role of p18 loss in stimulating both T and B cells. These data indicate that Gata3 cooperates with p18 in suppressing B cell proliferation and lymphomagenesis, and that Gata3 promotes T cell proliferation partially through repression of p18. The result that p18 suppresses B cell lymphoma development is supported by the clinical finding that loss of function of p18 is frequently detected in human lymphomas, B cell lymphomas in particular [24–26].
MATERIALS AND METHODS
Mice, histopathology and immunofluorescence
The generation and genotyping of p18−/− mice have been described previously [33]. BALB/c-Tg (CMV-cre) 1Cgn/J mice were obtained from Jackson Laboratories [38]. Gata3f/f mice [37] were kindly provided by Dr. I-Cheng Ho (Harvard Medical School). NOD.Cg-Prkdcscid Il2rgtm1Wjl/SzJ (NSG) mice (6–8 weeks old) were obtained from Jackson Laboratory. The Institutional Animal Care and Use Committee at the University of Miami approved all animal procedures. Histopathology and immunofluorescent staining were performed as described previously [53, 54]. Primary antibodies used were as follows: B220 (eBioscience), CD3 (Abcam) and Ki67 (Abcam). Immunocomplexes were detected using FITC- or rhodamine-conjugated secondary antibodies (Jackson Immunoresearch). For quantification of B220 and Ki67 double positive cells, 5 random fields in at least two cut sections from each spleen were examined and at least 700 B220+ cells per field were counted (more than 3500 B220+ cells per mouse). The average percentages of Ki67 and B220 double positive cells were calculated from WT, Gata3+/−, p18−/− and p18−/−;Gata3+/− mice and the results represent the mean ± SD of three animals per group. For quantification of Ki67 positive cells in thymus, 5 random fields in at least two cut sections from each thymus were examined and at least 500 DAPI positive cells per field were counted (more than 2500 cells per thymus). The average percentages of Ki67 positive cells were calculated from WT, Gata3+/−, p18−/− and p18−/−;Gata3+/− mice and the results represent the mean ± SD of two animals per group.
Flow cytometry
Single-cell suspensions from the thymus, spleen, bone marrow (BM), and tumor were obtained. Total cell numbers in each sample was determined by an automatic cell counter (Bio-rad). One million harvested cells were stained with anti-B220-APC, anti-CD3-FITC (Bioscience), anti-IgM-PE, anti-CD4-AF700 and anti-CD8-pacific blue (Biolegend) antibodies. Cells were sorted on a BD FACS SORP Aria-IIu machine. For intracellular staining of Gata3, staining of cell surface markers were followed by fixing and permeabilizing cells with Cytofix/cytoperm fixation/permeabilization kit (BD Pharmingen). Anti-Gata3-pacific blue (Biolegend) was then added according to the manufacturer’s instructions (BD Biosciences-PharMingen). FACS was performed using the LSR–Fortessa machine (BD Pharmingen). Data analysis was performed using Kaluza software (Beckman Coulter). Absolute numbers of T and B cells were calculated using the total cell number multiplied by the percentage of T and B cells expressing specific markers divided by 100.
BrdU labeling assay
Mice were intraperitoneally injected with BrdU (50 mg/kg) in sterile phosphate-buffered saline, sacrificed 14 hours post-injection, and single cell suspensions were harvested from the BM, spleen, thymus, and lymphoma. Two million cells were stained with cell surface antigens for 30 minutes on ice, and washed twice. The pelleted cells were resuspended in Fixation/Permeabilization solution (Cytofix/cytoperm fixation/permeabilization kit, BD Pharmingen) and incubated for 20 minutes on ice. After washing, the pelleted cells were resuspended in Perm/Wash buffer with addition of pacific blue conjugated anti-BrdU antibody (Invitrogen). The cells were incubated for 1 hour at room temperature in the dark and then analyzed by FACS. BrdU and B220 doubly positive BM cells, splenocytes, or lymphoma cells as well as BrdU positive thymocytes were determined. Gating criteria for determination of BrdU+ population in cells from the BM and thymus are shown in Supplementary Figure S2.
Western blot and Q-RT-PCR
Tissue and cell lysates were prepared as previously reported [53]. Antibodies to Gata3 (HG3-31, Santa Cruz), and Gapdh (Ambion) were purchased commercially. Total RNA was extracted using the RNeasy kit (Qiagen) according to the manufacturer’s protocol and cDNA was generated using the Omniscript RT Kit (Qiagen). QRT-PCR was performed as reported [53].
LOH and IgH rearrangement analysis
For LOH analysis, genomic DNA was extracted from microdissected lymphomas or ear tissues in p18−/−;Gata3+/− mice were analyzed with PCR as we previously described [54]. Primers used for detection of Gata3 WT and knockout alleles were as follows: 5′- CCCCTTT CCCGGCTCTATCTT-3′ and 5′- GGGCCGGTTCTGC CCATT -3′; 5′-GGCATTCTCGCACGCTTCAAA-3′ and 5′-GGATGGGCACCACCCCGGTGAA -3′, respectively. DJ rearrangements of immunoglobulin heavy chain for DNA extracted from microdissected lymphomas were determined by PCR as previously described. DFS: 5′-AGGGATCCTTGTGAAGGGATCTACTACTGTG-3′ and JH4-C: 5′-AAAGACCTGCAGAGGCCATTCTTACC-3′.
Lymphoma reconstitution
2 × 10⁶ primary cells isolated from a p18−/−;Gata3+/− splenic lymphoma (immature B-cell lymphoma) or an asymptomatic spleen were injected into female NSG mice (6–8 weeks old) via tail vein (n = 3 for each group). Recipient mice were monitored daily and sacrificed four weeks post transplantation. Tissues and cells were then collected for histopathological and flow cytometric analyses.
Statistical analysis
All data are presented as the mean ± SD for at least three individual experiments for each group. Quantitative results were analyzed by two-tailed Student’s t-test. P < 0.05 was considered statistically significant. * represents P < 0.05; **, P < 0.01; and ***, P < 0.001.
ACKNOWLEDGMENTS
We thank Dr. I-Cheng Ho (Harvard Medical School) for providing Gata3fl/fl mice, Dr. Lan Wang (University of Miami) for technical support, Yisong Y Wan (University of North Carolina at Chapel Hill) for critical reading, the FACS core facility at University of Miami for cell sorting, and the DVR core facility for animal husbandry. Shiqin Liu thanks the China Scholarship Council for financial support.
CONFLICTS OF INTEREST
The authors declare no conflicts of interest.
GRANT SUPPORT
This study was supported by the Department of Defense (DoD) through a DoD Idea Award (W81XWH-10-1-0302), the Flight Attendant Medical Research Institute (FAMRI), and research funds from the University of Miami Department of Surgery and Sylvester Comprehensive Cancer Center to Xin-Hai Pei.
REFERENCES
1. Horner MJ RL, Krapcho M, Neyman N, Aminou R, Howlader N, Altekruse SF, Feuer EJ, Huang L, Mariotto A, Miller BA, Lewis DR, Eisner MP, Stinchcomb DG, et al. SEER Cancer Statistics Review, 1975–2006, National Cancer Institute. Bethesda, MD.based on November 2008 SEER data submission, posted to the SEER web site, 2009.
2. Morton LM, Wang SS, Devesa SS, Hartge P, Weisenburger DD, Linet MS. Lymphoma incidence patterns by WHO subtype in the United States, 1992–2001. Blood. 2006; 107:265–276.
3. Wang Y, Misumi I, Gu AD, Curtis TA, Su L, Whitmire JK, Wan YY. GATA-3 controls the maintenance and proliferation of T cells downstream of TCR and cytokine signaling. Nat Immunol. 2013; 14:714–722.
4. Frelin C, Herrington R, Janmohamed S, Barbara M, Tran G, Paige CJ, Benveniste P, Zuniga-Pflucker JC, Souabni A, Busslinger M, Iscove NN. GATA-3 regulates the self-renewal of long-term hematopoietic stem cells. Nat Immunol. 2013; 14:1037–1044.
5. Ku CJ, Hosoya T, Maillard I, Engel JD. GATA-3 regulates hematopoietic stem cell maintenance and cell-cycle entry. Blood. 2012; 119:2242–2251.
6. Tindemans I, Serafini N, Di Santo JP, Hendriks RW. GATA-3 function in innate and adaptive immunity. Immunity. 2014; 41:191–206.
7. Wan YY. GATA3: a master of many trades in immune regulation. Trends Immunol. 2014; 35:233–242.
8. Ho IC, Tai TS, Pai SY. GATA3 and the T-cell lineage: essential functions before and after T-helper-2-cell differentiation. Nat Rev Immunol. 2009; 9:125–135.
9. Hazenberg MD, Spits H. Human innate lymphoid cells. Blood. 2014; 124:700–709.
10. Garcia-Ojeda ME, Klein Wolterink RG, Lemaitre F, Richard-Le Goff O, Hasan M, Hendriks RW, Cumano A, Di Santo JP. GATA-3 promotes T cell specification by repressing B cell potential in pro-T cells. Blood. 2013.
11. Scripture-Adams DD, Damle SS, Li L, Elihu KJ, Qin S, Arias AM, Butler RR, 3rd, Champhekar A, Zhang JA, Rothenberg EV. GATA-3 dose-dependent checkpoints in early T cell commitment. J Immunol. 2014; 193:3470–3491.
12. Banerjee A, Northrup D, Boukarabila H, Jacobsen SE, Allman D. Transcriptional repression of Gata3 is essential for early B cell commitment. Immunity. 2013; 38:930–942.
13. Zhang J, Ding L, Holmfeldt L, Wu G, Heatley SL, Payne-Turner D, Easton J, Chen X, Wang J, Rusch M, Lu C, Chen SC, Wei L, et al. The genetic basis of early T-cell precursor acute lymphoblastic leukaemia. Nature. 2012; 481:157–163.
14. Enciso-Mora V, Broderick P, Ma Y, Jarrett RF, Hjalgrim H, Hemminki K, van den Berg A, Olver B, Lloyd A, Dobbins SE, Lightfoot T, van Leeuwen FE, Forsti A, et al. A genome-wide association study of Hodgkin’s lymphoma identifies new susceptibility loci at 2p16.1 (REL), 8q24.21 and 10p14 (GATA3). Nat Genet. 2010; 42:1126–1130.
15. Perez-Andreu V, Roberts KG, Harvey RC, Yang W, Cheng C, Pei D, Xu H, Gastier-Foster J, E S, Lim JY, Chen IM, Fan Y, Devidas M, et al. Inherited GATA3 variants are associated with Ph-like childhood acute lymphoblastic leukemia and risk of relapse. Nat Genet. 2013; 45:1494–1498.
16. Wang T, Feldman AL, Wada DA, Lu Y, Polk A, Briski R, Ristow K, Habermann TM, Thomas D, Ziesmer SC, Wellik LE, Lanigan TM, Witzig TE, et al. GATA-3 expression identifies a high-risk subset of PTCL, NOS with distinct molecular and clinical features. Blood. 2014; 123:3007–3015.
17. Iqbal J, Wright G, Wang C, Rosenwald A, Gascoyne RD, Weisenburger DD, Greiner TC, Smith L, Guo S, Wilcox RA, Teh BT, Lim ST, Tan SY, et al. Gene expression signatures delineate biological and prognostic subgroups in peripheral T-cell lymphoma. Blood. 2014; 123:2915–2923.
18. Nawijn MC, Ferreira R, Dingjan GM, Kahre O, Drabek D, Karis A, Grosveld F, Hendriks RW. Enforced expression of GATA-3 during T cell development inhibits maturation of CD8 single-positive cells and induces thymic lymphoma in transgenic mice. J Immunol. 2001; 167:715–723.
19. Hosokawa H, Tanaka T, Kato M, Shinoda K, Tohyama H, Hanazawa A, Tamaki Y, Hirahara K, Yagi R, Sakikawa I, Morita A, Nagira M, Poyurovsky MV, et al. Gata3/Ruvbl2 complex regulates T helper 2 cell proliferation via repression of Cdkn2c expression. Proc Natl Acad Sci USA. 2013.
20. Pei XH, Bai F, Smith MD, Usary J, Fan C, Pai SY, Ho IC, Perou CM, Xiong Y. CDK inhibitor p18(INK4c) is a downstream target of GATA3 and restrains mammary luminal progenitor cell proliferation and tumorigenesis. Cancer Cell. 2009; 15:389–401.
21. Sherr CJ. Cancer cell cycle. Science. 1996; 274:1672–1677.
22. Pei XH, Xiong Y. Biochemical and cellular mechanisms of mammalian CDK inhibitors: a few unresolved issues. Oncogene. 2005; 24:2787–2795.
23. Canepa ET, Scassa ME, Ceruti JM, Marazita MC, Carcagno AL, Sirkin PF, Ogara MF. INK4 proteins, a family of mammalian CDK inhibitors with novel biological functions. IUBMB Life. 2007; 59:419–426.
24. Sanchez-Aguilera A, Delgado J, Camacho FI, Sanchez-Beato M, Sanchez L, Montalban C, Fresno MF, Martin C, Piris MA, Garcia JF. Silencing of the p18INK4c gene by promoter hypermethylation in Reed-Sternberg cells in Hodgkin lymphomas. Blood. 2004; 103:2351–2357.
25. Mestre-Escorihuela C, Rubio-Moscardo F, Richter JA, Siebert R, Climent J, Fresquet V, Beltran E, Agirre X, Marugan I, Marin M, Rosenwald A, Sugimoto KJ, Wheat LM, et al. Homozygous deletions localize novel tumor suppressor genes in B-cell lymphomas. Blood. 2007; 109:271–280.
26. Bea S, Salaverria I, Armengol L, Pinyol M, Fernandez V, Hartmann EM, Jares P, Amador V, Hernandez L, Navarro A, Ott G, Rosenwald A, Estivill X, et al. Uniparental disomies, homozygous deletions, amplifications, and target genes in mantle cell lymphoma revealed by integrative high-resolution whole-genome profiling. Blood. 2009; 113:3059–3069.
27. Franklin DS, Godfrey VL, Lee H, Kovalev GI, Schoonhoven R, Chen-Kiang S, Su L, Xiong Y. CDK inhibitors p18INK4c and p27KIP1 mediate two separate pathways to collaboratively suppress pituitary tumorigenesis. Genes & Dev. 1998; 12:2899–2911.
28. Latres E, Malumbres M, Sotillo R, Martin J, Ortega S, Martin-Caballero J, Flores JM, Cordon-Cardo C, Barbacid M. Limited overlapping roles of p15INK4b and p18INK4c cell cycle inhibitors in proliferation and tumorigenesis. EMBO J. 2000; 19:3496–3506.
29. Bai F, Pei XH, Godfrey VL, Xiong Y. Haploinsufficiency of p18INK4c sensitizes mice to carcinogen-induced tumorigenesis. Mol Cell Biol. 2003; 23:1269–1277.
30. Uziel T, Zindy F, Xie S, Lee Y, Forget A, Magdaleno S, Rehg JE, Calabrese C, Solecki D, Eberhart CG, Sherr SE, Plimmer S, Clifford SC, et al. The tumor suppressors Ink4c and p53 collaborate independently with Patched to suppress medulloblastoma formation. Genes Dev. 2005; 19:2656–2667.
31. Bai F, Pei XH, Pandolfi PP, Xiong Y. p18Ink4c and Pten constrain a positive regulatory loop between cell growth and cell cycle control. Mol Cell Biol. 2006; 26:4564–4576.
32. Pei XH, Bai F, Smith MD, Xiong Y. p18Ink4c collaborates with Men1 to constrain lung stem cell expansion and suppress non-small-cell lung cancers. Cancer Res. 2007; 67:3162–3170.
33. Franklin DS, Godfrey VL, Lee H, Kovalev GI, Schoonhoven R, Chen-Kiang S, Su L, Xiong Y. CDK inhibitors p18(INK4c) and p27(Kip1) mediate two separate pathways to collaboratively suppress pituitary tumorigenesis. Genes Dev. 1998; 12:2899–2911.
34. Latres E, Malumbres M, Sotillo R, Martin J, Ortega S, Martin-Caballero J, Flores JM, Cordon-Cardo C, Barbacid M. Limited overlapping roles of P15(INK4b) and P18(INK4c) cell cycle inhibitors in proliferation and tumorigenesis. EMBO J. 2000; 19:3496–3506.
35. Kouros-Mehr H, Slorach EM, Sternlicht MD, Werb Z. GATA-3 maintains the differentiation of the luminal cell fate in the mammary gland. Cell. 2006; 127:1041–1055.
36. Buza-Vidas N, Duarte S, Luc S, Bouriez-Jones T, Woll PS, Jacobsen SE. GATA3 is redundant for maintenance and self-renewal of hematopoietic stem cells. Blood. 2011; 118:1291–1293.
37. Pai SY, Truitt ML, Ting CN, Leiden JM, Glimcher LH, Ho IC. Critical roles for transcription factor GATA-3 in thymocyte development. Immunity. 2003; 19:863–875.
38. Schwenk F, Baron U, Rajewsky K. A cre-transgenic mouse strain for the ubiquitous deletion of loxP-flanked gene segments including deletion in germ cells. Nucleic Acids Res. 1995; 23:5080–5081.
39. Ku CJ, Lim KC, Kalantry S, Maillard I, Engel JD, Hosoya T. A monoallelic-to-biallelic T-cell transcriptional switch regulates GATA3 abundance. Genes Dev. 2015; 29:1930–1941.
40. Benita Y, Cao Z, Giallourakis C, Li C, Gardet A, Xavier RJ. Gene enrichment profiles reveal T-cell development, differentiation, and lineage-specific transcription factors including ZBTB25 as a novel NF-AT repressor. Blood. 2010; 115:5376–5384.
41. Wang R, Dillon CP, Shi LZ, Milasta S, Carter R, Finkelstein D, McCormick LL, Fitzgerald P, Chi H, Munger J, Green DR. The transcription factor Myc controls metabolic reprogramming upon T lymphocyte activation. Immunity. 2011; 35:871–882.
42. Nie Z, Hu G, Wei G, Cui K, Yamane A, Resch W, Wang R, Green DR, Tessarollo L, Casellas R, Zhao K, Levens D. c-Myc is a universal amplifier of expressed genes in lymphocytes and embryonic stem cells. Cell. 2012; 151:68–79.
43. Kovalev GI, Franklin DS, Coffield VM, Xiong Y, Su L. An important role of CDK inhibitor p18(INK4c) in modulating antigen receptor-mediated T cell proliferation. J Immunol. 2001; 167:3285–3292.
44. Larijani M, Zaheen A, Frieder D, Wang Y, Wu GE, Edelmann W, Martin A. Lack of MSH2 involvement differentiates V(D)J recombination from other non-homologous end joining events. Nucleic Acids Res. 2005; 33:6733–6742.
45. Kuppers R, Klein U, Schwering I, Distler V, Brauninger A, Cattoretti G, Tu Y, Stolovitzky GA, Califano A, Hansmann ML, Dalla -Favera R. Identification of Hodgkin and Reed-Sternberg cell-specific genes by gene expression profiling. J Clin Invest. 2003; 111:529–537.
46. Stanelle J, Doring C, Hansmann ML, Kuppers R. Mechanisms of aberrant GATA3 expression in classical Hodgkin lymphoma and its consequences for the cytokine profile of Hodgkin and Reed/Sternberg cells. Blood. 2010; 116:4202–4211.
47. Atayar C, Poppema S, Blokzijl T, Harms G, Boot M and van den Berg A. Expression of the T-cell transcription factors, GATA-3 and T-bet, in the neoplastic cells of Hodgkin lymphomas. Am J Pathol. 2005; 166:127–134.
48. Kuppers R. The biology of Hodgkin’s lymphoma. Nat Rev Cancer. 2009; 9:15–27.
49. Greaves P, Clear A, Owen A, Iqbal S, Lee A, Matthews J, Wilson A, Calaminici M, Gribben JG. Defining characteristics of classical Hodgkin lymphoma microenvironment T-helper cells. Blood. 2013; 122:2856–2863.
50. Perez-Andreu V, Roberts KG, Xu H, Smith C, Zhang H, Yang W, Harvey RC, Payne-Turner D, Devidas M, Cheng IM, Carroll WL, Heerema NA, Carroll AJ, et al. A genome-wide association study of susceptibility to acute lymphoblastic leukemia in adolescents and young adults. Blood. 2015; 125:680–686.
51. Wiemels JL, de Smith AJ, Xiao J, Lee ST, Muench MO, Fomin ME, Zhou M, Hansen HM, Termuhlen A, Metayer C, Walsh KM. A functional polymorphism in the CEBPE gene promoter influences acute lymphoblastic leukemia risk through interaction with the hematopoietic transcription factor Ikaros. Leukemia. 2015.
52. Schmidt CA, Przybylski GK. What can we learn from leukemia as for the process of lineage commitment in hematopoiesis? International reviews of immunology. 2001; 20:107–115.
53. Bai F, Chan HL, Scott A, Smith MD, Fan C, Herschkowitz JI, Perou CM, Livingstone AS, Robbins DJ, Capobianco AJ, Pei XH. BRCA1 Suppresses Epithelial-to-Mesenchymal Transition and Stem Cell Dedifferentiation during Mammary and Tumor Development. Cancer Res. 2014; 74:6161–6172.
54. Bai F, Smith MD, Chan HL, Pei XH. Germline mutation of Brca1 alters the fate of mammary luminal cells and causes luminal-to-basal mammary tumor transformation. Oncogene. 2013; 32:2715–2725.