
INTRODUCTION
Treatment of patients with locally advanced head and neck squamous cell carcinoma (HNSCC) consists of a multidisciplinary therapeutic approach including surgery and either radiotherapy (RT) or chemoradiotherapy (CRT) [1, 2]. More recently, the addition of new, targeted tumor therapies to standard treatment regimens has been evaluated in clinical trials [3]. Nonetheless, any combined or intensified therapy that aims to improve prognosis can also increase the risk of acute organ toxicity [4, 5]. For HNSCC, the adverse effects comprise a skin reaction, mucositis, and severe dysphagia [6, 7], all of which diminish the patients’ quality of life and are associated with increased treatment expenses due to pain therapy or hospital admission [8]. Importantly, any high-grade acute organ toxicity (HGAOT) can even cause the interruption or cessation of the intended CRT, subsequently resulting in a substantial decrease in local control probability [5]. Because the incidence and severity of acute organ toxicity vary considerably among patients with similar disease characteristics and treatment schedules, the identification of intrinsic risk factors is essential. Previous work described the age, gender, body mass index, level of oral health, neutrophil counts, and kidney or hepatic function as patient-related risk factors [9, 10]. More recently, genetic factors [11, 12] and several inflammation markers [8] have been identified as additional putative risk factors. In animal models, for instance, increased tissue expression of COX-2 [13, 14], pro-inflammatory cytokines such as TNFα, IL-6 and IL-1β, or chemokines like CXCL1 and CCL2 were associated with radiation-induced mucositis [15]. In contrast, data on human non-tumor tissue are scarce, with the exception of a report on mucosal and submucosal leukocyte infiltration at the end of the second radiation treatment week, when focal mucositis usually occurs [16]. In contrast to the more complicated acquisition and use of tumor tissue, peripheral blood is a convenient source of diagnostic material that can be studied by quantitative methods and mirrors many immunological features. Therefore, blood analyses are increasingly used to predict the patients’ tumor response. For example, two recent studies showed a coherency between overall survival and the (modified) Glasgow Prognostic Score, or the neutrophil-lymphocyte ratio in the blood of HNSCC patients [17, 18]. Patients with squamous cell carcinoma of the esophagus treated with RT showed an association of IL-2 and IFNγ serum levels with local tumor response [19]. However, up to now only a few studies focused on therapy-associated side effects, such as the above-mentioned ones where pro-inflammatory cytokine levels were associated with an increased likelihood to develop HGAOT [19]. Since this analysis, however, did not refer to cytokine levels at the onset of therapy, its predictive value is limited.
We now postulated that the immune system’s individual makeup and potency determines the development of HGAOT in each patient, and that it might therefore be possible to identify predictive markers even before treatment is initiated. To test this hypothesis, we first conducted a post-hoc study to identify predictive markers based on the analysis of PBMCs, tumor material, whole blood, and plasma, followed by a small prospective study to validate them. Our results indicate that it is possible to predict HGAOT based on the analysis of immunological markers such as T cell abundance in blood, which might allow to optimize the multimodal treatment approaches, and thereby improve disease outcome.
RESULTS
Retrospective pilot study
The demographics of all HNSCC patients enrolled in the retrospective study are shown in Table 1. In a pilot study, which included 13 patients, information on the relative abundance of selected immune cell subtypes in PBMCs in relation to the occurrence of HGAOT was obtained at five different time points. Blood was collected six weeks before CRT (0), directly before the beginning (1), in the middle (2), and at the end of CRT (3), and two to three months afterwards during follow-up (4). PBMC samples were stained with different combinations of monoclonal antibodies and analyzed by FACS to determine the percentages of T cells, B cells, NK cells and monocytes. In addition, the ratios between CD4+ and CD8+ T cells as well as between monocytes and T cells were calculated. Analysis was restricted to the live cell population based on its forward (FSC-A) and side scatter (SSC-A) characteristics, which explains the comparably low proportion of lymphocytes in our samples (Supplementary Figure S1). The acquired parameters showed only moderate changes during the observation period, with the exception of B cell numbers, which markedly dropped after initiation of CRT (Figure 1). In contrast, the chosen immune parameters, in particular the frequencies of T cells and monocytes, differed between patients without or with HGAOT at selected time points, qualifying them as potential predictive markers (Figure 1).
Table 1: Patient demographics retrospective study
Characteristic |
All patients (N = 48) |
|
|---|---|---|
CTC < 3 |
CTC ≥ 3 |
|
Age, median years +/- sem |
63 +/- 11 |
63 +/- 9 |
Sex, N (%) |
||
Male |
17 (81) |
23 (85.2) |
Female |
4 (19) |
4 (14.8) |
Tumor site, N (%) |
||
Oropharynx |
10 (47.6) |
8* (29.6) |
Oral cavity |
2 (9.5) |
10 (37) |
Hypopharynx |
5 (23.8) |
7* (25.9) |
Larynx |
4 (19) |
3 (11.1) |
Tumor stage, N (%) |
||
T1 |
1 (4.8) |
3 (11.1) |
T2 |
4 (19) |
8 (29.6) |
T3 |
11 (52.4) |
8 (29.6) |
T4 |
5 (23.8) |
8 (29.6) |
Nodal stage, N (%) |
||
N0 |
5 (23.8) |
3 (11.1) |
N1 |
5 (23.8) |
4 (14.8) |
N2 |
11(52.4) |
18 (66.7) |
N3 |
0 |
2 (7.4) |
Histological grading, N (%) |
||
1 |
0 |
1 (3.7) |
2 |
19 (90.5) |
19 (70.4) |
3 |
2 (9.5) |
7 (25.9) |
UICC stage, N (%) |
||
I |
0 |
0 |
II |
1 (4.8) |
1 (3.7) |
III |
8 (38.1) |
5 (18.5) |
IV |
12 (57.1) |
21 (77.8) |
* tumor extended from oropharynx to hypopharynx (counted twice)
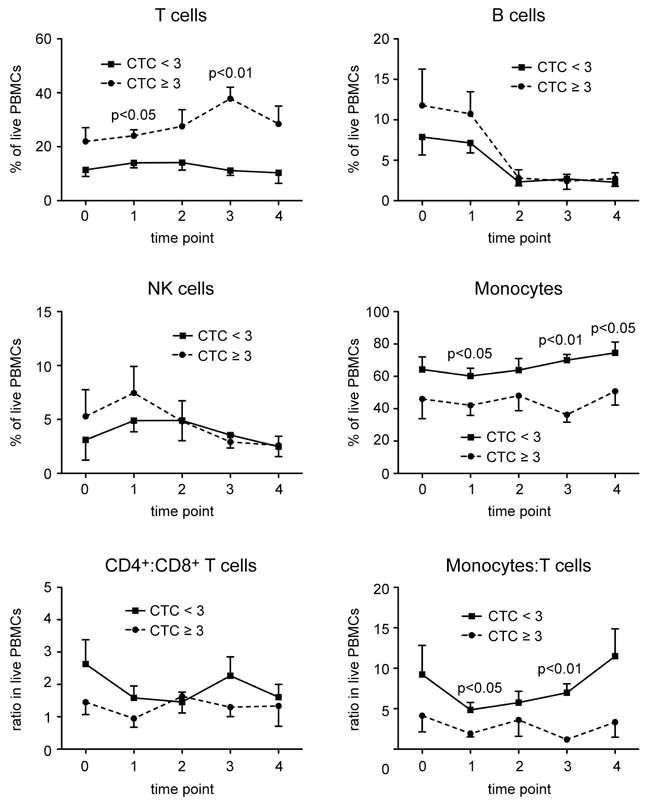
Figure 1: Changes in the frequency of different leukocyte subsets in PBMCs of HNSCC patients in the course of CRT. PBMCs were isolated from blood samples obtained six weeks before CRT (0), directly before the beginning (1), in the middle (2), and at the end of CRT (3), and two to three months afterwards during follow-up (4), and stored in liquid nitrogen until use. PBMCs were stained with several combinations of monoclonal antibodies and analyzed by FACS using the gating strategy illustrated in Supplementary Figure S1. The percentages of T cells, B cells, NK cells, and monocytes in live PBMCs, and the ratios between CD4+ and CD8+ T cells, and between monocytes and T cells in live PBMCs of HNSCC patients without (CTC<3) or with (CTC≥3) HGAOT are shown as the mean ± SEM for each time point during CRT. The solid line refers to patients with CTC<3, the dotted line refers to patients with CTC≥3. N = 6 (CTC<3), N = 7 (CTC≥3). The levels of significance were determined by Mann-Whitney U test and are depicted in the graphs; in all other cases the differences were non-significant.
Frequency of leukocyte subsets in PBMCs
Based on the results of the pilot study, all subsequent FACS measurements were exclusively performed with material obtained directly before the onset of CRT (time point 1). Considering a total of 30 patients of whom good quality PBMC samples were available, we found that the percentages of T cells, B cells and NK cells were increased in the HGAOT group, whereas the percentage of monocytes was concomitantly decreased (Figure 2). Furthermore, the ratio between monocytes and T cells was lower in patients with CTC≥3, but the ratio between CD4+ and CD8+ T cells was not altered (Figure 2). Collectively, these data indicate that the composition of PBMCs before therapy is closely linked to the development of acute organ toxicity.
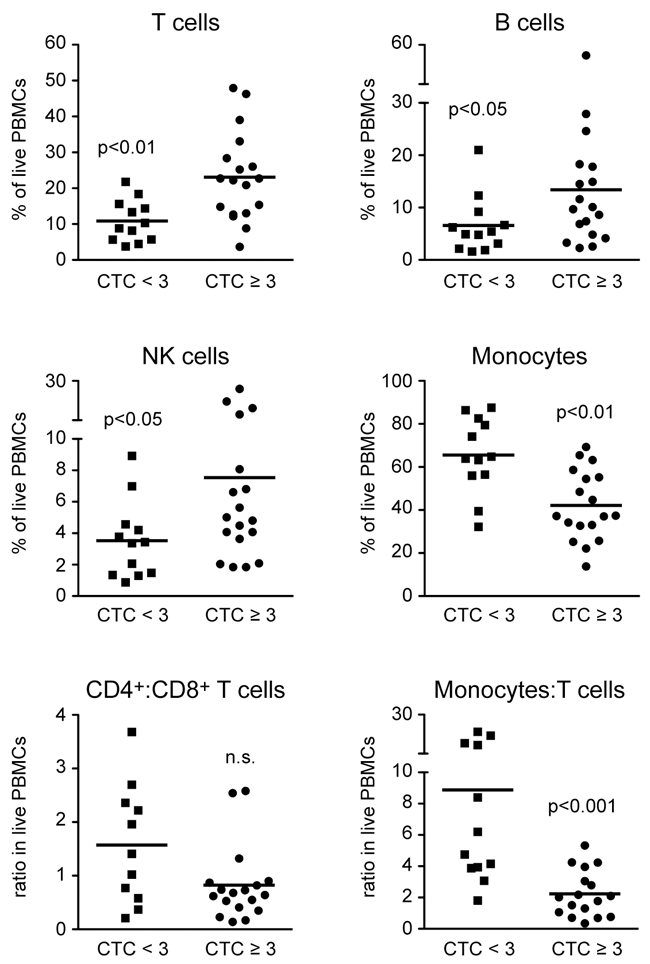
Figure 2: Frequencies of different leukocyte subsets in PBMCs of HNSCC patients directly before the beginning of CRT. PBMCs were isolated from blood samples collected directly before the beginning of CRT and stored in liquid nitrogen until use. PBMCs were stained with several combinations of monoclonal antibodies and analyzed by FACS using the gating strategy illustrated in Supplementary Figure S1. The percentages of T cells, B cells, NK cells, and monocytes in live PBMCs, and the ratios between CD4+ and CD8+ T cells, and between monocytes and T cells are shown for HNSCC patients without (CTC<3) or with (CTC≥3) HGAOT. Each symbol represents one patient, the horizontal line indicates the mean value; N = 11-12 (CTC<3), N = 17-18 (CTC≥3). The levels of significance were determined by Mann-Whitney U test and are depicted in the graphs (n.s.: non-significant).
Absolute immune cell numbers in blood
We additionally quantified the absolute numbers of different types of immune cells per ml of peripheral blood and came to similar conclusions as for the corresponding percentages. T cell, B cell and NK cell numbers were higher in patients with HGOAT whereas monocyte numbers were reduced (Figure 3). The absolute numbers of CD8+ T cells were significantly higher in the CTC≥3 group, whereas CD4+ T cell numbers did not appear to correlate with the occurrence of HGAOT (Figure 3). These findings suggest that immune cell counts in the blood of HNSCC patients are good candidates for predictive markers of treatment-related adverse effects. Of note, tests for an influence of patient age, gender, or applied therapy on immune cell counts did not reveal any associations (data not shown).
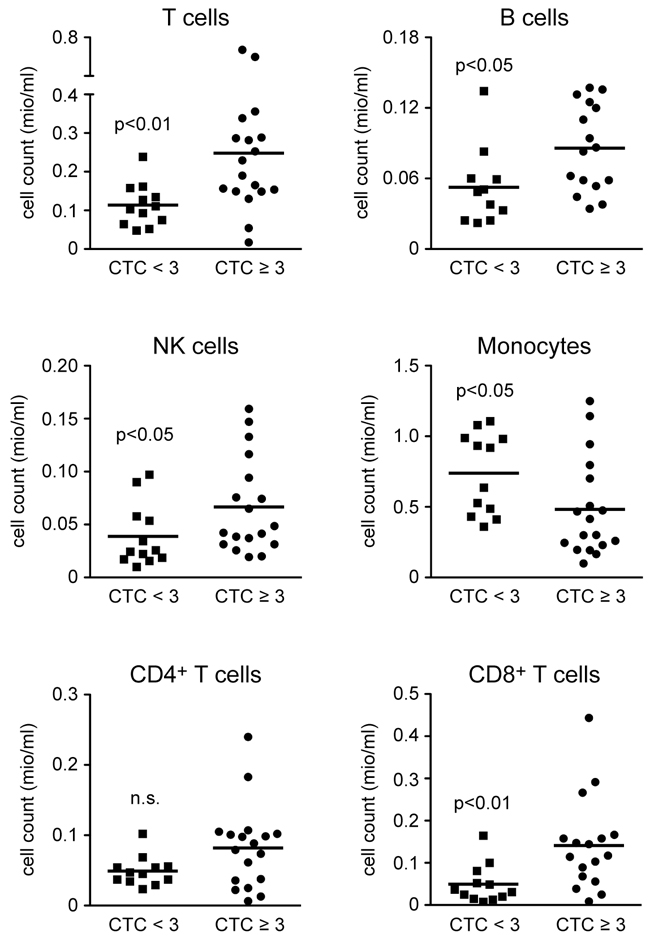
Figure 3: Absolute cell numbers of leukocyte subsets in the blood of HNSCC patients directly before the beginning of CRT. PBMCs were isolated from blood samples of a defined volume directly before the begining of CRT and stored in liquid nitrogen until use. Absolute numbers of T cells, B cells, NK cells, monocytes, CD4+ T cells, and CD8+ T cells were calculated based on the amount of PBMCs obtained from each HNSCC patients without (CTC<3) or with (CTC≥3) HGAOT after isolation by density gradient centrifugation and their individual frequencies as determined by FACS analysis. Cell counts are depicted in million cells per ml of peripheral blood. Each symbol represents one patient, the horizontal line indicates the mean value; N = 11-12 (CTC<3), N = 16-18 (CTC≥3). The levels of significance were determined by Mann-Whitney U test and are depicted in the graphs (n.s.: non-significant).
T cell infiltration in pre-treatment tumor material
Tumor material was obtained from 25 patients, either as a biopsy at the time point of diagnosis or during surgical resection, and analyzed by immunohistochemistry. Staining with an antibody against the epithelial cell marker CK AE 1/3 served to distinguish between the tumor and surrounding stromal components (Figure 4A). Since T cells in the tumor itself were often rare or absent, we limited scoring to the stroma (Figure 4A). Semi-quantitative analysis revealed that the abundance of CD4+ and CD8+ T cells was significantly higher in patients with HGAOT as compared to those ones with milder therapy-related adverse effects (Figure 4B). Furthermore, the degree of infiltration by both T cell subsets was significantly correlated (Figure 4C). We conclude that the number of T cells in situ correlates with the development of HGAOT. Interestingly, when we plotted the scores of CD4+ and CD8+ T cell infiltration in the tumor stroma against absolute total T cell numbers in the blood (see Figure 3), patients without or with HGAOT fell into two separate, non-overlapping groups that could be completely delineated from each other (Supplementary Figure S2).
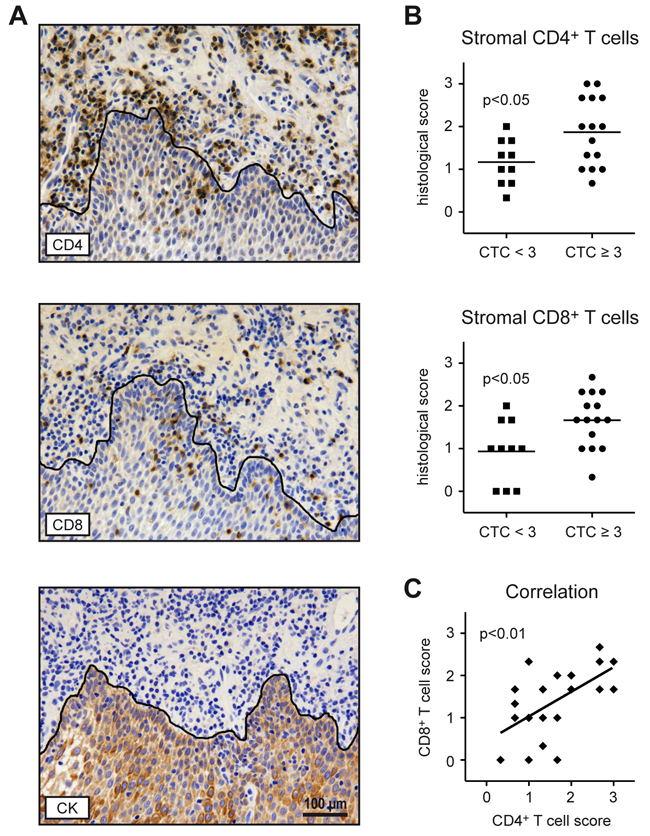
Figure 4: T cell infiltration in pre-treatment tumor material from HNSCC patients. Consecutive paraffin sections prepared from biopsies or tumor material collected during surgical resection were stained with antibodies recognizing CD4, CD8 or the epithelial cell marker CK AE 1/3. A. Representative photographs of tissue sections stained with each of the three antibodies are shown. Positively stained cells were identified by their dark brown color. The black line delineates the border between the tumor and the surrounding stromal compartment and is based on the CK AE 1/3 staining. Size bar: 100 μm. B. Semi-quantitative scoring of CD4+ and CD8+ T cells in the stroma of tumors from HNSCC patients without (CTC<3) or with (CTC≥3) HGAOT using a 3-point-scale (0 = no T cells present; 1 = weak T cell infiltration; 2 = moderate T cell infiltration; 3 = intense T cell infiltration). Each symbol represents one patient, the horizontal line indicates the mean value. C. Correlation between CD4+ and CD8+ T cell scores. Each symbol represents one patient, the solid line represents the regression curve. N = 10 (CTC<3), N = 15 (CTC≥3) for panels B and C. The levels of significance were determined by Mann-Whitney U test in panel B, and by Spearman correlation test in panel C.
Gene expression analysis of whole blood
To analyze additional immunological markers, we isolated RNA from 24 whole blood samples obtained directly before the onset of treatment (time point 1), and studied them for the expression of T cell-related markers by quantitative RT-PCR (Figure 5A). Candidate genes included Ifng (interferon gamma) and Grzb (granzyme B), which are expressed by CD8+ T cells and NK cells, and the co-inhibitory molecules Pdcd1 (programmed cell death 1) and Ctla4 (cytotoxic T lymphocyte associated protein 4) known to modulate the strength of T cell responses. In addition, we analyzed gene expression of the anti-apoptotic molecule Bcl2 (B cell lymphoma 2), and the alarmin Hmgb1 (high mobility group box 1), which has been reported to be of predictive value for HNSCC outcome [20]. Importantly, there were no differences between HNSCC patients without or with HGAOT in any of these parameters (Figure 5A). This finding indicates that the expression of the analyzed genes before the onset of treatment does not allow to predict HGAOT.
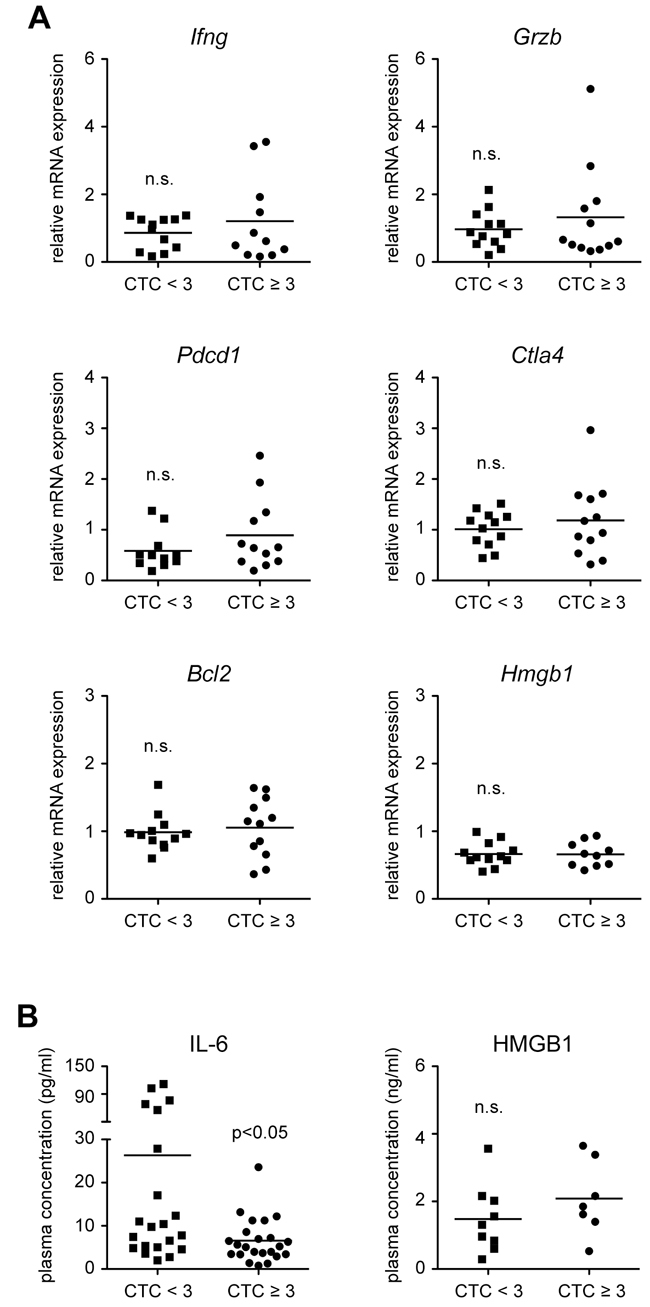
Figure 5: Gene expression in whole blood samples and levels of soluble factors in the plasma of HNSCC patients directly before the beginning of CRT. A. RNA was isolated from whole blood of HNSCC patients without (CTC<3) or with (CTC≥3) HGAOT directly before the beginning of CRT, transcribed into cDNA and analyzed by quantitative RT-PCR for the relative expression of Ifng (interferon gamma), Grzb (granzyme B), Pdcd1 (programmed cell death 1), Ctla4 (cytotoxic T lymphocyte associated protein 4), Bcl2 (B cell lymphoma 2), and Hmgb1 (high mobility group box 1); Hprt (hypoxanthine phosphoribosyltransferase) was used as a housekeeping gene. Quantification was achieved using the ΔΔCt method. Each symbol represents one patient, the horizontal line indicates the mean value; N = 11-12 (CTC<3), N = 10-12 (CTC≥3). B. Plasma was isolated from the blood of HNSCC patients without (CTC<3) or with (CTC≥3) HGAOT directly before the beginning of CRT and analyzed for the levels of IL-6 and HMGB1 by ELISA. The results are depicted as absolute values. Each symbol represents one patient, the horizontal line indicates the mean value; N = 21 (CTC<3), N = 23 (CTC≥3) for IL-6; N = 9 (CTC<3), N = 7 (CTC≥3) for HMGB1. The levels of significance in all panels were determined by Mann-Whitney U test and are depicted in the graph (n.s.: non-significant).
Cytokine and HMGB1 plasma levels
Earlier studies had indicated that soluble factors might be suitable predictive markers for the clinical outcome of HNSCC or its association with HGAOT [17-20]. It is against this background that we analyzed the levels of IL-2, IFNγ, IL-6 and TNFα in 44 plasma samples obtained directly before the onset of treatment (time point 1) by ELISA. IL-6 was significantly reduced in patients with CTC≥3 as compared to those ones experiencing milder adverse effects (Figure 5B). In contrast, plasma levels of the other three cytokines were very low at the beginning of CRT and not reliably detectable (data not shown). In agreement with our previously obtained gene expression data (see Figure 5A), plasma levels of HMGB1 were similar in both groups (Figure 5B). Collectively, the analysis of soluble factors in the blood is of limited predictive value with regard to the development of HGAOT.
Prospective validation study
Based on the superior predictive power of the abundance of immune cells in the blood as compared to gene expression in whole blood or the concentration of soluble factors in the plasma, markers were defined that might allow to predict whether patients will develop HGAOT or not. To this end, we selected six parameters and tested them in a small prospective study comprising 16 HNSCC patients. The demographics for this study are provided in Table 2. It is noteworthy that, until the end of the six weeks period of CRT, half of the enrolled patients had developed HGAOT whereas the others had not. We evaluated the percentages of T cells and monocytes, their ratio in PBMCs, and the absolute numbers of T cells, monocytes and CD8+ T cells per ml of peripheral blood. The cut-off values that we applied are depicted in Table 3. Depending on each respective factor, the occurrence of HGAOT was correctly predicted in 62-81% of the patients (Table 3). Notably, the absolute numbers of total T cells and CD8+ T cells in the blood were the two best single predictive factors amongst the six chosen parameters (Table 3). Taken together, FACS analysis of PBMCs is a promising approach to make predictions as to whether HNSCC patients will develop HGAOT or not.
Table 2: Patient demographics prospective study
Characteristic |
All patients (N = 16) |
|
|---|---|---|
CTC < 3 |
CTC ≥ 3 |
|
Age, median years +/- sem |
60 +/- 10 |
65 +/- 12 |
Sex, N (%) |
||
Male |
6 (75) |
8 (100) |
Female |
2 (25) |
0 |
Tumor site, N (%) |
||
Oropharynx |
3 (37.5) |
6 (75) |
Oral cavity |
1 (12.5) |
1 (12.5) |
Hypopharynx |
1 (12.5) |
1 (12.5) |
Larynx |
2 (25) |
0 |
CUP |
1 (12.5) |
0 |
Tumor stage, N (%) |
||
T1 |
1 (12.5) |
0 |
T2 |
2 (25) |
1 (12.5) |
T3 |
3 (37.5) |
3 (37.5) |
T4 |
1 (12.5) |
3 (37.5) |
Tx |
1 (12.5)* |
1 (12.5)** |
Nodal stage, N (%) |
||
N0 |
2 (25) |
3 (37.5) |
N1 |
2 (25) |
1 (12.5) |
N2 |
4 (50) |
4 (50) |
N3 |
0 |
0 |
Histological grading, N (%) |
||
1 |
0 |
0 |
2 |
6 (75) |
8 (100) |
3 |
2 (25) |
0 |
UICC stage, N (%) |
||
I |
0 |
0 |
II |
0 |
0 |
III |
4 (50) |
6 (75) |
IV |
4 (50) |
2 (25) |
*CUP (Cancer of Unknown Primary), **RT for nodal recurrence only
Table 3: Assessment of predictive factors in a prospective study
Predictive factor |
Cut-off value for CTC<3 |
Correct prediction, N (%) |
|---|---|---|
T cells, relative |
< 22% |
11 (68.8) |
Monocytes, relative |
> 38% |
11 (68.8) |
Monocytes:T cells, ratio |
> 1,78 |
11 (68.8) |
T cells, absolute |
< 0,25 mio/ml |
13 (81.3) |
Monocytes, absolute |
> 0,33 mio/ml |
10 (62.5) |
CD8+ T cells, absolute |
< 0,1 mio/ml |
13 (81.3) |
DISCUSSION
This study shows for the first time that differences in immunological parameters before the onset of treatment are closely connected to the development of acute organ toxicity during CRT of locally advanced stages of HNSCC, and that they can serve as predictive markers of HGAOT.
Adverse effects of CRT such as mucositis, dysphagia and a skin reaction are dose-limiting factors in CRT [21]. They result from ionizing radiation and cytotoxic drugs that damage the basal epithelium which subsequently starts to ulcerate [22]. Damaged cells are generated from the tumor as well as neighboring healthy tissue, which causes the secretion of cytokines and chemokines and leads to the local attraction of T cells, monocytes, and neutrophils. Experimental findings revealed that RT stimulates the production of several pro-inflammatory cytokines [23], enhances MHC class I expression [24], and increases susceptibility to T cell recognition and killing. CD8+ T cells are especially important in this context since their depletion was found to compromise the efficacy of RT [25, 26].
The analysis of T cell abundance in tissue samples is technically challenging. Biopsies are not always representative of the entire tissue of interest and the scoring system is difficult to standardize. Moreover, the density of T cells was described as being heterogenous within a tumor section, and to vary among individual tumors [27]. Balermpas and colleagues reported on a strong infiltration of the tumor and stroma, as well as on an infiltration of only the stroma or the tumor compartment [27]. In addition, they described differences in the prognostic value of T cell infiltration, depending on the compartment. In contrast, peripheral blood can be studied by quantitative methods such as RT-PCR, ELISA and FACS. Since T cell numbers in the tumor stroma and immune cell abundances in blood both correlated with the occurrence of HGAOT, we expected that gene expression and plasma concentrations of immunological parameters were linked to the development of adverse effects during CRT as well. However, this was not the case despite the fact that all factors that we tested had previously been implicated in T cell activity, inflammation or tumor progression. For instance, IFNγ serum levels in esophageal cancer were reported to correlate with acute organ toxicity [19], whilst we were unable to reliably detect them at all at the onset of CRT. Similarly, an upregulation of HMGB1 had been proposed to predict effective T cell reponses [20], but in our study neither gene expression nor plasma levels of HMGB1 were associated with the development of HGAOT. The only significant finding we made in this respect concerned IL-6 plasma levels. The fact that this cytokine is mainly produced by myeloid cells might explain why patients with HGAOT and a supposedly strong T cell response have lower concentrations of this cytokine in their blood. However, due to its high variability we do not recommend considering it as a predictive factor for HGAOT.
The most promising parameters, which can be easily measured in blood, are the frequencies of several leukocyte subpopulations. FACS analysis revealed that the abundance of T cells, B cells, NK cells, and monocytes in PBMCs correlated with HGAOT. Patients with a high percentage of any of the three former cell types were prone to develop treatment-related side effects whereas the frequency of monocytes was inversely linked to acute organ toxicity. A similar finding was made for the monocyte to T cell ratio, as well as for the absolute number of five different types of immune cells. To our knowledge, this is the first report revealing that frequencies and numbers of T cells and other leukocyte subsets before the onset of treatment significantly correlate with therapy-related side effects.
There are a few other studies that previously assessed the suitability of peripheral blood to obtain predictive markers of acute organ toxicity, including the analysis of chromosomal damage and micronuclei induction in blood lymphocytes [28-30]. In addition, the sensitivity of peripheral blood T cells to apoptosis induction by in vitro irradiation was linked to treatment-related toxicity in different forms of cancer [31, 32]. Although this assay appears useful it has some drawbacks. Apoptosis induction is age-dependent, immune cells are manipulated in vitro, and the mechanism behind the observed coherency is unknown. In contrast, the results shown in the present work are based on pre-treatment blood samples and are thus not dependent on any therapy-related damage induction.
Earlier investigations had revealed a coherency between HGAOT and prognosis [4, 33, 34], suggesting that the same immunological mechanisms might be responsible for the adverse effects on the one hand and the anti-tumor response on the other hand. The assumption of common traits in the development of toxicity and tumor response is supported by recent data, which indicate a correlation between CD8+ T cell infiltration and patient survival [35]. We speculate that the general makeup of the immune system could represent a link between both activities, and that patients developing severe acute organ toxicity have an immune system that is sufficiently potent to cause a strong anti-tumor response as well. We therefore hypothesize that the abundance of T cells in blood mirrors the immune system’s overall strength, which presumably impacts acute organ toxicity, T cell infiltration into the tumor, and the patients’ overall survival.
Every post-hoc study requires independent validation. As a first step in this direction we tested the six most promising predictive markers in a small prospective study. Importantly, the two best parameters, namely the absolute numbers of total T cells and CD8+ T cells, allowed to correctly assign HNSCC patients in 81% of all cases to the two groups either developing HGAOT or not. This result reconfirms that the analysis of T cells in PBMCs is a promising strategy to predict acute organ toxicity during CRT. Undoubtedly, our analyses require further independent validation in a larger prospective study, which should not only aim to test the coherency of blood T cell markers with HGAOT but also their direct association with patient survival.
MATERIALS AND METHODS
Ethics statement
Investigation has been conducted in accordance with the ethical standards and according to the Declaration of Helsinki and according to national and international guidelines and has been approved by the local ethics committee of the University of Göttingen Medical Center. Informed written consent was obtained from each subject prior to the collection of blood and tumor material.
Patient characteristics and treatment modalities
A total of 48 patients receiving postoperative CRT after curative surgery for locally advanced HNSCC were included in the retrospective study (Table 1), and a total of 16 patients with similar clinical characteristics were included in the prospective study (Table 2). Following surgery, an integrated intensity-modulated RT was applied daily, five times per week, with single fractions of 2.08 Gy up to 62.4 Gy to the primary tumor area, 1.92 Gy up to 57.6 Gy to the involved lymph nodes, and single fractions of 1.8 Gy up to 54.0 Gy to the drainage sites on both sides of the neck. The vast majority of patients additionally received concomitant low-dose (6 mg/m2/TBSA/d, i.v.) or high-dose (40 mg/m2/TBSA/d, i.v.) cisplatin combined with facultative anti-emetic medication on each RT day [36]. Biopsies were taken at the time point of diagnosis; additionally, tumor material was collected during surgical resection. Peripheral blood was drawn directly before, at different time points during, and after the treatment. The maximal grade and the onset of organ toxicity comprising a skin reaction, a mucositis and dysphagia were assessed weekly during CRT and every second week following therapy until disappearance according to the Common Toxicity Criteria for Adverse Events (CTCAE) [37]. Due to a significant impairment of the quality of life, patients were considered to suffer from HGAOT in the case of a Common Toxicity Criteria (CTC) grade 3/4 toxicity for at least one of the scored parameters. In the framework of the present study, grade 3/4 dysphagia was the prevailing adverse event, and it was observed in 24 (50%) patients. Severe mucositis (2 patients) or a severe skin reaction (1 patient) were less frequent. Concomitant treatment with cisplatin in addition to RT had no effect on the occurrence of HGAOT (data not shown).
Preparation of PBMCs
PBMCs were isolated from 14 ml heparinized whole blood by gradient centrifugation in Biocoll Separating Solution (Biochrome, Berlin, Germany) at 4°C. Buffy coats were collected and washed once in PBS. After counting, PBMCs were incubated in RPMI 1640 medium (Life Technologies, Darmstadt, Germany) supplemented with 10% FCS (Biochrome) at a concentration of 1x10⁶ PBMCs/ml for 24 hours at 37°C. Storage in liquid nitrogen was done in RPMI 1640 medium with 50% FCS and 10% DMSO in a total volume of 1 ml (Sigma, Taufkirchen, Germany).
FACS analysis
Frozen PBMC samples were quickly defrosted in a water bath at 37°C and resuspended in 10 ml PBS. After centrifugation for 7 min at 350 g, cells were resuspended in PBS plus 0.1% BSA (Sigma) and immediately used for staining with different combinations of fluorochrome-conjugated monoclonal antibodies (BioLegend, Uithoorn, Netherlands): CD3ε (clone: HIT3a, conjugation: APC), CD4 (clone: OKT4, conjugation: FITC), CD8α (clone: HIT8a, conjugation: PE), CD14 (clone: HCD14, conjugation: PE/Cy7), CD19 (clone: HIB19, conjugation: PE/Cy5), CD16 (clone: 3G8, conjugation: APC/Cy7), CD56 (clone: HCD56, conjugation: PE), HLA-DR (clone: L243, conjugation: Alexa488). A FACSCanto II device (BD Biosciences, Heidelberg, Germany) and FlowJo software (Tree Star, Ashland, OR) were used for analysis [38]. Cell viability, i.e. the percentage of cells located in the live gate, was similar in samples from patients without or with HGAOT (CTC<3: 38.3 ± 5.6%; CTC≥3: 41.5 ± 12.2%).
Immunohistochemistry
The tissue was fixed in 4% PFA, embedded in paraffin, and 2 μm sections prepared according to standard protocols. Immunohistochemical stainings were performed using rabbit-anti-CD4 (clone SP35; Zytomed Systems, Berlin, Germany; 1:100), mouse-anti-CD8 (clone C8/144B; Dako, Glostrup, Denmark; 1:50), or mouse-anti-cytokeratin (clones AE1/AE3; Dako; 1:50) antibodies. Sections were pretreated by cooking at pH=6.0 (citrate buffer, 10 mM; CD8 and AE1/3) or pH=8.0 (EDTA; CD4). Biotinylated secondary antibodies were applied at a dilution of 1:200 (GE Healthcare, Little Chalfont, UK and Jackson Immunoresearch, West Grove, USA). Sections were developed after incubation with extravidin-peroxidase (Sigma; 1:1000) and diaminobenzidine (Sigma), following standard protocols. Nuclei were counterstained with hematoxylin, and sections mounted with DPX (Sigma).
Tumor borders in slides immunostained for CD4 and CD8 were defined on the basis of cytokeratin-positivity on consecutive sections. The level of T cell infiltration in the tumor stroma was evaluated by three independent investigators after taking pictures with an Olympus BX51 microscope at a 200-fold magnification and scored as: 0 (absent), 1 (weak), 2 (moderate) and 3 (intense). In the case of disparate assessments, a mean score was calculated.
RNA isolation and quantitative RT-PCR
Total RNA was isolated from whole blood specimens collected in PAXgene Blood RNA Tubes (PreAnalytiX, Hembrechtikon, Switzerland). RNA preparation was performed with the PAXgene Blood RNA Kit (Qiagen, Hilden, Germany) according to the manufacturer’s instructions. Total RNA content was quantified spectrophotometrically and 1 μg per sample was subjected to reverse transcription using Superscript reverse transcriptase II (Invitrogen, Karlsruhe, Germany) and hexanucleotides (Roche, Mannheim, Germany) as random primers.
Quantitative RT-PCR was performed on an ABI 7500 instrument (Applied Biosystems, Darmstadt, Germany) using the SYBR mastermix from the same company. Results were normalized to mRNA expression of Hprt and evaluated using the ΔΔCt method. Primer sequences: Ifng (5’-CTGTTACTGCCAGGACCCAT-3’, 5’-TCTGTCACTCTCCTCTTTCCA-3’), Grzb (5’-GATG CAGGGGAGATCATCGG-3’, 5’-CTCGTATCAGGA AGCCACCG-3’), Pdcd1 (5’-CAGTTCCAAACCC TGGTGGT-3’, 5’-GGCTCCTATTGTCCCTCGTG-3’), Ctla4 (5’-TACCCACCGCCATACTACCT-3’, 5’-GGCA CGGTTCTGGATCAATTA-3’), Bcl2 (5’-AGATTGAT GGGATCGTTGCCT-3’, 5’-AGTCTACTTCCTCTGTG ATGTTGT-3’), Hmgb1 (5’-AGAGCGGAGAGA GTGAGGAG-3’, 5’-ATGTTTAGTTATTTTTCCTCAGCGA-3’), Hprt (5’-CCTGGCGTCGTGATTAGTGA-3’, 5’-CGAGCAAGACGTTCAGTCCT-3’). All primers were synthesized by Metabion (Planegg, Germany).
ELISA
Plasma was isolated from venous blood drawn into EDTA-treated tubes. Concentrations of soluble factors were measured using commercially available ELISA kits for IL-2, IFNγ, IL-6 and TNFα (Biolegend, Uithoorn, The Netherlands) as well as HMGB1 (IBL International, Hamburg, Germany) according to the manufacturers’ instructions.
Statistical analysis
Data were analyzed using Prism® software (GraphPad, San Diego, CA). The Mann-Whitney U test and the Spearman correlation test were applied to analyze whether immunological parameters were significantly different between both groups of patients.
ACKNOWLEDGMENTS
We would like to thank Amina Bassibas, Sarah Victoria Manz, Sandra Hoffmeister, Heidi Brodmerkel, Alexandra Bitter and Juliane Kasten-Krapp for expert technical assistance.
CONFLICTS OF INTERESTS
The authors declare no conflict of interests.
FUNDING
This work was supported by intramural funds from the University Medical Center Göttingen.
REFERENCES
1. Bar-Ad V, Palmer J, Yang H, Cognetti D, Curry J, Luginbuhl A, Tuluc M, Campling B and Axelrod R. Current management of locally advanced head and neck cancer: the combination of chemotherapy with locoregional treatments. Semin Oncol. 2014; 41:798-806.
2. Yom SS. Radiation treatment of head and neck cancer. Surg Oncol Clin N Am. 2015; 24:423-436.
3. Perri F, Pacelli R, Della Vittoria Scarpati G, Cella L, Giuliano M, Caponigro F and Pepe S. Radioresistance in head and neck squamous cell carcinoma: Biological bases and therapeutic implications. Head Neck. 2015; 37:763-770.
4. Bonner JA, Harari PM, Giralt J, Cohen RB, Jones CU, Sur RK, Raben D, Baselga J, Spencer SA, Zhu J, Youssoufian H, Rowinsky EK and Ang KK. Radiotherapy plus cetuximab for locoregionally advanced head and neck cancer: 5-year survival data from a phase 3 randomised trial, and relation between cetuximab-induced rash and survival. Lancet Oncol. 2010; 11:21-28.
5. Adelstein DJ, Li Y, Adams GL, Wagner H, Jr., Kish JA, Ensley JF, Schuller DE and Forastiere AA. An intergroup phase III comparison of standard radiation therapy and two schedules of concurrent chemoradiotherapy in patients with unresectable squamous cell head and neck cancer. J Clin Oncol. 2003; 21:92-98.
6. Cox JD, Stetz J and Pajak TF. Toxicity criteria of the Radiation Therapy Oncology Group (RTOG) and the European Organization for Research and Treatment of Cancer (EORTC). Int J Radiat Oncol Biol Phys. 1995; 31:1341-1346.
7. Gu J, Zhu S, Li X, Wu H, Li Y and Hua F. Effect of amifostine in head and neck cancer patients treated with radiotherapy: a systematic review and meta-analysis based on randomized controlled trials. PLoS One. 2014; 9:e95968.
8. Al-Dasooqi N, Sonis ST, Bowen JM, Bateman E, Blijlevens N, Gibson RJ, Logan RM, Nair RG, Stringer AM, Yazbeck R, Elad S and Lalla RV. Emerging evidence on the pathobiology of mucositis. Support Care Cancer. 2013; 21:3233-3241.
9. Pico JL, Avila-Garavito A and Naccache P. Mucositis: Its Occurrence, Consequences, and Treatment in the Oncology Setting. Oncologist. 1998; 3:446-451.
10. Schmidberger H, Rave-Fränk M, Kim S, Hille A, Pradier O and Hess CF. [Radiation-induced mucositis and neutrophil granulocytes in oral mucosa]. Strahlenther Onkol. 2003; 179:667-672.
11. Venkatesh GH, Manjunath VB, Mumbrekar KD, Negi H, Fernandes DJ, Sharan K, Banerjee S and Bola Sadashiva SR. Polymorphisms in radio-responsive genes and its association with acute toxicity among head and neck cancer patients. PLoS One. 2014; 9:e89079.
12. Goutham HV, Mumbrekar KD, Vadhiraja BM, Fernandes DJ, Sharan K, Kanive Parashiva G, Kapaettu S and Bola Sadashiva SR. DNA double-strand break analysis by gamma-H2AX foci: a useful method for determining the overreactors to radiation-induced acute reactions among head-and-neck cancer patients. Int J Radiat Oncol Biol Phys. 2012; 84:e607-612.
13. Sonis ST, O’Donnell KE, Popat R, Bragdon C, Phelan S, Cocks D and Epstein JB. The relationship between mucosal cyclooxygenase-2 (COX-2) expression and experimental radiation-induced mucositis. Oral Oncol. 2004; 40:170-176.
14. Haagen J, Krohn H, Rollig S, Schmidt M, Wolfram K and Dorr W. Effect of selective inhibitors of inflammation on oral mucositis: preclinical studies. Radiother Oncol. 2009; 92:472-476.
15. Nakashima T, Uematsu N, Shibamori M, Sakurai K and Ishida T. Establishment of an X-ray irradiation-induced glossitis model in rats: biphasic elevation of proinflammatory cytokines and chemokines. J Pharmacol Exp Ther. 2013; 347:660-668.
16. Dorr W, Hamilton CS, Boyd T, Reed B and Denham JW. Radiation-induced changes in cellularity and proliferation in human oral mucosa. Int J Radiat Oncol Biol Phys. 2002; 52:911-917.
17. Selzer E, Grah A, Heiduschka G, Kornek G and Thurnher D. Primary radiotherapy or postoperative radiotherapy in patients with head and neck cancer: Comparative analysis of inflammation-based prognostic scoring systems. Strahlenther Onkol. 2015; 191:486-494.
18. Charles KA, Harris BD, Haddad CR, Clarke SJ, Guminski A, Stevens M, Dodds T, Gill AJ, Back M, Veivers D and Eade T. Systemic inflammation is an independent predictive marker of clinical outcomes in mucosal squamous cell carcinoma of the head and neck in oropharyngeal and non-oropharyngeal patients. BMC Cancer. 2016; 16:124.
19. Ma JL, Jin L, Li YD, He CC, Guo XJ, Liu R, Yang YY and Han SX. The intensity of radiotherapy-elicited immune response is associated with esophageal cancer clearance. J Immunol Res. 2014; 2014:794249.
20. Suzuki Y, Mimura K, Yoshimoto Y, Watanabe M, Ohkubo Y, Izawa S, Murata K, Fujii H, Nakano T and Kono K. Immunogenic tumor cell death induced by chemoradiotherapy in patients with esophageal squamous cell carcinoma. Cancer Res. 2012; 72:3967-3976.
21. Rosenthal DI, Lewin JS and Eisbruch A. Prevention and treatment of dysphagia and aspiration after chemoradiation for head and neck cancer. J Clin Oncol. 2006; 24:2636-2643.
22. Marks JE. Mucosal protectants and their application for head and neck chemoirradiation. Curr Opin Oncol. 1997; 9:267-273.
23. Hallahan DE, Spriggs DR, Beckett MA, Kufe DW and Weichselbaum RR. Increased tumor necrosis factor alpha mRNA after cellular exposure to ionizing radiation. Proc Natl Acad Sci U S A. 1989; 86:10104-10107.
24. Reits EA, Hodge JW, Herberts CA, Groothuis TA, Chakraborty M, Wansley EK, Camphausen K, Luiten RM, de Ru AH, Neijssen J, Griekspoor A, Mesman E, Verreck FA, et al. Radiation modulates the peptide repertoire, enhances MHC class I expression, and induces successful antitumor immunotherapy. J Exp Med. 2006; 203:1259-1271.
25. Lee Y, Auh SL, Wang Y, Burnette B, Meng Y, Beckett M, Sharma R, Chin R, Tu T, Weichselbaum RR and Fu YX. Therapeutic effects of ablative radiation on local tumor require CD8+ T cells: changing strategies for cancer treatment. Blood. 2009; 114:589-595.
26. Burnette BC, Liang H, Lee Y, Chlewicki L, Khodarev NN, Weichselbaum RR, Fu YX and Auh SL. The efficacy of radiotherapy relies upon induction of type i interferon-dependent innate and adaptive immunity. Cancer Res. 2011; 71:2488-2496.
27. Balermpas P, Michel Y, Wagenblast J, Seitz O, Weiss C, Rödel F, Rödel C and Fokas E. Tumour-infiltrating lymphocytes predict response to definitive chemoradiotherapy in head and neck cancer. Br J Cancer. 2014; 110:501-509.
28. Jones LA, Scott D, Cowan R and Roberts SA. Abnormal radiosensitivity of lymphocytes from breast cancer patients with excessive normal tissue damage after radiotherapy: chromosome aberrations after low dose-rate irradiation. Int J Radiat Biol. 1995; 67:519-528.
29. Floyd DN and Cassoni AM. Intrinsic radiosensitivity of adult and cord blood lymphocytes as determined by the micronucleus assay. Eur J Cancer. 1994; 30A:615-620.
30. Borgmann K, Hoeller U, Nowack S, Bernhard M, Roper B, Brackrock S, Petersen C, Szymczak S, Ziegler A, Feyer P, Alberti W and Dikomey E. Individual radiosensitivity measured with lymphocytes may predict the risk of acute reaction after radiotherapy. Int J Radiat Oncol Biol Phys. 2008; 71:256-264.
31. Crompton NE, Miralbell R, Rutz HP, Ersoy F, Sanal O, Wellmann D, Bieri S, Coucke PA, Emery GC, Shi YQ, Blattmann H and Ozsahin M. Altered apoptotic profiles in irradiated patients with increased toxicity. Int J Radiat Oncol Biol Phys. 1999; 45:707-714.
32. Ozsahin M, Crompton NE, Gourgou S, Kramar A, Li L, Shi Y, Sozzi WJ, Zouhair A, Mirimanoff RO and Azria D. CD4 and CD8 T-lymphocyte apoptosis can predict radiation-induced late toxicity: a prospective study in 399 patients. Clin Cancer Res. 2005; 11:7426-7433.
33. Wolff HA, Raus I, Jung K, Schuler P, Herrmann MK, Hennies S, Vorwerk H, Hille A, Hess CF and Christiansen H. High-grade acute organ toxicity as a positive prognostic factor in primary radiochemotherapy for anal carcinoma. Int J Radiat Oncol Biol Phys. 2011; 79:1467-1478.
34. Wolff HA, Bosch J, Jung K, Overbeck T, Hennies S, Matthias C, Hess CF, Roedel RM and Christiansen H. High-grade acute organ toxicity as positive prognostic factor in primary radio(chemo)therapy for locally advanced, inoperable head and neck cancer. Strahlenther Onkol. 2010; 186:262-268.
35. Balermpas P, Rödel F, Rödel C, Krause M, Linge A, Lohaus F, Baumann M, Tinhofer I, Budach V, Gkika E, Stuschke M, Avlar M, Grosu AL, et al. CD8+ tumour-infiltrating lymphocytes in relation to HPV status and clinical outcome in patients with head and neck cancer after postoperative chemoradiotherapy: A multicentre study of the German cancer consortium radiation oncology group (DKTK-ROG). Int J Cancer. 2016; 138:171-181.
36. Wolff HA, Overbeck T, Roedel RM, Hermann RM, Herrmann MK, Kertesz T, Vorwerk H, Hille A, Matthias C, Hess CF and Christiansen H. Toxicity of daily low dose cisplatin in radiochemotherapy for locally advanced head and neck cancer. J Cancer Res Clin Oncol. 2009; 135:961-967.
37. Trotti A, Colevas AD, Setser A, Rusch V, Jaques D, Budach V, Langer C, Murphy B, Cumberlin R, Coleman CN and Rubin P. CTCAE v3.0: development of a comprehensive grading system for the adverse effects of cancer treatment. Semin Radiat Oncol. 2003; 13:176-181.
38. Wüst S, van den Brandt J, Tischner D, Kleiman A, Tuckermann JP, Gold R, Lühder F and Reichardt HM. Peripheral T cells are the therapeutic targets of glucocorticoids in experimental autoimmune encephalomyelitis. J Immunol. 2008; 180:8434-8443.