
INTRODUCTION
Testicular type II germ cell cancers arise from a common precursor lesion, termed germ cell neoplasia in situ (GCNIS) [1–3]. GCNIS cells are the result of a defective germ cell development, where a primordial germ cell (PGC) is thought to suffer from genetic aberrations leading to a developmental arrest [2, 4]. GCNIS cells eventually differentiate into the invasive type II germ cell cancers (GCCs), which are subdivided into seminomas and non-seminomas [2]. Seminomas are highly similar to GCNIS and PGCs regarding gene expression and histology [2]. Contrarily, the stem cell population of the non-seminomas, the embryonal carcinoma (EC) shows features of totipotency and is therefore able to differentiate into all three germ layers (teratomas) and extraembryonic tissues (yolk-sac tumors, choriocarcinomas).
Familial predisposition, environmental parameters like exposure towards fertilizers, fine dust, endocrine disruptors and hormones are discussed as risk factors for development of GCCs [5]. Additionally, presence of the testicular dysgenesis syndrome (cryptorchidism, azoospermia and testicular atrophy) increases the risk for GCC development [6, 7].
Generally, GCCs are treated by orchiectomy and depending on stage with chemo- or radiotherapy in addition. Early stage seminomas are very radiosensitive. Thus, stage I - IIb seminomas are treated by radiotherapy, whereas non-seminomas are treated with chemotherapy. More advanced stages of seminoma or patients that do not tolerate radiotherapy also receive chemotherapy. Although most GCCs are sensitive towards a cisplatin-based therapy, approximately 20 - 50% of patients with metastatic disease cannot be cured by standard chemotherapy due to resistance mechanisms [8]. Thus, there is a strong need for new therapeutic options to treat cisplatin-resistant disease. In this study, we treated GCC lines with the histone deacetylase inhibitor (HDI) romidepsin (ISTODAX, FK228, FR901228) to elaborate on the molecular mechanism and to address the question whether it is a therapeutic option for GCCs.
RESULTS
We reported previously that treatment of seminoma-like TCam-2 cells with romidepsin rapidly induced apoptosis [9]. Based on this initial finding, we asked if romidepsin might also be toxic to other GCC cell lines. Thus, in this study we analyzed its molecular mode of action in vitro and in vivo and elaborated on the potential of romidepsin as a new therapeutic for GCCs.
We utilized GCC cell lines and corresponding cisplatin-resistant subclones. The cell line TCam-2 was used as a proxy for a seminoma, while the three cell lines 2102EP, NCCIT and NT2/D1 were derived from ECs and the two cell lines JAR and JEG-3 resemble a choriocarcinoma in culture [10–14]. As controls we included human primary fibroblasts (MPAF, ARZ, EMF) and the Sertoli cell line (FS1) [15].
Romidepsin efficiently kills GCC cells in vitro and in vivo
First, we treated seminoma-like TCam-2, the EC cell lines 2102EP and NCCIT as well as the choriocarcinoma-like JAR and JEG-3 cells with various concentrations (1 - 80 nM) of romidepsin for 24h and measured viability by a XTT assay (Supplementary Figure S1A). For comparison, cells were also treated with other HDIs (TSA, VPA, SAHA) and cisplatin. Romidepsin reduced viability starting from ≥ 5 nM, while VPA, SAHA and cisplatin had no detectable effect on viability at concentrations applied (Supplementary Figure S1A). Besides romidepsin, only TSA reduced viability of analyzed cell lines, but at much higher doses compared to romidepsin.
To determine the minimal effective concentration of romidepsin, we treated GCC cell lines once with 1 - 10 nM romidepsin and measured the effects on cell viability by XTT assays for 96h (Figure 1). While 1 nM had negligible effects on cell viability, a single application ≥ 2 nM strongly reduced viability in a dose-, time- and cell line-dependent manner within 4 days (Figure 1). These analyses demonstrate that GCC lines are highly susceptible to romidepsin treatment.
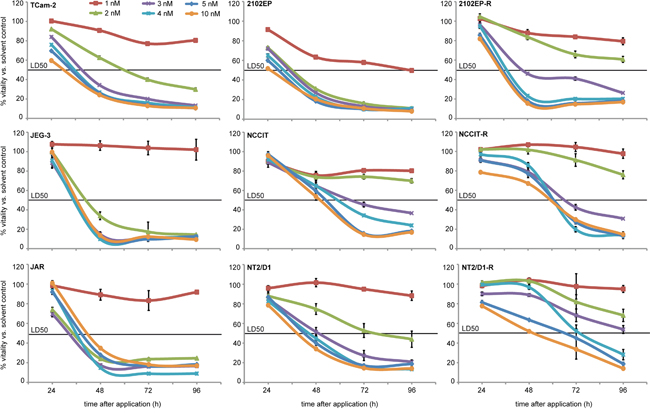
Figure 1: XTT assays of indicated GCC cell lines 24 - 96h after application of 1 - 10 nM romidepsin. Standard deviation is given above each data point.
Next, we analyzed whether romidepsin kills GCC cells in an in vivo tumor model. To mimic GCCs, we xenografted 2102EP, 2102EP-R, NCCIT and NCCIT-R cells into the flank of nude mice and allowed tumors to grow for two weeks (-R = cisplatin-resistant subclone). Afterwards, we applied romidepsin (2 mg/kg) intravenously three times a week and monitored tumor growth for 10 days. Lately after 7 days, tumor sizes were significantly reduced in romidepsin treated mice compared to the control mice (Figure 2). We confirmed induction of apoptosis by detection of PARP cleavage in romidepsin treated mice bearing 2102EP-R and NCCIT-R tumors (Supplementary Figure S1B). In conclusion, romidepsin efficiently kills tumor cells in vivo by inducing apoptosis.
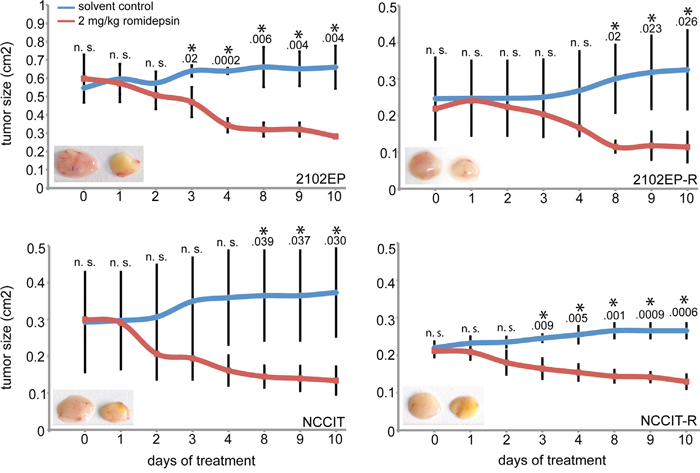
Figure 2: Measurement of the tumor burden during treatment of xenografted 2102EP(-R) and NCCIT(-R) cells with 2.5 mg/kg romidepsin or the solvent for 10 days. Inlay: photos of tumors of solvent (left) and romidepsin (right) treated mice after 10 days. n. s. = not significant, p-value > 0.05; asterisk = significant, p-value < 0.05.
GCC cells mainly utilize HDAC1 for histone deacetylation
Next, we were interested in alterations of molecular mechanisms induced by romidepsin in GCCs. HDIs like Romidepsin inhibit histone deacetylases (HDACs). Re-analyzing an expression microarray of GCC tissues published in a previous study [12] and a qRT-PCR analysis of GCC cell lines revealed that HDAC1 is highly expressed in all GCCs, GCC cell lines, human fibroblasts (ARZ, MPAF) and the Sertoli cell line (FS1) (Supplementary Figure S1C, S1D). All other analyzed HDACs showed a lower expression compared to HDAC1 in all analyzed GCC samples (Supplementary Figure S1C, S1D), indicating that GCCs might mainly utilize HDAC1 for histone deacetylation.
Romidepsin causes hyperacetylation of histones H3 and H4
Since inhibition of HDACs should lead to histone hyperacetylation, we analyzed the pan-acetylation status of histones 3 and 4 (pan-H3ac / -H4ac) 2 - 16h after 10 nM romidepsin treatment of GCC cell lines, fibroblasts and the Sertoli cell line FS1. As shown by western blotting, within 2 - 16h after treatment H3 and H4 became hyperacetylated in all samples analyzed (Supplementary Figure S2A, S2B). In parallel, an ELISA-based quantification method revealed strong reduction of HDAC activity in protein lysates of TCam-2 and NCCIT cells 4 - 16h after romidepsin application (Supplementary Figure S2C). So, romidepsin reduced the activity of HDACs, leading to pan-H3 / H4 hyperacetylation.
Romidepsin induces apoptosis and affects the cell cycle in vitro
Our XTT assays demonstrated that GCC cell lines display reduced proliferation / viability rates after romidepsin application. A PI-FACS analysis 16h after romidepsin treatment found a strong enrichment of GCC and fibroblast (MPAF, ARZ) cells in G2/M-phase of the cell cycle, while FS1 cells enriched in the G1/G0-phase (Figure 3A). Thus, GCC cell lines enrich in G2/M-phase of the cell cycle in response to romidepsin, which might be indicative of a G2-arrest.
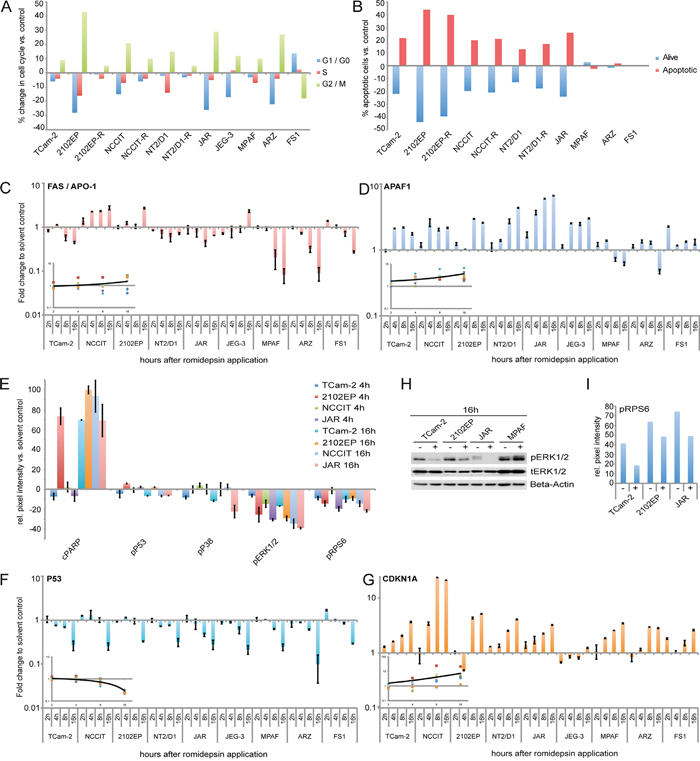
Figure 3: A, B. FACS-based cell cycle (A) and apoptosis (B) analysis of GCC cell lines, fibroblasts and FS1 cells 16 / 24h after 10 nM romidepsin application. C, D. qRT-PCR analysis of FAS / APO-1 and APAF1 in GCC cell lines, fibroblasts and FS1 cells 2 - 16h after 10 nM romidepsin treatment. Inlays: averaged expression changes over time (GCC cell lines only). E. PathScan analysis of indicated signaling molecules in GCC cell lines treated with 10 nM romidepsin for 4 and 16h. F, G. qRT-PCR analysis of P53 and CDKN1A in GCC cell lines, fibroblasts and FS1 cells 2 - 16h after 10 nM romidepsin treatment. Inlays: averaged expression changes over time (GCC cell lines only). H. Western blot analysis of MAPK signaling factors in GCC cells and fibroblasts 16h after 10 nM romidepsin treatment. I. Densiometric evaluation of western blot data (Supplementary Figure S3G) of pRPS6 in GCC cell lines 16h after 10 nM romidepsin treatment.
Apoptosis was detected by a FACS-based AnnexinV / 7AAD analysis. Induction of apoptosis was seen in GCC cells treated with romidepsin (TCam-2, 2102EP(-R), NCCIT(-R), NT2/D1(-R) and JAR), while no apoptosis was observed in fibroblasts or the Sertoli cell line (Figure 3B). FAS and APAF1 are markers for the death-receptor and intrinsic mitochondrial apoptosis pathway, respectively. FAS was only slightly deregulated in GCC cell lines, while APAF1 was strongly upregulated in all GCC cell lines after romidepsin application (Figure 3C, 3D). This suggests that in response to romidepsin all GCC cells mainly induce apoptosis via the intrinsic mitochondrial pathway. Importantly, a strong downregulation of FAS and a nearly unchanged APAF1 expression was found in all control cells (MPAF, ARZ, FS1), matching the observation that these cells do not initiate apoptosis in response to the concentrations of romidepsin, which are cytotoxic for GCC cell lines (Figure 3B, 3C, 3D).
Alterations in signaling pathways in response to romidepsin
We performed a PathScan array, which detects the phosphorylation or cleavage status of 18 signaling molecules to identify signaling pathways activated by romidepsin (Supplementary Figure S3A). In all cell lines analyzed (TCam-2, 2102EP, NCCIT, JAR), we found a strong induction of PARP cleavage (Asp214) 16h after romidepsin application, further confirming induction of apoptosis (Figure 3E). By western blotting we verified cleavage of PARP in romidepsin treated TCam-2 cells, while no cleavage was found in fibroblasts, further suggesting that romidepsin does not induce apoptosis in fibroblasts (Supplementary Figure S3B).
Additionally, we detected nearly unchanged phosphorylation (p) of P53 (Ser15) after romidepsin treatment (Figure 3E). Further to very low levels of pP53 (Figure 3E), we detected downregulation of P53 expression in all analyzed cell lines, while the P53 downstream effector CDKN1A was strongly upregulated (except in JEG-3) (Figure 3F, 3G). CDKN1A upregulation was verified by western blotting in TCam-2, JAR and MPAF (Supplementary Figure S3C). By qRT-PCR analysis, we confirmed that the cisplatin-resistant GCC cell lines also upregulated CDKN1A, while P53 was downregulated (2102EP-R) or remained unchanged (NCCIT-R, NT2/D1-R) (Supplementary Figure S3D). These findings confirm previous findings demonstrating that GCC cell lines induced CDKN1A in a P53-independent manner [16]. In P53-deficient human colon cancer cells CDKN1A induction is associated with G2/M-phase arrest [17]. Thus, upregulation of CDKN1A might contribute to enrichment of the cells in G2/M-phase after romidepsin application.
We found strongly reduced pERK1/2 (Thr202/Tyr204) levels in all GCC cells by the PathScan array (Figure 3E) and confirmed this finding by western blot analysis of TCam-2 and 2102EP cells (Figure 3F). Additionally, all analyzed cell lines showed reduced phosphorylation of the ERK1/2 signaling downstream target ribosomal protein S6 (RPS6; Ser235/Ser236) (Figure 3E, 3G; Supplementary Figure S3B). Decreased pRPS6 is associated with growth arrest. Thus, romidepsin treatment leads to a diminished pERK1/2 activity, resulting in reduced pRPS6 levels, which might contribute to the alterations in the cell cycle, i. e. enrichment in G2/M-phase.
Dynamics of histone acetylation and gene expression in response to romidepsin
Since romidepsin inhibits HDACs, leading to histone hyperacetlyation, we performed ChIP-seq. against pan-H3ac in romidepsin / solvent treated TCam-2 to analyze the changes in detail. Pooled input DNA was used as control. In total, 8907 loci showed an at least 2-fold change in pan-H3ac occupation upon treatment with romidepsin compared to the solvent control (881 loci increased in pan-H3ac, 8026 loci decreased in pan-H3ac) (Supplementary Data S1A). These results demonstrate that a large number of loci seem to escape the global hyperacetylation induced by chromatin-wide inhibition of HDACs by romidepsin.
To analyze, whether the changes in acetylation caused by romidepsin correspond to changes in gene expression we next performed an expression microarray analysis of TCam-2 cells treated with 10 nM romidepsin for 8 and 16h (Supplementary Data S1B, S1C). Surprisingly, only 197 genes were upregulated and 125 genes were downregulated (≥ 2-fold) 16h after romidepsin application (Supplementary Data S1C). 16 of the 197 upregulated genes showed an increase in H3ac upon romidepsin treatment, while 84 of the 125 downregulated genes became hypoacetylated (Supplementary Data S1A). These findings suggest that the expression of a small fraction of genes is affected by romidepsin-mediated HDAC inhibition.
Genes commonly deregulated upon romidepsin treatment in GCCs
To identify genes commonly deregulated in response to romidepsin, we extended our expression microarray analysis to 2102EP, NCCIT and JAR cells treated with 10 nM romidepsin for 8 and 16h (Supplementary Data S1B, S1C). In general, the number of deregulated genes increased from 8 to 16h after treatment and more genes were upregulated than downregulated (Supplementary Figure S4A). A Venn diagram (Figure 4A) shows that 2 genes (DHRS2, GADD45B) were commonly upregulated between the GCC cells 8h after romidepsin application, while 27 genes were deregulated after 16h (23 upregulated, 4 downregulated) (fold change (FC) ≥ Log22) (Figure 4A, 4B; Supplementary Data S1D).
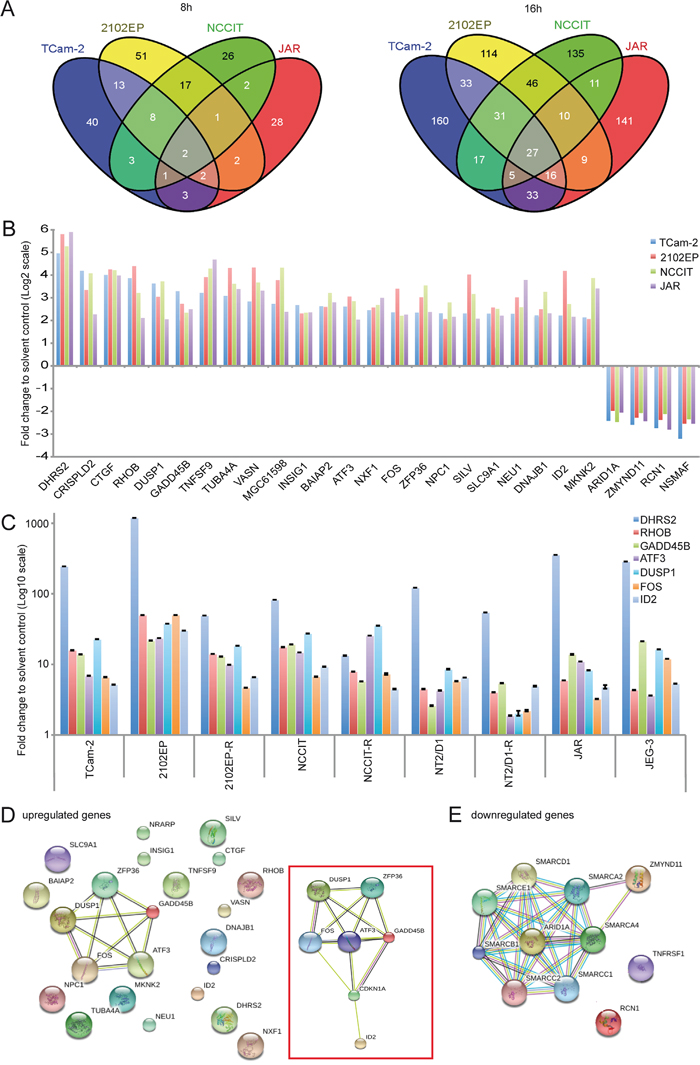
Figure 4: A. Venn diagrams of commonly expressed genes between GCC cell lines 8 and 16h after romidepsin treatment as found by expression microarray analysis. B. Expression levels of the 27 commonly deregulated genes (23 upregulated, 4 downregulated) in GCC cell lines. C. qRT-PCR verification of selected deregulations in romidepsin treated (16h) GCC cell lines. D, E. STRING protein-protein-interaction prediction of the 23 upregulated genes (D) and 4 downregulated genes (E). An extended network, including CDKN1A is illustrated in the red box (D).
From the 23 upregulated genes, four genes (BAIAP2, DNAJB1, MKNK2, SLC9A1) showed increased H3ac levels upon romidepsin treatment of TCam-2 cells (Figure 4B; Supplementary Data S1A). Additionally, two of the four downregulated genes (ARID1A, ZMYND11) showed a decrease of H3ac in romidepsin treated TCam-2 (Figure 4B; Supplementary Data S1C, S1D).
As already demonstrated, CDKN1A was upregulated in all analyzed cell lines (FC ≥ Log21,5 ≤ Log22) (Supplementary Data S1E). We further verified upregulation of DHRS2, RHOB, GADD45B, ATF3, DUSP1, FOS and ID2 in GCC cell lines (Figure 4C). By western blotting, we verified upregulation of GADD45B in 2102EP, NCCIT and JAR cells as well as upregulation of ID2 in 2102EP-R, NCCIT-R and NT2/D1-R (Supplementary Figure S3E).
A STRING analysis of the 23 upregulated genes predicted interaction of the stress-sensors DUSP1, GADD45B, ATF3 as well as the immediate early gene FOS and the ring finger protein ZFP36, suggesting that this network mediates the romidepsin-provoked stress- and apoptosis-response (Figure 4D). When manually including CDKN1A to the dataset, the interaction network was extended to CDKN1A and ID2 (Figure 4D, inlay). H3ac levels across the gene bodies of these romidepsin-response genes (ATF3, DUSP1, FOS, GADD45B, ID2, ZFP36, CDKN1A) were already high in the solvent control and did not increase further under romidepsin treatment of TCam-2 cells (Supplementary Figure S3F). Thus, these data show that upregulation of these genes occurs independent of euchromatin formation.
On the other hand, STRING analysis of downregulated genes predicted interaction of ARID1A and ZMYND11 with members of the ATP-dependent SWI/SNF-chromatin-remodeling-complex (SMARCs) (Figure 4E). As mentioned before, in TCam-2 cells downregulation of ARID1A correlates to decreasing H3ac levels at the promotor under romidepsin treatment (Supplementary Data S1A). So downregulation of ARID1A seems to be the result of heterochromatin formation.
Upon romidepsin application, the EC cell lines 2102EP and NCCIT cells tended to downregulate EC-, self-renewal- and pluripotency-associated genes NANOG, OCT3/4, SOX2, DPPA3, DPPA4, GDF3, LIN28A, ZFP42, SALL4, PRDM14, ZIC3, UTF1, DNMT3B, BCAT1, SPRY4, YAP1 and NODAL (only 2102EP) (Supplementary Data S1D). Choriocarcinoma-like JAR cells downregulated DPPA3, LIN28, ZFP42, SALL4, DNMT3L and YAP1. TCam-2 cells showed downregulation of NANOG, OCT3/4, DPPA4, GDF3, SPRY4, YAP1, UTF1 as well as LIN28 and further downregulated the seminoma-associated genes SOX17, IGF1 and PRDM1 (Supplementary Data S1D). In TCam-2, downregulation of IGF1, DPPA4, SPRY4, YAP1 and ZSCAN10 correlated to decreasing H3ac levels at corresponding genomic loci, suggesting that expression of these factors might be silenced by heterochromatin formation (Supplementary Data S1A). These findings demonstrate that romidepsin application results in downregulation of pluripotency-related genes and EC / seminoma markers in TCam-2 and non-seminomatous GCC cells.
To measure the genome-wide effects of romidepsin on gene expression of our control cells, we performed a microarray analysis of fibroblasts and the Sertoli cell line FS1 8 and 16h after 10 nM romidepsin treatment. In general, control cells seemed less affected by a romidepsin treatment since only little changes in gene deregulation could be detected (Supplementary Figure S4A vs. S4B). We found significant deregulation of 12 (8h) and 47 (16h) genes in both fibroblast cultures (FC ≥ Log22) (Supplementary Figure S4C, Supplementary Data S1F). We detected a common deregulation of 3 genes after 8h and 37 genes after 16h between fibroblasts and FS1 cells (Supplementary Figure S4C, Supplementary Data S1G). A comparison of the genes deregulated in fibroblasts and FS1 to the set of genes deregulated in GCC cell lines revealed a common upregulation of 4 genes (DHRS2, RHOB, CRISPLD2, BAIAP2) (Supplementary Figure S4C, Supplementary Data S1H). STRING analysis however could not predict any interaction between those 4 genes (Supplementary Data S1H). We verified upregulation of DHRS2 and RHOB expression in fibroblasts, FS1 and GCC cells by qRT-PCR analysis (Supplementary Figure S4D).
ARID1A is an important mediator of the romidepsin response in GCC cell lines
Our microarray analysis demonstrated that ARID1A, a member of the chromatin-remodelling SWI/SNF-complex is strongly downregulated upon romidepsin treatment of GCC cells. Additionally, the ChIP-seq analysis suggested that a decrease in acetylation of the chromatin covering the ARID1A promotor might repress ARID1A expression (Figure 5A, red box). The SWI/SNF-complex is involved in induction of cellular senescence and apoptosis as well as in oncogenesis and is required for transcriptional activation or repression of genes by chromatin-remodelling [18]. Thus, downregulation of the SWI/SNF-complex member ARID1A might influence chromatin-remodeling processes, resulting in altered transcription and DNA synthesis rates. So we analyzed the role of ARID1A in the molecular cascade of the romidepsin response in more detail.
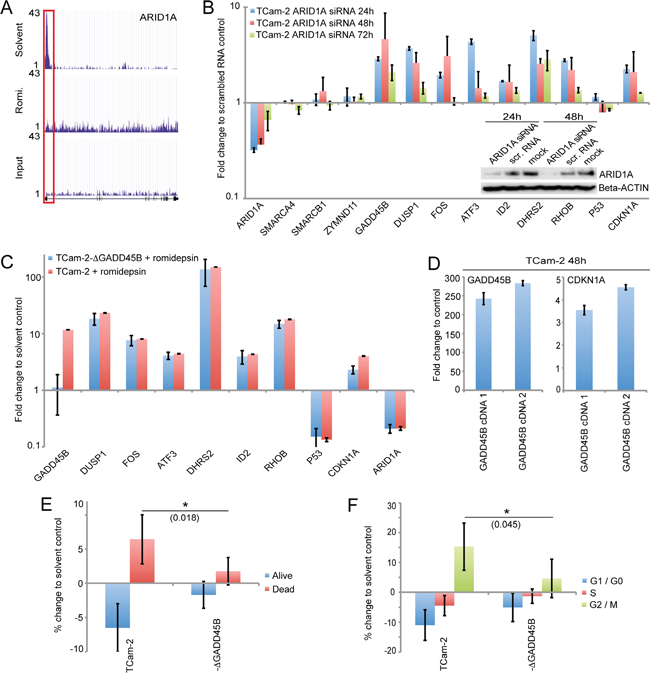
Figure 5: A. H3ac levels across the ARID1A gene as illustrated by the ‘UCSC Genome Browser’. The red box highlights the promotor region. B. qRT-PCR and western blot analysis (inlay) of indicated genes 24 - 72h after ARID1A siRNA transfection of TCam-2 cells. C. qRT-PCR analysis of indicated genes in parental and GADD45B-deficient TCam-2 cells 16h after treatment with romidepsin. Samples were normalized to corresponding solvent controls. D. qRT-PCR analysis of GADD45B and CDKN1A in TCam-2 cells transiently overexpressing GADD45B cDNA (1: 0.75 μg plasmid transfected, 2: 1 μg plasmid transfected). E, F. Annexin / 7AAD- (E) and PI-FACS (F) analysis of apoptosis and cell cycle distribution 16h after romidepsin treatment of TCam-2 and TCam-2-ΔGADD45B (-ΔGADD45B) cells. p-values were calculated by two-tailed Student’s t-test and are given above the bars (* = significant; p-value < 0.05).
First, we knocked down ARID1A by siRNA in TCam-2 cells and analyzed the expression of factors identified in this study. We achieved a strong ARID1A knock down 24 and 48h after transfection (ca. 70%), while 72h post transfection, ARID1A mRNA levels recovered to 35% (Figure 4B). Reduction of ARID1A protein levels was verified by western blot analysis (Figure 4B). 24 - 48h after knockdown, we detected upregulation of GADD45B, DUSP1, FOS, ATF3, DHRS2, RHOB, ID2 and CDKN1A, while levels of ZMYND11 SMARCA4 and SMARCB1 remained unchanged (Figure 5B). After 72h expression levels of these factors began to normalize, correlating to recovering ARID1A mRNA levels.
We confirmed these results by transducing TCam-2 cells with four different ARID1A shRNA constructs and measured changes in gene expression after eight days (Supplementary Figure S5A). Efficient downregulation of ARID1A was demonstrated by qRT-PCR and western blot analysis, respectively (Supplementary Figure S5A). Again, we found upregulation of GADD45B, DUSP1, FOS, ATF3, DHRS2, RHOB, ID2 and CDKN1A as well as unchanged P53 expression. In conclusion, downregulation of ARID1A during a romidepsin treatment contributes to upregulation of stress, cell cycle and apoptosis regulators.
Of note, pluripotency in murine embryonic stem cells is maintained by SWI/SNF-complex activity and its component ARID1A contributes to proper expression of OCT3/4, SOX2 and UTF1 [19]. Vice versa, pluripotency factors, like NANOG, GDF3, OCT3/4 and SOX2 interact with SWI/SNF-complex members and influence higher order chromatin structure at pluripotency-associated gene promotors [20]. After romidepsin treatment, we detected downregulation of pluripotency factors in the EC lines 2012EP and NCCIT as well as the seminoma-like TCam-2 (Supplementary Data S1E). In TCam-2 cells, an ARID1A shRNA-mediated knock down resulted in downregulation of NANOG, OCT3/4, LIN28 and GDF3 expression and H3ac levels strongly decreased in pluripotency-associated gene promotors upon romidepsin application (Supplementary Figure S5B, S5C). Thus, we postulate that ARID1A supports the expression of pluripotency factors in GCC cell lines.
GADD45B contributes to induction of apoptosis and affects the cell cycle
Upon cellular stress, GADD45B induces apoptosis and growth arrest [21]. GADD45B is upregulated in romidepsin treated GCC cells and after ARID1A knock down in TCam-2 cells (this study). So, does GADD45B contribute to induction of apoptosis and cell cycle alterations in response to romidepsin? Here, we established five GADD45B-deficient TCam-2 clones (TCam-2-ΔGADD45B1 - 5) by the gene-editing CRISPR/Cas9 technique (Supplementary Figure S5D). Three clones (1, 2, 4) displayed a 157 bp and a 518 bp band in a genotyping PCR, indicating that CRISPR/Cas9-mediated gene-editing resulted in a 902 bp and a 541 bp deletion, respectively. Two clones (3, 5) displayed a 541 bp deletion on both alleles. No band corresponding to the wildtype GADD45B locus was found in the TCam-2-ΔGADD45B clones. These data validate successful deletion of GADD45B in the TCam-2-ΔGADD45B clones.
A qRT-PCR analysis after treatment with romidepsin demonstrated induction of GADD45B in the parental TCam-2 cells and no expression in TCam-2-ΔGADD45B clones (Figure 5C). Interestingly, in TCam-2-ΔGADD45B cells upregulation of CDKN1A is only half the level compared to parental TCam-2 cells.
Further overexpression of GADD45B in TCam-2 cells by transfecting two different amounts of a GADD45B cDNA-coding plasmid (1: 0.75 mg, 2: 1 mg) resulted in a dose dependent upregulation of CDKN1A (Figure 5D). These data suggest that GADD45B contributes to the upregulation of CDKN1A. Notably, expression levels of the other stress sensors and apoptosis as well as cell cycle regulators remained unchanged between parental TCam-2 and TCam-2-ΔGADD45B clones, suggesting that GADD45B has no influence on the expression of these factors (Figure 5C).
We asked if GADD45B-deficiency attenuates romidepsin-induced apoptosis and cell cycle alterations. Indeed, an Annexin V / 7AAD-FACS analysis demonstrated that the percentage of apoptotic cells is significantly lower in TCam-2-ΔGADD45B clones 16h after romidepsin treatment (1.75% more compared to solvent control) than in parental TCam-2 cells (6.4% more compared to solvent control (Figure 5E). Additionally, 16h after romidepsin treatment a PI FACS demonstrated that only 4.6% of TCam-2-ΔGADD45B cells enriched in G2/M-phase of the cell cycle (compared to solvent control), while 15.3% of the parental TCam-2 enriched in G2/M-phase (compared to solvent control) (Figure 5F). Thus, GADD45B seems to contribute to induction of apoptosis and enrichment in G2/M-phase of the cell cycle in response to romidepsin. Parts of these effects might be mediated by CDKN1A.
Deregulations in gene expression found in vitro are reflected in vivo
Finally we asked, if the results gathered in our in vitro experiments are also reflected in vivo. Thus, we xenografted 2102EP, NCCIT and JAR cells into the flank of nude mice and led tumors grow for two weeks. Afterwards, romidepsin (10 mg/kg) was injected intravenously and tumors were recovered after 8 and 24h. A qRT-PCR analysis demonstrates that the same genes were deregulated in expression as found in vitro (Figure 6A). In addition, histones H3 and H4 became hyperacetylated (Figure 6B). So, the effects caused by romidepsin are highly comparable in vitro and in vivo and conclusions drawn from our in vitro studies can reliably be transferred to the in vivo situation.
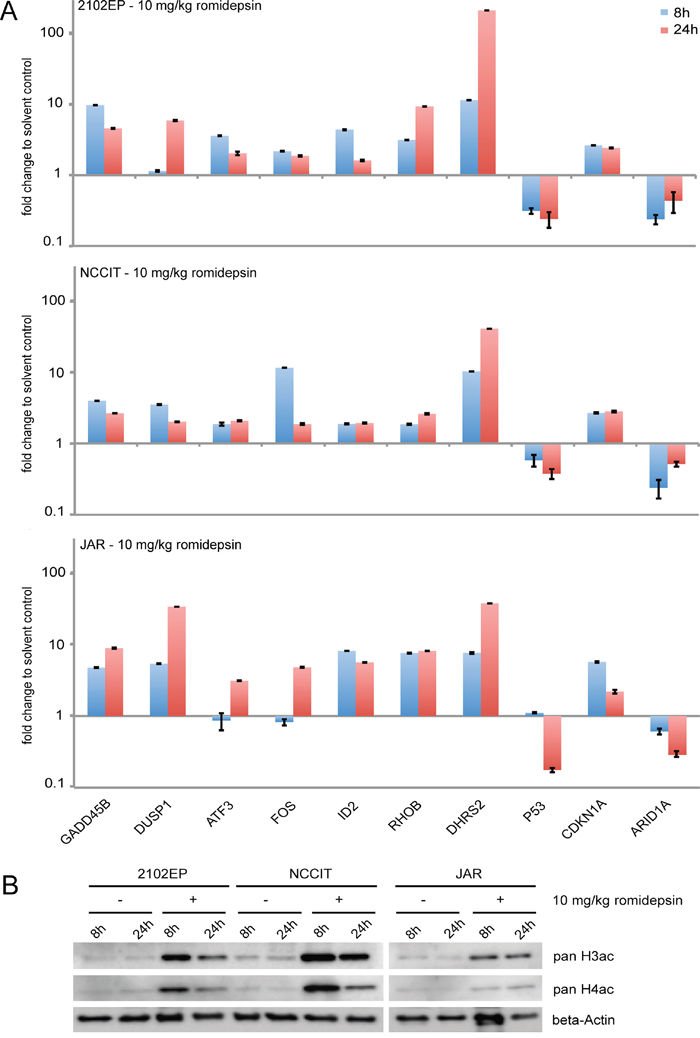
Figure 6: A. qRT-PCR analysis of 2102EP, NCCIT and JAR tumor tissues. Cells were xenografted for 2 weeks and then treated for 8 and 24h with 10 mg/kg romidepsin i. v. B. Western blot analysis of pan-H3ac / H4ac in 2102EP, NCCIT and JAR tumor tissues treated with 10 mg/kg romidepsin for 8 and 24h.
DISCUSSION
In this study, we demonstrated that romidepsin is highly toxic at low concentrations to GCC cells in vitro and in vivo. Romidepsin led to a disturbed chromatin landscape, resulting in hyper- and hypoacetylation of the histones. H3-hypoacetylation at the ARID1A promotor leads to downregulation of ARID1A expression, resulting in upregulation of the stress-sensors GADD45B and DUSP1.
Based on our results, we propose a model of the molecular mechanisms of romidepsin in GCC cells (Figure 7). Downregulation of ARID1A in response to romidepsin induces expression of stress-sensors and apoptosis as well cell cycle regulators (GADD45B, ATF3, FOS, ZFP36, DUSP1, ID2 and CDKN1A). We demonstrated that the stress-sensor GADD45B contributes to CDKN1A upregulation, induction of apoptosis and G2/M-phase enrichment. The immediate early gene and MAKP signaling inhibitor DUSP1 is induced in response to environmental stress and romidepsin [22] (this study). We hypothesize that in response to romidepsin DUSP1 mediated repression of the ERK1/2 signaling cascade leads to reduced phosphorylation of P90 ribosomal S6 kinase (RSK), which in consequence results in diminished pRPS6 levels [23]. Reduction of ERK1/2 signaling and pRBS5 levels are associated with growth arrest and apoptosis [23, 24]. These effects are summarized in our model and synergistically contribute to induction of stress, apoptosis and enrichment of romidepsin treated cells in the G2/M-phase of the cell cycle (Figure 7).
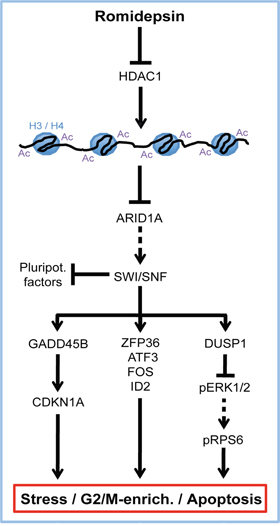
Figure 7: Model summarizing the molecular mode of action of romidepsin in GCCs. Arrow = ‘activation / induction’, T-shaped arrow = ‘inhibition / repression’, dashed arrows = ‘abolished interaction’, Ac = acetylation, H3 / H4 = histones 3 and 4.
Importantly, the molecular effects found in vitro, like upregulation of stress- and apoptosis-regulators, cleavage of PARP and hyperacetylation of histones H3 and H4 were also found in tumors from xenografted GCC cell lines. Thus, we postulate that we molecular mode of action is highly similar in vitro and in vivo.
Our study demonstrates that romidepsin seems to be an interesting treatment option, especially for metastasized and / or cisplatin-resistant GCCs.
MATERIALS AND METHODS
Cell culture
All GCC cell lines used in this study were cultivated as described previously [14]. 2102EP-R, NCCIT-R and NT2/D1-R were cultivated as their corresponding parental cell lines. MPAF, ARZ and EMF (provided by Dr. Michael Peitz (Life & Brain, Department of Reconstructive Neurobiology, Bonn)) as well as FS1 (provided by Valerie Schumacher, [15]) were grown in DMEM medium (10% FCS (20% FS1), 1% Penicillin / Streptomycin, 200 mM L-Glutamine, 1x non-essential amino acids, 100 nM ß-Mercaptoethanol) at 37°C and 5% CO2.
GCC and testis tissues
Seminoma (n = 4) and EC (n = 2) tissues as well as normal testis tissue were obtained from the Institute of Pathology (University Medical School, Bonn, Germany).
An internal review board allowed the use of these tissues in context of this study. Written permission to use the tissue for scientific purposes was obtained from the patients and was approved by the ‘ethics committee for clinical trials on humans and epidemiological research with patient-related data of the medical faculty of the Rheinischen- Friedrich-Wilhelms-University Bonn’. No personal patient data will be collected or stored in this study.
HDI application
Romidepsin was dissolved in dimethyl sulfoxide (DMSO; AppliChem GmbH, Darmstadt, Germany) and diluted in phosphate buffered saline (PBS) to a stock solution of 4.62 mM. Romidepsin was provided by Gloucester Pharmaceuticals (Celgene, Signal Pharmaceuticals, LLC, San Diego, CA, USA; MTA ID #CC0488464). SAHA and TSA (both from Sigma-Aldrich, Taufkirchen, Germany) were diluted in DMSO to 94.5 mM and 500 μM, respectively. VPA (Sigma-Aldrich) was diluted in H2O (dest.) to a 301 μM stock solution and cisplatin (Sigma-Aldrich) was diluted in dimethylformamide (DMF; Merck, Darmstadt, Germany) to 41.65 mM.
RNA and protein isolation
Total RNA and proteins were isolated as described previously [14]. Briefly, RNA was isolated by the RNAeasy mini kit (Qiagen, Hilden, Germany) and proteins by RIPA buffer.
Western blot
Western blots were performed as described previously [14]. Beta-ACTIN was used as housekeeper and loading control. See Table 1 for antibody details.
Table 1: Antibodies used in this study
Antibody |
Company |
Clone / Order No. |
Western Blot |
|---|---|---|---|
ARID1A |
Cell signaling |
D2A8U / 12354 |
1:500 |
Beta-Actin |
Sigma-Aldrich |
AC-15 |
1:20000 |
CDKN1A |
Santa Cruz |
C-19 / sc-397 |
1:500 |
cleaved PARP |
Abcam |
ab4830 |
1:500 |
GADD45B |
Sigma-Aldrich |
AV48346 |
1:1000 |
H3 pan-acetylation |
Active motif |
39139 |
1:500 |
H4 pan-acetylation |
Active motif |
39243 |
1:750 |
ID2 |
Cell signaling |
D39E8 / 3431 |
1:500 |
phospho-ERK1/2 |
Cell signaling |
197G2 / 4377 |
1:1000 |
total-ERK1/2 |
Cell signaling |
9102 |
1:5000 |
Quantitative RT-PCR
Quantitative RT-PCR (qRT-PCR) was performed as published previously [14]. 500 ng of total RNA was used for first strand synthesis (FSS). GAPDH was used as housekeeping gene and for data normalization. See Table 2 for primer sequences.
Table 2: Oligonucleotides used in this study
Gene |
Forward primer |
Reverse primer |
Tan |
Cycles |
|---|---|---|---|---|
APAF1 |
ACAATGCTCTACTACATGAA GGATATAAAGA |
CACTGGAAGAAGAGACAACAGGAA |
60°C |
40 |
ARID1A |
TCTTGCCCATCTGATCCATT |
CCAACAAAGGAGCCACCAC |
60°C |
40 |
ATF3 |
AAGAACGAGAAGCAGCATTTGAT |
TTCTGAGCCCGGACAATACAC |
60°C |
40 |
CDKN1A |
CCTCATCCCGTGTTCTCCTTT |
GTACCACCCAGCGGACAAGT |
60°C |
40 |
DHRS2 |
CTCCATGTAGGGCAGCAACT |
GTAGGGAGCACTCTGGGGAC |
60°C |
40 |
DUSP1 |
GTACATCAAGTCCATCTGAC |
GGTTCTTCTAGGAGTAGACA |
60°C |
40 |
FAS / APO-1 |
AGCTTGGTCTAGAGTGAAAA |
GAGGCAGAATCATGAGATAT |
60°C |
40 |
FOS |
GAGAGCTGGTAGTTAGTAGCATGTTGA |
AATTCCAATAATGAACCCAATA GATTAGTTA |
60°C |
40 |
GADD45B |
GTCGGCCAAGTTGATGAAT |
CACGATGTTGATGTCGTTGT |
60°C |
40 |
GADD45B genotyp. |
CCCGTCACTGATCCCTCTTT |
CTACTGCGAAGAAAGCCGG |
55°C |
35 |
GAPDH |
TGCCAAATATGATGACATCAAGAA |
GGAGTGGGTGTCGCTGTTG |
60°C |
40 |
HDAC1 |
TAAATTCTTGCGCTCCATCC |
AACAGGCCATCGAATACTGG |
60°C |
40 |
HDAC2 |
CGTGTAATGACGGTATCATTCC |
ACCAGATAATGAGTCTGCACC |
60°C |
40 |
HDAC3 |
CTGTGTAACGCGAGCAGAAC |
GCAAGGCTTCACCAAGAGTC |
60°C |
40 |
ID2 |
TCAGCCTGCATCACCAGAGA |
CTGCAAGGACAGGATGCTGATA |
60°C |
40 |
P53 |
TTGCAATAGGTGTGCGTCAGA |
AGTGCAGGCCAACTTGTTCAG |
60°C |
40 |
RHOB |
GGGACAGAAGTGCTTCACCT |
CGACGTCATTCTCATGTGCT |
60°C |
40 |
SMARCA4 |
CAGCATGCCAAGGATTTCAAG |
CGATCCGCTCGTTCTCTTTC |
60°C |
40 |
SMARCB1 |
AACGTCAGCGGGTTCAAAT |
GCCTTCACCTGGAACATGAA |
60°C |
40 |
ZMYND11 |
TTGTTAAACGTGCCATGACC |
GCATGTGTGGAGACAGAGGA |
60°C |
40 |
Gene |
shRNA sequence |
|||
ARID1A sh1 |
5’-TCGCCTCTATGTGTCTGTGAAGGAGATTG-3’ |
|||
ARID1A sh2 |
5’-GCAAACTCAGCATCCAGGACAACAATGTG-3’ |
|||
ARID1A sh3 |
5’-CCTTGCTGTCTCAGCAGCCAATCAACTTA-3’ |
|||
ARID1A sh4 |
5’-CCATTTGTGGTGGACTGCTCAGATAACGT-3’ |
|||
Gene |
gRNA sequence |
|||
GADD45B gRNA 1 |
5’-CACAGTGGGGGTGTACGAGT-3’ |
|||
GADD45B gRNA 2 |
5’-ACAACGACATCAACATCGTG-3’ |
|||
GADD45B gRNA 3 |
5’-CTCTTCCAGGCGTCCGTGTG-3’ |
|||
siRNA and cDNA transfection
Transfection of TCam-2 cells with siRNA or a cDNA-coding plasmid was performed as described previously [9]. Briefly, 1x10⁵ cells were seeded onto 6-well plates 24h before transfection. For transfection, FuGeneHD (Promega, Mannheim, Germany) was used at a ratio of 5: 1 (e.g. 5 μl FuGeneHD: 1 μg siRNA). ARID1A siRNAs were obtained from Santa Cruz Biotechnology as a pool of three different siRNAs (Santa Cruz, Heidelberg, Germany). Scrambled siRNA was used as negative control and for data normalization (AllStars Negative Control siRNA; Qiagen). siRNA experiments were performed in biological triplicates (n = 3). The GADD45B cDNA-coding plasmid was obtained from Origene (via Biocat, Heidelberg, Germany). The empty vector was used as negative control and for data normalization.
shRNA transduction
For retroviral transduction of TCam-2 cells, four different ARID1A shRNAs encoded in the pGFP-V-RS vector were utilized (Origene, via BioCat, Heidelberg, Germany). The empty vector was used as negative control and for data normalization. See Table 2 for the sequences of the oligonucleotides used for generation of the ARID1A targeting shRNA-expressing plasmids. Retroviral particles were produced in 1.2x10⁶ HEK293 cells by transfecting 2 μg of the retroviral shRNA, 2 μg pCMV-gag-pol-plasmid and 220 ng pCMV-VSV-G-plasmid via the calcium phosphate method. The next day, medium was replaced by fresh medium. On day 3, the supernatant was harvested, sterile filtered and applied to the target cells. ARID1A shRNA expressing cells were selected by adding 0.5 mg/ml puromycin every second day for one week.
Establishment of GADD45B-deficient TCam-2 cells by CRISPR/Cas9 gene-editing
Five different TCam-2-ΔGADD45B clones were generated as described previously [25]. Briefly, by using FuGeneHD (Promega) 1x10⁵ TCam-2 cells were transfected simultaneously with the pX330 vector encoding for three different guide RNAs (gRNA) directed against the GADD45B locus (Santa Cruz) and a GFP-coding plasmid. See Table 2 for gRNA sequences. Two days after the transfection, GFP-positive clones were manually picked and clonally expanded. Deletions within the coding sequence of GADD45B in each clone were detected by PCR (Supplementary Figure S5D). See Table 2 for primers used for genotyping.
Measurement of HDAC activity
To measure the activity of HDACs we utilized the Epigentek ‘EpiQuik HDAC Activity / Inhibition Assay Kit’ (Epigentek, via Biocat). The procedure was performed as recommended in the manual. Whole protein lysates were prepared by NP-40 isolation buffer (150 mM sodium chloride, 1% NP-40, 50 mM Tris (pH 8)). 10 μg of protein was used for analysis.
XTT assay
For the XTT-assay (2,3-bis-(2-methoxy-4-nitro-5-sulfophenyl)-2H-tetrazolium-5-carboxanilide), 24h before starting the experiment 5000 cells (8 x) were seeded in 100 μl standard growth medium without phenol red per well of a 96-well plate. The next day, different concentrations of HDIs or corresponding solvents were added to the cells. At the desired time points, 50 μl XTT (1 mg/ml) plus 1 μl PMS (1.25 mM) (both from Sigma-Aldrich) were added and absorbance was measured 4 h later in an ELISA reader (450 nm vs. 650 nm). Each time point / concentration was measured in four technical replicates.
FACS-based propidium iodide and AnnexinV / 7AAD measurement
For propidium iodide (PI) FACS cell cycle analysis, 5x10⁵ cells were washed once in PBS, centrifuged for 5 min at 1000 rpm and fixed by re-suspending in 300 μl PBS + 700 μl ice cold 100% ethanol. After 1 - 2h of fixation at -20°C, cells were pelleted by centrifugation (5 min, 1000 rpm) and re-suspended in 1 ml DNA staining solution (PBS + 2 μl PI (1 mg/ml), + 20 μl RNAseA (10 mg/ml)). After 15 min of incubation at RT under constant agitation samples were analyzed by FACS. First, the single cell population was identififed in a forward versus side scatter plot. Duplets or clumbs and cell debris was excluded from analyses. Next, cell cycle distribution was detected by a forward scatter versus PI plot and illustrated as a histogram by plotting PI versus cell. For apoptosis measurement, the ‘AnnexinV Apoptosis Detection Kit I’ was used (BD Biosciences, Heidelberg, Germany). Early and late apoptotic as well as viable cell populations were identified by plotting PE AnnexinV versus 7-AAD. Analysis was performed according to the manual. For each measurement, three independent samples were pooled. For PI and AnnexinV FACS, in total 50000 cells were measured using the FACSCanto machine and analyzed by the FACSDiva Software (BD Biosciences).
Illumina HT-12v4 expression microarray
The Illumina expression microarray analyses were performed exactly as published [14]. Briefly, RNA quality was checked in a BioAnalyzer 2100 (RNA 6000 nano lab chip) (Agilent Technologies, Waldbronn, Germany). Samples were processed on Illuminas human’ HT-12v4’ chips (San Diego, California, USA). Technical quality parameters such as hybridization, extension and specificity were evaluated using the ‘Genome Studio’ software. Expression values were quantile normalized using the ‘limma’-software-package (‘Linear Models for Microarray Data’, www.bioconductor.org). The microarray data set is publically available via GEO (ncbi.nlm.nih.gov/geo/) (GSE71239).
Affymetrix expression microarray analysis of GCC tissues
The whole procedure and the microarray data have already been published [12]. The microarray data were re-analyzed in context of this study and includes normal testis tissue (n = 4), GCNIS (n = 3), seminomas (N = 4), ECs (n = 3), teratomas (n = 3) and mixed non seminomas (n = 4). All tumors were classified according to the WHO classification of tumors based on their histology and assessment of tumor or GCNIS amount.
Chromatin-immunoprecipitation-followed-by-sequencing
For chromatin-immunoprecipitation-followed-by-sequencing (ChIP-seq) analysis, cells of interest were fixed by Formaldehyde solution (11% Formaldehyde, 0.1 M NaCl, 1 mM EDTA (pH 8), 50 mM HEPES (pH 7.9)) and further processed by Active Motif (Carlsbad, CA, USA), involving shearing of DNA by sonication, chromatin-immunoprecipitation, library generation and sequencing (NextSeq500, Illumina). Pooled input DNA of each sample including spike-in Drosophila DNA were used as controls and for normalization. The 75-nt sequence reads were mapped against the genome using BWA algorithm. Duplicate reads were removed. Only peaks that align with no more than 2 mismatches and map uniquely to the genome were used for further analysis. Intervals / peaks were identified by the MACS peak finding algorithm (cutoff p-value 1x10⁻⁷) including ENCODE blacklist filtering [26]. ChIP-seq data was visualized using the ‘UCSC Genome Browser’ (www.genome-euro.ucsc.edu). ChIP-seq data sets are publically available via GEO (GSE78262).
Xenotransplantation of TCam-2 and 2102EP cells
Xenotransplantation was performed as described in a previous publication [14]. 1x10⁷ TCam-2 and 2102EP cells were re-suspended in 4°C cold 500 μl Matrigel (BD Biosciences) and injected into the right flank of nude mice using a pre-cooled 28G syringe (BD Biosiences). At the day of romidepsin application, the mice were weighted allowing for accurate calculation of the correct dosages. A romidepsin solution of desired concentration was prepared freshly. Nude mice were pre-warmed on a 37°C warm plate allowing for a more easy injection procedure due to enlarging of blood vessels. Afterwards, mice were fixed in a fixator and 100 μl of the romidepsin solution were injected intravenously into the vein of nude mice using a 28G syringe (BD Biosciences). For each experimental condition, three mice were analyzed. Animal experiments were conducted according to the German law of animal protection and in agreement with the approval of the local institutional animal care committees (Landesamt für Natur, Umwelt und Verbraucherschutz NRW (approval ID: AZ84-02.04.2013.A430)). The experiments were performed in accordance with the ‘International Guiding Principles for Biomedical Research Involving Animals’ as announced by the ‘Society for the Study of Reproduction’.
STRING analysis
STRING protein-interaction predictions were performed online using default settings (www.string-db.org) [27].
ACKNOWLEDGMENTS
We kindly thank Blanca Randel, Yvonne Schleehuber, Angela Egert, Gaby Beine, and Martin Fellermeyer for technical assistance. Furthermore, we would like to thank Dr. Michael Peitz (Life & Brain, University Bonn Medical School, Bonn, Germany) for providing MPAF / ARZ / EMF cells and Dr. Andrea Hofmann as well as Dr. Per Hoffmann (Institute of Human Genetics, University Bonn Medical School, Bonn, Germany) for performing the Illumina expression microarrays.
CONFLICTS OF INTEREST
The authors declare no conflicts of interest!
FUNDING
This study was supported by BONFOR and the DFG to DN (O-155.0065; NE 1861/3-1).
REFERENCES
1. Skakkebaek NE. Possible carcinoma-in-situ of the testis. Lancet. 1972; 2:516–7.
2. Oosterhuis JW, Looijenga LHJ. Testicular germ-cell tumours in a broader perspective. Nat Rev Cancer. 2005; 5:210–22.
3. Berney DM, Looijenga L, Idrees M, Oosterhuis JW, Rajpert-De Meyts E, Ulbright TM, Skakkebaek NE. Germ Cell Neoplasia In Situ(GCNIS). Evolution of the Current Nomenclature for Testicular Pre-invasive Germ Cell Malignancy. Histopathology. 2016; :n/a–n/a.
4. Sonne SB, Almstrup K, Dalgaard M, Juncker AS, Edsgard D, Ruban L, Harrison NJ, Schwager C, Abdollahi A, Huber PE, Brunak S, Gjerdrum LM, Moore HD, et al. Analysis of Gene Expression Profiles of Microdissected Cell Populations Indicates that Testicular Carcinoma In situ Is an Arrested Gonocyte. Cancer Research. 2009; 69:5241–50.
5. Adami HO, Bergstrom R, Mohner M, Zatonski W, Storm H, Ekbom A, Tretli S, Teppo L, Ziegler H, Rahu M, et al. Testicular cancer in nine northern European countries. Int J Cancer. 1994; 59:33–8.
6. Hersmus R, de Leeuw BHCGM, Wolffenbuttel KP, Drop SLS, Oosterhuis JW, Cools M, Looijenga LHJ. New insights into type II germ cell tumor pathogenesis based on studies of patients with various forms of disorders of sex development (DSD). MOLECULAR AND CELLULAR ENDOCRINOLOGY. 2008; 291:1–10.
7. Cools M, Wolffenbuttel KP, Drop SLS, Oosterhuis JW, Looijenga LHJ. Gonadal development and tumor formation at the crossroads of male and female sex determination. Sexual development: genetics, molecular biology, evolution, endocrinology, embryology, and pathology of sex determination and differentiation. 2011; 5:167–80.
8. Koster R, di Pietro A, Timmer-Bosscha H, Gibcus JH, van den Berg A, Suurmeijer AJ, Bischoff R, Gietema JA, de Jong S. Cytoplasmic p21 expression levels determine cisplatin resistance in human testicular cancer. J Clin Invest. 2010; 120:3594–605.
9. Nettersheim D, Gillis A, Biermann K, Looijenga LHJ, Schorle H. The seminoma cell line TCam-2 is sensitive to HDAC inhibitor depsipeptide but tolerates various other chemotherapeutic drugs and loss of NANOG expression. Genes Chromosom Cancer. Wiley Subscription Services, Inc., A Wiley Company; 2011; 50:1033–42.
10. Andrews PW, Damjanov I, Simon D, Banting GS, Carlin C, Dracopoli NC, Føgh J. Pluripotent embryonal carcinoma clones derived from the human teratocarcinoma cell line Tera-2. Differentiation in vivo and in vitro. Lab Invest. 1984; 50:147–62.
11. Andrews PW, Fenderson B, Hakomori S. Human embryonal carcinoma cells and their differentiation in culture. International Journal of Andrology. 1987; 10:95–104.
12. Eckert D, Nettersheim D, Heukamp LC, Kitazawa S, Biermann K, Schorle H. TCam-2 but not JKT-1 cells resemble seminoma in cell culture. Cell and Tissue Research. Springer-Verlag; 2008; 331:529–38.
13. Port M, Glaesener S, Ruf C, Riecke A, Bokemeyer C, Meineke V, Honecker F, Abend M. Micro-RNA expression in cisplatin resistant germ cell tumor cell lines. Mol Cancer. BioMed Central Ltd; 2011; 10:52.
14. Nettersheim D, Jostes S, Sharma R, Schneider S, Hofmann A, Ferreira HJ, Hoffmann P, Kristiansen G, Esteller MB, Schorle H. BMP Inhibition in Seminomas Initiates Acquisition of Pluripotency via NODAL Signaling Resulting in Reprogramming to an Embryonal Carcinoma. PLoS Genet. 2015; 11:e1005415.
15. Schumacher V, Gueler B, Looijenga LHJ, Becker JU, Amann K, Engers R, Dotsch J, Stoop H, Schulz W, Royer-Pokora B. Characteristics of testicular dysgenesis syndrome and decreased expression of SRY and SOX9 in Frasier syndrome. Mol Reprod Dev. 2008; 75:1484–94.
16. Sandor V, Senderowicz A, Mertins S, Sackett D, Sausville E, Blagosklonny MV, Bates SE. P21-dependent g(1)arrest with downregulation of cyclin D1 and upregulation of cyclin E by the histone deacetylase inhibitor FR901228. British Journal of Cancer. 2000; 83:817–25.
17. Cayrol C, Knibiehler M, Ducommun B. p21 binding to PCNA causes G1 and G2 cell cycle arrest in p53-deficient cells. Oncogene. 1998; 16:311–20.
18. Reisman D, Glaros S, Thompson EA. The SWI/SNF complex and cancer. Oncogene. 2009; 28:1653–68.
19. Gao X, Tate P, Hu P, Tjian R, Skarnes WC, Wang Z. ES cell pluripotency and germ-layer formation require the SWI/SNF chromatin remodeling component BAF250a. Proc Natl Acad Sci U S A. 2008; 105:6656–61.
20. Keenen B, la Serna de IL. Chromatin remodeling in Embryonic stem cells: Regulating the balance between pluripotency and differentiation. J Cell Physiol. 2009; 219:1–7.
21. Liebermann DA, Hoffman B. Gadd45 in stress signaling. JMS. 2014; 3:15–8.
22. Liu C, Shi Y, Du Y, Ning X, Liu N, Huang D, Liang J, Xue Y, Fan D. Dual-specificity phosphatase DUSP1 protects overactivation of hypoxia-inducible factor 1 through inactivating ERK MAPK. Experimental Cell Research. 2005; 309:410–8.
23. Lu Z, Xu S. ERK1/2 MAP kinases in cell survival and apoptosis. IUBMB Life (International Union of Biochemistry and Molecular Biology: Life). 2006; 58:621–31.
24. Chen B, Zhang W, Gao J, Chen H, Jiang L, Liu D, Cao Y, Zhao S, Qiu Z, Zeng J, Zhang S, Li W. Downregulation of ribosomal protein S6 inhibits the growth of non-small cell lung cancer by inducing cell cycle arrest, rather than apoptosis. Cancer Letters. 2014; 354:378–89.
25. Nettersheim D, Heimsoeth A, Jostes S, Schneider S, Fellermeyer M, Hofmann A, Schorle H. SOX2 is essential for in vivo reprogramming of seminoma-like TCam-2 cells to an embryonal carcinoma-like fate. Oncotarget. 2016; 7:47095–47110. doi: 10.18632/oncotarget.9903.
26. Zhang Y, Liu T, Meyer CA, Eeckhoute J, Johnson DS, Bernstein BE, Nusbaum C, Myers RM, Brown M, Li W, Liu XS. Model-based analysis of ChIP-Seq (MACS). Genome Biol. 2008; 9:R137.
27. Szklarczyk D, Franceschini A, Wyder S, Forslund K, Heller D, Huerta-Cepas J, Simonovic M, Roth A, Santos A, Tsafou KP, Kuhn M, Bork P, Jensen LJ, et al. STRING v10: protein-protein interaction networks, integrated over the tree of life. Nucleic Acids Research. 2015; 43:D447–52.