
INTRODUCTION
Although the past years have witnessed an improvement in the understanding of early molecular events in malignant primary CNS tumors, and a plethora of new therapies targeting these events are now tested in clinical trials, effective treatments for most primary malignant CNS tumors are still lacking [1]. Among high-grade gliomas, glioblastoma (GBM; World Health Organization grade IV astrocytoma) [2] is the most aggressive primary tumor in adults with dismal prognosis. Its treatment is palliative and includes surgery, radiotherapy, and concomitant chemotherapy [3].
Tumor heterogeneity depicts the leading feature supporting tumor robustness and represents the main obstacle to overcome to develop therapeutic strategies. It is then essential to establish successful assays enabling phenotypic, (epi)genetic and functional identification and characterization of tumor subpopulations driving the tumorigenesis and delineating clinically relevant targets.
Many cancers (i.e. leukemia, breast, colon, brain, prostate, melanoma) depend for their continued growth and propagation on a population of cells called cancer stem-cells (CSCs) or tumor-initiating cells (TICs): these cells are slow-dividing, endowed with unlimited proliferation capacity, functionally defined by their tumorigenic capability when engrafted in mice, unresponsive to standard treatments, thus highly competent in repopulating the tumor [4–11].
TICs appear to be relatively rare in most human cancers, ranging from 0,0001% to 0,1% of the bulk tumor cell population [5], [6], [12–15]. However, recent studies report that TICs are frequent, indicating frequencies ranging from 25% to 40% [8, 16–18].
Of note, different aspects may influence TIC estimate: in vitro cell manipulation before transplantation, the use of agents (i.e. matrigel) sustaining tumor cell transplantation, the extent of the immunodeficiency of the recipient host, the duration of the experimental period for tumor formation following tumor cell injection and the experimental procedure implemented for TIC isolation. With this regard, although the exact contribution of each cell-surface marker in identifying the TICs is puzzling and unclear, current protocols are still based on the expression of putative stem-cell markers that could distinguish a small subpopulation of cells with tumorigenic potential from the majority of non-tumorigenic cells. In addition, the gold standard to determine TIC frequency within a tumor is the limiting dilution cell transplantation assay (LDA) [19]. Nevertheless, despite several studies regarding TIC frequencies, only rarely tumoral cells are transplanted in limiting dilution experiments.
The variability in TIC frequencies assessment challenges the prognostic role of TICs in predicting the clinical outcome in cancer patients. Thus far, the prognostic value of TICs has been linked in several types of tumors to the presence of stem-related features, such as the expression of stem-cell markers, genetic features, and tumorsphere formation [20–22]. Similar evidences have been reported also in GBM, where stem-cell marker expression (i.e. CD133, nestin) [23, 24] and neurosphere formation [25] have been associated to clinical outcomes. However, data from different groups are controversial, since GBM stem-cell marker expression is not always associated to a prognostic significance [26].
Here, we specifically estimate GBM TIC frequency employing limiting dilution transplantation of cells isolated from freshly-dissociated human GBMs. We believe that, owing the lack of definitive markers, only functional criteria applied on freshly-dissociated human GBMs will allow an unbiased assessment of the TIC content within parental GBMs. Furthermore, through in vitro neurosphere assay we look for the existence of any correlation between the sphere-forming capability and the in vivo tumorigenic potential of cells from the same human sample. Moreover, we investigate the effect of in vitro culturing primary GBM cells as neurospheres on their TIC content.
RESULTS
TICs from freshly-dissociated GBMs are rare
Immediately after surgical removal, GBM specimens (n=28) were enzymatically and mechanically dissociated and viable cells immediately injected in the mouse brain without any in vitro manipulation to evaluate the ability to generate tumors. In parallel, cells were also plated in non-adherent serum free stem-cell medium to allow neurosphere formation. The 86% of the specimens analysed (n=24) was tumorigenic in vivo (Table 1), giving rise to tumors phenotypically similar to the parental ones (Figure 1A). Of these, the 54% (n=13) were able to give rise to spheres in vitro while the remaining 46% (n=11) did not (Table 1 and Figure 1B). Interestingly, xenografted cells from GBMs with uncoupled sphere-forming capacity and tumorigenic ability, once isolated always formed GBM in secondary xenotransplantation albeit still failed to generate neurospheres in vitro (data not shown). Thus, the inability to grow in culture cannot predict in vivo tumorigenicity.
Table 1: Clinical and experimental data of collected GBM patients
Clinical Data |
MRI |
Therapy |
Experimental Data |
|||||||||||
|---|---|---|---|---|---|---|---|---|---|---|---|---|---|---|
Patient ID |
Age |
Sex |
Initial KPS |
PFS |
OS |
FU |
Status |
Tumor size |
C/L inv |
Invas |
Rad Surg |
CCRT |
Neurospheres formation |
Tumor formation in vivo |
GBM#76 |
55 |
M |
60 |
2 |
2 |
30 |
D |
82×43 mm |
N |
1 |
N |
N |
N |
N |
GBM#79 |
78 |
M |
50 |
nd |
nd |
30 |
nd |
40×50 mm |
N |
2 |
Y |
nd |
N |
Y |
GBM#89 |
71 |
M |
70 |
5 |
12 |
26 |
D |
34×23 mm |
N |
3 |
N |
Y |
N |
N |
GBM#92 |
66 |
F |
90 |
20 |
20 |
20 |
A |
23×21 mm |
N |
3 |
N |
Y |
Y |
Y |
GBM#93 |
59 |
F |
70 |
nd |
nd |
20 |
nd |
34×34 mm |
N |
1 |
Y |
nd |
Y |
Y |
GBM#94 |
51 |
F |
90 |
4 |
17 |
20 |
D |
54×40 mm |
N |
1 |
Y |
Y |
N |
Y |
GBM#98 |
52 |
M |
90 |
17 |
20 |
20 |
A |
25×13 mm |
N |
3 |
Y |
N |
Y |
Y |
GBM#99 |
65 |
M |
80 |
nd |
nd |
19 |
nd |
81×50 mm |
Y |
2 |
N |
nd |
N |
Y |
GBM#101 |
52 |
F |
70 |
5 |
13 |
19 |
D |
51×25 mm |
N |
2 |
Y |
Y |
N |
Y |
GBM#103 |
63 |
F |
80 |
19 |
19 |
19 |
A |
50×32mm |
N |
2 |
Y |
Y |
N |
N |
GBM#106 |
48 |
M |
80 |
nd |
nd |
18 |
nd |
52×45 mm |
N |
3 |
Y |
nd |
N |
Y |
GBM#107 |
72 |
M |
60 |
nd |
3 |
18 |
D |
87×44 mm |
N |
1 |
N |
Y |
Y |
Y |
GBM#109 |
59 |
F |
90 |
nd |
nd |
17 |
nd |
50×43 mm |
N |
2 |
Y |
nd |
N |
Y |
GBM#110 |
53 |
M |
90 |
7 |
17 |
17 |
A |
30×36mm |
N |
2 |
N |
Y |
N |
Y |
GBM#115 |
57 |
F |
90 |
nd |
nd |
16 |
nd |
59×54 mm |
Y |
1 |
N |
nd |
Y |
Y |
GBM#116 |
51 |
M |
90 |
nd |
nd |
16 |
nd |
multicentric |
N |
multi centric |
N |
nd |
N |
Y |
GBM#119 |
80 |
M |
70 |
3 |
15 |
15 |
A |
39×37 mm |
N |
2 |
Y |
Y |
Y |
Y |
GBM#121 |
66 |
M |
80 |
15 |
15 |
15 |
A |
48×42 mm |
N |
3 |
Y |
N |
N |
N |
GBM#122 |
42 |
F |
90 |
3 |
15 |
15 |
A |
30×16 mm |
N |
1 |
Y |
Y |
Y |
Y |
GBM#124 |
56 |
F |
90 |
2 |
4 |
15 |
D |
multicentric |
N |
multi centric |
N |
Y |
Y |
Y |
GBM#125 |
62 |
M |
90 |
8 |
14 |
14 |
A |
62×31 mm |
N |
2 |
Y |
Y |
N |
Y |
GBM#128 |
56 |
M |
80 |
5 |
8 |
13 |
D |
62×42 mm |
Y |
1 |
Y |
Y |
Y |
Y |
GBM#130 |
40 |
M |
90 |
10 |
12 |
12 |
A |
41×23 mm |
N |
3 |
Y |
Y |
Y |
Y |
GBM#132 |
52 |
M |
90 |
11 |
11 |
11 |
A |
35 x31 mm |
N |
1 |
Y |
Y |
Y |
Y |
GBM#133 |
54 |
F |
90 |
6 |
11 |
11 |
A |
47×21 mm |
N |
1 |
Y |
Y |
Y |
Y |
GBM#138 |
54 |
F |
90 |
11 |
11 |
11 |
A |
41×34 mm |
N |
1 |
Y |
Y |
Y |
Y |
GBM#139 |
79 |
M |
80 |
3 |
6 |
11 |
D |
72×52 mm |
N |
3 |
Y |
N |
N |
Y |
GBM#142 |
42 |
M |
90 |
4 |
10 |
10 |
A |
39×37 mm |
N |
2 |
Y |
N |
N |
Y |
Surgical specimens together with clinical records were collected from 28 consenting patients after surgery. Pathologists classified tumors as primary GBM. Overall patients enrolled in the study were 60% men and 40% women, with a median age of 58 years (range, 40-80 years) and a mean Karnofsky performance score of 80 (range 50-90). KPS: Karnofsky performance status; PFS: progression free survival; OS: overall survival; FU: follow-up; Status: D= dead, A= alive; nd= data not available; C/L inv: contralateral invasion; Invas: invasiveness of the tumor mass where 1 = distance of invasion < 2 × diameter of tumor mass; 2 = 2 × diameter of tumor mass < distance of invasion < 3 × diameter of tumor mass; 3 = 3 × diameter of tumor mass < distance of invasion; Rad Surg: radical surgery (Y= patients that underwent radicl surgery; N= patients that did not undergo radical surgery); CCRT: concurrent chemoradiotherapy. In the “experimental data” section are reported the success (Y=Yes) or failure (N=No) of neurospheres formation and in vivo tumor development of each collected sample.

Figure 1: Dissociation between sphere-forming capacity and tumorigenic ability of freshly-dissociated hGBMs. A. IHC analysis of a representative human GBM and its correspondent xenograft. The upper part of the panel depicts H&E and Nestin antibody staining of human glioblastoma; in the lower part, H&E and Nestin antibody staining of its correspondent xenograft are shown. Human anti-nuclei (α–hNU) antibody staining of the xenograft demonstrates the human origin of the tumor. Scale bars = 5 μm (H&E and Nestin), 20 μm and 10 μm (hNu). B. The graph represents the in vitro sphere formation ability and the in vivo tumorigenicity capacity of freshly-dissociated hGBMs: the 86% (n=24) of the specimens analysed are tumorigenic in vivo and the 54% (n=13) of these are able to give rise to spheres when placed in cultured. The remaining 11 specimens (46%) present an uncoupled sphere-forming capacity and tumorigenic ability, since they do not succeed to generate in vitro neurospheres. C. Comparison of TIC frequencies in freshly-dissociated hGBMs of 12 matched samples calculated through in vitro methylcellulose assay (mean 0.00093; C.I. 0.00026÷0.00334 after reverse logarithmic transformation) and in vivo limiting dilution assay (mean 0.00007; C.I. 0.00002÷0.00022 after reverse logarithmic transformation). The in vitro TIC frequency results to be 10-fold higher than the in vivo frequency (Paired samples t-test: t=4.233; df=11; P=0.0014**). D. Representation of the absence of correlation between TIC frequencies assessed through in vivo and in vitro assays of the 12 matched samples illustrated in Figure 1C (Pearson correlation after logarithmic transformation with r=0.391; P=0.209ns; n=12). E. Comparison of TIC frequencies assessed in freshly dissociated hGBMs (mean 0.00012; C.I. 0.00004÷0.00033 after reverse logarithmic transformation; n=19) and in hGBM-NS (mean 0.00105; C.I. 0.00037÷0.00298 after reverse logarithmic transformation; n=10) through in vivo LDA: TIC content in hGBM-NS was remarkably higher (Unpaired Student t-test: t=2.935, df=27, P=0.0067**). All statistical tests are two-sided.
Considering LDA as the gold standard to quantify the TIC content, we stereotaxically injected serial concentrations of freshly-dissociated hGBM cells ranging from 105 to 10 cells [10]. LDA was carried to completion in 19 out of 24 GBMs (Table 1). We did not succeed in assessing the TIC frequency of four specimens (hGBM#92, hGBM#93, hGBM#94, hGBM#101, hGBM#107) due to the paucity of available cells. Tumor formation was monitored for nearly one year as a consequence of the long latency requested for tumor to arise at the lower cellular doses. TIC frequencies in freshly-dissociated hGBMs were highly variable between patients, ranging from 1/143 to 1/87599 (Table 2). On average, freshly-dissociated hGBMs contained rare TICs, as observed in other tumors [15]. Interestingly, also freshly-dissociated hGBMs unable to form neurospheres in vitro (n=9) comprised a rare, highly variable number of TICs (Table 1 and 2).
Table 2: TIC frequencies in freshly-dissociated hGBMs
Freshly-dissociated hGBMs |
Number of Transplanted Cells |
TIC Frequency−1 |
||||
|---|---|---|---|---|---|---|
(95% CI) |
||||||
105 |
104 |
103 |
102 |
Estimate |
||
hGBM#79 |
Incidence |
3/3 |
3/3 |
3/3 |
1/3 |
216 |
Median |
66±8 |
60±2 |
103±0 |
168±51 |
(49-962) |
|
hGBM#98 |
Incidence |
1/2 |
2/3 |
0/3 |
52571 |
|
Median |
334±0 |
319±0 |
377±0 |
(12418-222619) |
||
hGBM#99 |
Incidence |
2/2 |
1/3 |
3/3 |
6297 |
|
Median |
122±3 |
215±107 |
155±23 |
(1769-22420) |
||
hGBM#106 |
Incidence |
3/3 |
3/3 |
3/3 |
1/2 |
143 |
Median |
145±100 |
343±1 |
277±15 |
370±25 |
(22-918) |
|
hGBM#109 |
Incidence |
2/3 |
1/3 |
0/2 |
0/3 |
67816 |
Median |
106±0 |
108±4 |
289±123 |
195±71 |
(19039-241569) |
|
hGBM#110 |
Incidence |
1/3 |
2/3 |
0/2 |
0/3 |
87599 |
Median |
185±69 |
255±97 |
318±62 |
354±42 |
(23252-330030) |
|
hGBM#115 |
Incidence |
3/3 |
3/3 |
1/3 |
2164 |
|
Median |
179±5 |
192±10 |
195±10 |
(487-91614) |
||
hGBM#116 |
Incidence |
1/2 |
2/3 |
0/3 |
0/3 |
52680 |
Median |
314±13 |
301±48 |
221±0 |
356±0 |
(12466-222628) |
|
hGBM#119 |
Incidence |
3/3 |
3/3 |
3/3 |
0/3 |
417 |
Median |
179±12 |
167±6 |
203±10 |
324±21 |
(117-1494) |
|
hGBM#122 |
Incidence |
2/3 |
3/3 |
0/2 |
0/2 |
34826 |
Median |
59±5 |
59±11 |
212±158 |
227±137 |
(9539-127156) |
|
hGBM#124 |
Incidence |
2/3 |
2/3 |
2/4 |
28969 |
|
Median |
138±32 |
260±75 |
161±24 |
(7664-109506) |
||
hGBM#125 |
Incidence |
1/3 |
1/3 |
1/3 |
1/3 |
66380 |
Median |
164±15 |
288±68 |
270±6 |
310±28 |
(18769-234769) |
|
hGBM#128 |
Incidence |
2/3 |
0/3 |
1/3 |
2/3 |
38765 |
Median |
59±24 |
196±138 |
87±104 |
196±108 |
(10939-137374) |
|
hGBM#130 |
Incidence |
3/3 |
3/3 |
2/3 |
0/3 |
1072 |
Median |
188±10 |
175±20 |
201±15 |
295±29 |
(267-4312) |
|
hGBM#132 |
Incidence |
2/3 |
2/3 |
1/2 |
0/3 |
36019 |
Median |
73±2 |
90±2 |
112±0 |
158±52 |
(9951-130386) |
|
hGBM#133 |
Incidence |
3/3 |
3/3 |
0/3 |
0/3 |
4326 |
Median |
120±8 |
139±0 |
216±0 |
186±5 |
(1237-15139) |
|
hGBM#138 |
Incidence |
2/3 |
3/3 |
2/3 |
0/3 |
22741 |
Median |
110±0 |
117±13 |
147±22 |
120±59 |
(5519-93718) |
|
hGBM#139 |
Incidence |
3/3 |
3/3 |
0/3 |
0/3 |
4326 |
Median |
170±130 |
244±1 |
163±142 |
315±14 |
(1237-15139) |
|
hGBM#142 |
Incidence |
3/3 |
3/3 |
1/3 |
0/3 |
2340 |
Median |
290±5 |
268±15 |
223±62 |
234±0 |
(571-9604) |
|
The TIC frequency is calculated through limiting dilution transplantation of n=19 freshly-dissociated hGBMs. Data show the TIC frequency per transplanted cells (estimate, in bold) by means of the extreme limiting dilution analysis function assessed by ELDA algorithm (http://bioinf.wehi.edu.au/software/elda/). In the table, the tumor incidence and the survival time (in days; mean±SD) of tumor-bearing mice after injection of different concentrations of cells are also indicated.
In vitro culture overestimates TIC content
Next, we assessed TIC frequencies in vitro by culturing cells derived from the same freshly-dissociated hGBM directly into methylcellulose-containing medium, which is able to sustain the growth of cells endowed with stemness characteristics [11, 12]. On average, in vitro TIC frequency (mean=0.00093; C.I.=0.00026÷0.00334; n=12) was 10-fold higher than in vivo frequency (mean=0.00007; C.I.=0.00002÷0.00022; n=12) (Paired samples t-test: P=0.0014**) (Figure 1C). Furthermore, in vitro TIC amount is not portending the extent of in vivo TIC frequency (Pearson correlation with r=0.08156; P=0.8011ns; n=12) (Figure 1D).
We next asked whether TIC frequencies might be modified culturing primary hGBM cells in non-adherent serum free stem-cell medium. It has been demonstrated that TICs propagated as neurospheres closely mimic the genotype, gene expression profile, and biology of the parental GBM from which they derive [27]. Thus, we propagated cells from additional independent freshly-dissociated hGBMs as neurospheres (hGBM-NS), and performed LDA. hGBM-NS TIC content (mean=0.00105; C.I.=0.00037÷0.00298; n=10) was higher than TIC frequencies assessed in freshly-dissociated hGBMs (mean=0.00012; C.I.=0.00004÷0.00033; n=19) (Unpaired t-test: P=0.0067**) (Figure 1E), fluctuating from 1/100 to 1/6819 (Table 3).
Table 3: TIC frequencies in hGBM-NS
hGBM-NS |
Number of Transplanted Cells |
TIC Frequency−1 |
|||||
|---|---|---|---|---|---|---|---|
(95% CI) |
|||||||
105 |
104 |
103 |
102 |
10 |
Estimate |
||
hGBM#7 |
Incidence |
14/14 |
5/5 |
6/7 |
4/9 |
0/9 |
352 |
Median |
47±7 |
52±8 |
71±11 |
61±9 |
0±0 |
(158-786) |
|
hGBM#8 |
Incidence |
6/6 |
8/8 |
7/7 |
6/11 |
2/4 |
100 |
Median |
78±10 |
85±14 |
112±5 |
141±14 |
156±4 |
(47-206) |
|
hGBM#9 |
Incidence |
5/5 |
4/4 |
3/4 |
2/4 |
2/4 |
303 |
Median |
93±0 |
154±33 |
184±39 |
196±72 |
243±16 |
(96-955) |
|
hGBM#10 |
Incidence |
3/3 |
3/3 |
2/3 |
1/3 |
1/3 |
488 |
Median |
153±12 |
174±19 |
186±29 |
225±0 |
165±0 |
(141-1697) |
|
hGBM#18 |
Incidence |
4/4 |
6/6 |
5/6 |
4/6 |
3/7 |
201 |
Median |
90±48 |
80±21 |
88±15 |
112±8 |
114±9 |
(73-558) |
|
hGBM#20 |
Incidence |
1/2 |
2/2 |
1/2 |
1/2 |
2712 |
|
Median |
291±0 |
309±104 |
217±0 |
181±0 |
(514-14315) |
||
hGBM#25 |
Incidence |
2/2 |
3/4 |
3/4 |
1/4 |
0/4 |
2942 |
Median |
142±0 |
122±25 |
149±25 |
191±0 |
0±0 |
(929-9327) |
|
hGBM#27 |
Incidence |
2/4 |
1/3 |
1/5 |
1/5 |
6070 |
|
Median |
267±34 |
59±0 |
225±0 |
136±0 |
(2007-18370) |
||
hGBM#154 |
Incidence |
2/3 |
1/3 |
0/3 |
0/3 |
6819 |
|
Median |
191±1 |
162±0 |
0±0 |
0±0 |
(1921-24218) |
||
hGBM#155 |
Incidence |
3/3 |
1/3 |
1/3 |
0/3 |
1350 |
|
Median |
89±18 |
20±0 |
92±0 |
0±0 |
(318-5735) |
||
The TIC frequency is calculated through limiting dilution transplantation of n=10 hGBM-NS. Data show the TIC frequency per transplanted cells (estimate, in bold) by means of the extreme limiting dilution analysis function assessed by ELDA algorithm (http://bioinf.wehi.edu.au/software/elda/). In the table, the tumor incidence and the survival time (in days; mean±SD) of tumor-bearing mice after injection of different concentrations of cells are also indicated.
TIC number positively correlates with tumor incidence and inversely correlates with survival in mouse xenografts
By pooling together the in vivo experiments performed with either freshly-dissociated hGBMs and hGBM-NS, we analysed the relationship between the total number of cells intracerebrally injected in immunocompromised mice and tumor incidence. In both conditions, we observed an increment of tumor incidence increasing the number of injected cells: at the maximum cell concentration (105 cells), 100% of incidence was measured only with hGBM-NS (Figure 2A), in comparison to near 80% of incidence with freshly-dissociated hGBMs (Figure 2B) (comparison of tumor incidence reported in Figure 2A and 2B: G2 Wilks test where G2=35.14; df=4; P<0.0001**). The difference may be due to the smaller proportion of TICs within the freshly-dissociated hGBMs compared to hGBM-NS (Figure 1E). We thus proceeded analysing the relationship between the number of inferred TICs of each specimen and the corresponding tumor incidence. Interestingly, we obtained mirrored result in both hGBM-NS and freshly-dissociated hGBMs: up to 10 injected TICs, the incidence of the tumors increased with the number of injected TICs, while the injection of more than 10 TICs resulted in 100% of tumor incidence (comparison Figure 2C and 2D: G2 Wilks test where G2=0.58; df=4; P=0.97ns). Thus, TICs contained in freshly-dissociated hGBMs and hGBM-NS and extrapolated through in vivo LDA have the same tumorigenic potential.
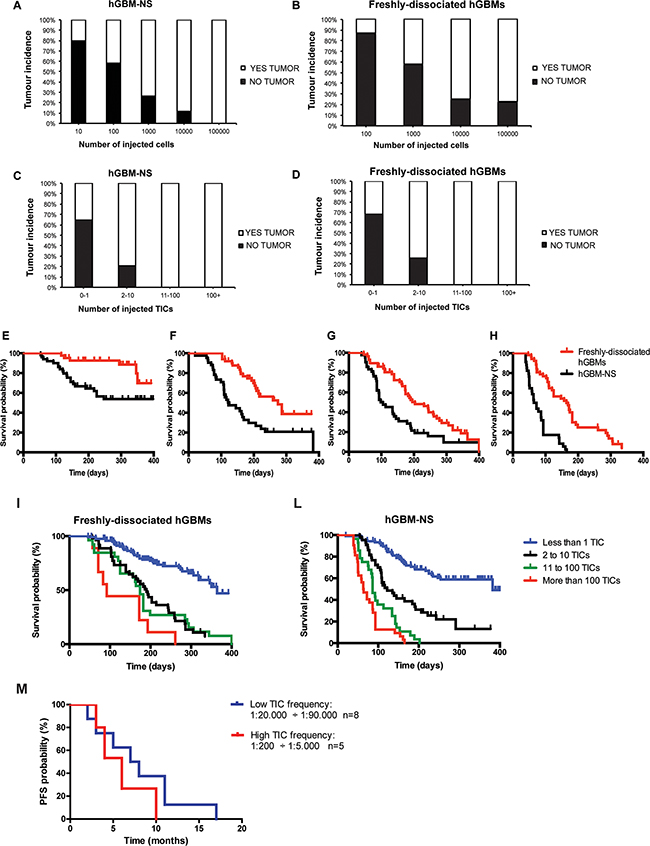
Figure 2: Tumor incidences and survival of mice intracerebrally injected with freshly-dissociated hGBM cells and cells from hGBM-NS. The graphs depict the percentage of mice that developed tumours after orthotopic injection of 10, 100, 1000, 10000, 100000 cells from hGBM-NS cultures A. and freshly-dissociated hGBM cells B. In both conditions, we observe an increment of tumor incidence increasing the number of injected cells: at the maximum cell concentration, only the mice transplanted with cells from hGBM-NS achieve incidence of 100%. (Comparison A-B: G2 Wilks test where G2 =35.14; df=4; P<0.0001**). C and D. Correlation between tumor incidence and number of inferred TICs from hGBM-NS (C) and from freshly-dissociated hGBMs (D) The analysis reveals that tumor incidence is 100% both in hGBM-NS and in freshly-dissociated hGBMs where at least 11 TICs were injected (Comparison C-D: G2 Wilks test where G2 =0.58; df=4; P=0.97ns). E. and H. Kaplan–Meier analysis comparing mice injected with freshly-dissociated hGBM cells and cells from hGBM-NS cultures for (E) 100 cells (P=0.0027** by Log-rank test), (F) 1000 cells (P=0.0002** by Log-rank test), (G) 10000 cells (P=0.0022** by Log-rank test), and (H) 100000 cells (P<0.0001** by Log-rank test). I. and L. Kaplan–Meier analysis based on the number of TICs injected using freshly-dissociated hGBM cells (P<0.0001** by Log-rank test; n=9 to 120) (I) and cells from hGBM-NS cultures (P<0,0001** by Log-rank test; n=28 to 105) (L) shows a statistically significant advantage on survival when few TICs are injected. M. Kaplan-Meier analysis for progression free survival of a cohort of 13 GBM patients in relation to high TIC frequency (1:200-1:5000; n=5) and low TIC frequency (1:20000-1:90000; n=8). GBM patients with low TIC frequency experiences a longer, although not statistically significant, progression-free survival (median 7.5 months vs 6 months, P=0.33ns by Log-rank test). Difference between groups is evaluated by means of the Log-rank test.
Next, we compared the Kaplan-Meier plots obtained through the injection of the same amount of cells (102, 103, 104, 105 cells) derived from hGBM-NS and freshly-dissociated hGBMs. The survival curve of hGBM-NS was significantly shorter (Figures 2E and 2H), given the higher TIC frequency of hGBM-NS (1:2136) compared to that of freshly-dissociated tumors (1:26825) (for 102 cells injected n=45+ per group, median survival undefined, P=0.0027** by Log-rank test; for 103 cells injected n=43+ per group, median hGBM-NS survival=122 days and freshly-dissociated hGBMs survival=274 days, P=0.0002** by Log-rank test; for 104 cells injected n=2+ per group, median hGBM-NS survival=101.5 days and freshly-dissociated hGBMs survival=203 days, P=0.0022** by Log-rank test; for 105 cells injected n=34+ per group, median hGBM-NS survival=68 days and freshly-dissociated hGBMs survival=164 days, P<0.0001** by Log-rank test). Notably, when either freshly-dissociated hGBMs (Figure 2I) and hGBM-NS (Figure 2L) were stratified according to their TIC content, fewer was the amount of intracerebrally engrafted TICs, greater was mice survival (freshly-dissociated hGBMs: n=9 to 120, P<0.0001** by Log-rank test; hGBM-NS: n=28 to 105, P<0,0001** by Log-rank test). Similar results were obtained by stratification of GBM patients according to their TIC content. Given that TIC frequencies vary up to 500-fold between patients (Table 2), we divided GBM cohort in patients with low TIC content (1:20000-1:90000; n=8) and high TIC content (1:200-1:5000; n=5). Notably, patients with low TIC frequency experienced a longer, although not statistically significant, PFS (median 7.5 months versus 6 months, P=0.33ns by Log-rank test (Figure 2M). Interestingly, putative stem-cell markers, markers associated with different GBM molecular subtypes [28, 29] and common GBM genetic alterations were similarly distributed between patients with low and high TIC content (Supplementary Figures S1 and S2; Supplementary Table S1A). Moreover, no association of these markers with neurosphere formation was found (Supplementary Table S1B).
DISCUSSION
We established a quantitative assay that enables GBM TIC enumeration in human GBMs through direct injection of material immediately after the surgical procedure. Using this assay, we demonstrate that TICs are rare in GBMs. Moreover, TICs number is not uniform across patients and it is affected by in vitro culture manipulation, which overestimates the real TIC content.
Several research groups gave an estimation of GBM TIC frequencies, but these studies mostly relied on marker surface expression [12] (i.e. CD133 positive cells) or functional properties [9, 10, 30, 31]]. Such approaches often led to controversial results, since appropriate standardization methods to distinguish glioma stem-cells from progenitors or more differentiated cells are still lacking [32]. The estimated GBM TIC frequencies known in literature are mainly based on neurospheres [11, 12] and rarely on acutely dissociated tumors. Of note, the maintenance of surgical specimens for few passages, or even after one single passage, in a petri dish in serum-free condition can induce cell selection influencing the outcome of the frequency assessment [33]. In addition, a proper calculation of TIC frequency is still incomplete since tumor cells have been only rarely transplanted in cell dilution experiments.
We performed functional assays to determine the presence within freshly-dissociated human GBMs, of cells that more efficiently transplant the disease, and the occurrence of an analogy between TIC number calculated in vivo and in vitro. To address in vivo tumor propagation potential, we took advantage of an orthotopic xenograft model established in immunodeficient CD-1 nude mice [10, 34]. Different murine models have been developed to study human tumor xenografts, comprising severely compromised immunodeficient (SCID) mice, non-obese diabetic (NOD)-SCID or NSG mice [8, 15]. However, the use of more severely immunocompromised mouse strains could considerably increase TIC frequency, a scenario quite far from reality. Although the NOG mouse model shows markedly better engraftment of some tumoral cells than the NOD/SCID mouse [8, 15], according to our experience CD-1 mice survival was comparable to NOG survival.
We demonstrated that all GBMs analysed in this study contain rare TICs sustaining tumor growth, in accordance with other studies in GBMs and other types of tumors [5, 7, 12, 15, 17, 18]. Our results clearly show that not all human GBMs are able to grow in vitro but, remarkably, all of them are tumorigenic in vivo. Ex-vivo and in vivo experiments performed with cells kept in culture exclude from the analysis those GBMs not forming neurospheres, which we demonstrated are indeed representing a large proportion of tumors. Notably, the lack of correlation between tumor formation and ability to form neurospheres has been already demonstrated in a mouse model of glioma [35] and in a different cohort of GBM patients [36] emphasizing the importance of the cerebral compartment as a support for TIC growth and of in vivo limiting dilution assay on fresh specimens to assess the real TIC content.
However, controversial results exist demonstrating that in vitro sphere forming potential correlates with the in vivo tumorigenic potential in immunocompromised mice, as well as the ability to form neurospheres in culture can be considered a prognostic factor affecting GBM patient survival [25].
Performing a side-by-side analysis of the same specimen, we obtained an overestimation of TIC number when plating cells in semisolid substrate compared to xenotransplanting the same cells in immunocompromised mice. The higher TIC frequency in vitro is not surprising considering the known ability of progenitor cells to clone in vitro as well [10, 12]. In addition, the results make evident that the TIC frequency calculated through in vitro assays cannot portend the in vivo TIC frequency, reinforcing the need to investigate the tumor population immediately after surgical resection through in vivo LDA. Relevant is also the 10-fold difference quantified between the average TIC frequency of freshly-dissociated hGBMs and the average TIC frequency of in vitro maintained neurospheres. This different frequency might be explained by the composition of the two populations. Data from our group [10] and others’ [9, 30] demonstrated, through the use of marker-independent methods, that neurospheres are mainly composed by slow-dividing cells endowed with stem-cells characteristics and high-dividing cells, tumorigenic and able to proliferate, although for only few rounds.
After the establishment of an accurate estimation of TIC number, we explored the TIC influence on tumor incidence and mice survival. Interestingly, few studies exist only in other types of tumors reporting a relation between TIC frequencies and tumor aggressiveness, implemented through in vivo LDA in immunodeficient recipient mice [15, 37]. In line with these studies, we found a positive association between TIC frequency and GBM incidence and we defined a threshold over 10 TICs sufficient to induce tumors in 100% of cases. In addition, TIC number inversely correlated with mice survival. Notably, GBM patients with low TIC frequency experienced a trend towards a longer progression free survival. However, we did not find any association between the clinical features (tumor size and tumor invasiveness) and TIC content. Despite the controversial results related to markers clearly describing the TIC and their relation with GBM patients’ outcome [23, 24, 26], the expression of either putative stem-cell markers or markers associated with different GBM molecular subtypes [28, 29], or common genetic GBM hallmarks did not associate with either TIC content or neurosphere formation.
TICs derived from human GBMs have been characterized mainly in in vitro experiments and their effectiveness as informative tools in reflecting GBM pathophysiology, determining differentially regulated pathways as well as in exploring the potential efficacy of anticancer drugs is well recognized. With this study we demonstrate that in vivo examination of cells from freshly-dissociated GBMs in a context that closely resembles the original setting will provide an unbiased tool to analyse the widest range of GBMs. In addition, we believe that the assessed TIC frequency mirrors the real TIC content in human GBMs, especially in light of the recent findings related to the possible conversion of non-TICs to a TIC phenotype, which is dependent on microenvironmental cues and that can not be properly simulated in in vitro or ex vivo conditions [38–41].
Our findings establish the accuracy of TIC detection by injecting freshly-dissociated GBM cells, and the need for care when using in vitro cultured neurospheres. The orthotopic injection of acutely-dissociated human GBMs represents an unbiased pre-clinical tool for basic and translational research.
MATERIALS AND METHODS
GBM patients
Surgical specimens and clinical records were collected from 28 consenting patients in the Department of Neurosurgery at Neurological Institute “C. Besta” (Italy) under “C. Besta” research ethics committee approval. The specimens were analysed by pathologists and classified as primary GBM (WHO IV). Tumors displayed characteristics consistent with those reported in the literature concerning age, sex distribution, dimensional range, Karnofsky performance status scale (KPS) and invasiveness [36].
Overall survival and progression-free survival have been calculated as elapsed time from surgery to death or from surgery to the diagnosis of recurrence/progression. The patients enrolled in the study were 60% men and 40% women, with a median age of 58 years (range, 40-80 years) and a mean Karnofsky performance score of 80 (range 50-90). The mean follow up was 17 months (range 10-30); 7 patients were lost to follow up, whereas for the others mean progression free survival (PFS) was 8+/-5.8 months, while overall survival (OS) was 11.8+/-5.1 months, in accordance to RANO criteria [42]. Tumor invasiveness has been calculated as well as was evaluated invasiveness in the contralateral hemispheres. Distance of infiltration was estimated measuring the oedema area in FLAIR sequences in MRI. The majority of selected patients received radical surgery and concurrent chemoradiotherapy (CCRT).
Tumor sample preparation and in vitro assay
TICs were isolated from GBM surgical specimens as previously described [10]. Briefly, fresh tumors were finely minced, enzymatically digested with papain (2 mg/ml; Worthington Biochemical, Lakewood, NJ) at 37°C and mechanically dissociated until achievement of single cell suspension. To remove red blood cells, the single cell suspension was incubated at room temperature for 3 – 5 minutes with ACK (Ammonium-Chloride-Potassium) Lysing Buffer and then separated from debris using Percoll density gradient centrifugation. Viable cells were resuspended in serum-free medium (Dulbecco’s modified Eagle medium/ Ham’s F12 Nutrient Mixture; StemCell Technologies) supplemented with B27 supplement (Life Technologies, Paisley, United Kingdom; www.invitrogen.com), 20 ng/ml epidermal growth factor, 10 ng/ml basic fibroblast growth factor (PeproTech, Rocky Hill, NJ). Human GBM neurospheres were grown as spheroid aggregates as previously described [10].
To evaluate the capacity to form neurospheres, cells were resuspended in Dulbecco’s modified Eagle medium/F12 medium containing methylcellulose (StemCell Technologies, Vancouver, BC, Canada) and seeded on a minimum of three 35 mm culture plates (3000 cells/dish). Two weeks after plating, the number of clones was counted. The ratio between neurospheres formed and number of single cells plated corresponds to the percentage of TICs in the plate.
In Vivo Limiting Dilution Transplantation Assay
Decreasing cell concentrations (105-10 cells) derived from both freshly-dissociated GBM cells and hGBM-NS were resuspended in 2 μl of phosphate-buffered saline (PBS) and stereotaxically injected into the nucleus caudatus (coordinates from bregma: 1 mm posterior, 3 mm left lateral, and 3.5 mm in depth) of 5 weeks old female nu/nu CD1 mice (Charles River, Wilmington, MA; http://www.criver.com). Mice were intraperitoneally anesthetized with tribromoethanol (0.1 ml/10 g of body weight). The experiments were performed in accordance with the Italian laws (D.L.vo 116/92 and following additions), which enforce EU 86/609 Directive (Council Directive 86/609/EEC of 24 November 1986 on the approximation of laws, regulations and administrative provisions of the Member States regarding the protection of animals used for experimental and other scientific purposes). The mice were maintained until development of neurologic signs, and the brains of killed mice were collected.
Statistical Analysis
Paired samples t-test was used to compare TIC frequency calculated through in vitro methylcellulose assay and in vivo LDA on matched freshly-dissociated hGBMs. TIC frequency assessed through in vivo LDA in freshly-dissociated hGBMs and in hGBM-NS was compared performing the unpaired Student t-test. The relation between matched values of in vivo/in vitro TIC frequency was evaluated by means of correlation analysis. For the in vivo LDA, TIC frequency and statistical significance were estimated by means of the extreme limiting dilution analysis function (http://bioinf.wehi.edu.au/software/elda/). The incidences of tumors per number of injected cells and injected TICs were compared by means of Log-linear analysis (G2 test; http://www.biostathandbook.com/gtestgof.html). In Kaplan–Meier curves, survival differences were compared by Log-rank test. P-values less than 0.05 were considered statistically significant (**) unless otherwise indicated. All statistical tests were two-sided.
ACKNOWLEDGMENTS
We are grateful to Matteo Setti and Barbara Ortensi for helpful discussion and suggestions. C.R. designed and performed research, analysed data, wrote the article; D.O. designed and performed research and analysed data; M.D.B. collected and analysed data; M.P., B.P. performed immunohistochemical analysis; F.D.M. collected surgical samples, L.F. performed statistical analysis. G.P. conceived, designed and supervised the research and wrote the article. All the authors reviewed and approved the final version the manuscript.
CONFLICTS OF INTEREST
The authors declare no conflict of interest
GRANT SUPPORT
This work was supported by Fondazione Umberto Veronesi (FUV to C.R.) and by Italian Ministero della Salute to G.P.
REFERENCES
1. Jansen M, Yip S and Louis DN. Molecular pathology in adult gliomas: diagnostic, prognostic, and predictive markers. Lancet Neurol. 2010; 9:717-726.
2. Louis DN, Ohgaki H, Wiestler OD, Cavenee WK, Burger PC, Jouvet A, Scheithauer BW and Kleihues P. The 2007 WHO classification of tumours of the central nervous system. Acta Neuropathol. 2007; 114:97-109.
3. Stupp R, Mason WP, van den Bent MJ, Weller M, Fisher B, Taphoorn MJ, Belanger K, Brandes AA, Marosi C, Bogdahn U, Curschmann J, Janzer RC, Ludwin SK, et al. Radiotherapy plus concomitant and adjuvant temozolomide for glioblastoma. N Engl J Med. 2005; 352:987-996.
4. Baum CM, Weissman IL, Tsukamoto AS, Buckle AM and Peault B. Isolation of a candidate human hematopoietic stem-cell population. Proc Natl Acad Sci U S A. 1992; 89:2804-2808.
5. Al-Hajj M, Wicha MS, Benito-Hernandez A, Morrison SJ and Clarke MF. Prospective identification of tumorigenic breast cancer cells. Proc Natl Acad Sci U S A. 2003; 100:3983-3988.
6. Ricci-Vitiani L, Lombardi DG, Pilozzi E, Biffoni M, Todaro M, Peschle C and De Maria R. Identification and expansion of human colon-cancer-initiating cells. Nature. 2007; 445:111-115.
7. Lee CJ, Dosch J and Simeone DM. Pancreatic cancer stem cells. J Clin Oncol. 2008; 26:2806-2812.
8. Quintana E, Shackleton M, Sabel MS, Fullen DR, Johnson TM and Morrison SJ. Efficient tumour formation by single human melanoma cells. Nature. 2008; 456:593-598.
9. Deleyrolle LP, Harding A, Cato K, Siebzehnrubl FA, Rahman M, Azari H, Olson S, Gabrielli B, Osborne G, Vescovi A and Reynolds BA. Evidence for label-retaining tumour-initiating cells in human glioblastoma. Brain. 2011; 134:1331-1343.
10. Richichi C, Brescia P, Alberizzi V, Fornasari L and Pelicci G. Marker-independent method for isolating slow-dividing cancer stem cells in human glioblastoma. Neoplasia. 2013; 15:840-847.
11. Galli R, Binda E, Orfanelli U, Cipelletti B, Gritti A, De Vitis S, Fiocco R, Foroni C, Dimeco F and Vescovi A. Isolation and characterization of tumorigenic, stem-like neural precursors from human glioblastoma. Cancer Res. 2004; 64:7011-7021.
12. Singh SK, Hawkins C, Clarke ID, Squire JA, Bayani J, Hide T, Henkelman RM, Cusimano MD and Dirks PB. Identification of human brain tumour initiating cells. Nature. 2004; 432:396-401.
13. O’Brien CA, Pollett A, Gallinger S and Dick JE. A human colon cancer cell capable of initiating tumour growth in immunodeficient mice. Nature. 2007; 445:106-110.
14. Eramo A, Lotti F, Sette G, Pilozzi E, Biffoni M, Di Virgilio A, Conticello C, Ruco L, Peschle C and De Maria R. Identification and expansion of the tumorigenic lung cancer stem cell population. Cell Death Differ. 2008; 15:504-514.
15. Ishizawa K, Rasheed ZA, Karisch R, Wang Q, Kowalski J, Susky E, Pereira K, Karamboulas C, Moghal N, Rajeshkumar NV, Hidalgo M, Tsao M, Ailles L, et al. Tumor-initiating cells are rare in many human tumors. Cell Stem Cell. 2010; 7:279-282.
16. Kelly PN, Dakic A, Adams JM, Nutt SL and Strasser A. Tumor growth need not be driven by rare cancer stem cells. Science. 2007; 317:337.
17. Boiko AD, Razorenova OV, van de Rijn M, Swetter SM, Johnson DL, Ly DP, Butler PD, Yang GP, Joshua B, Kaplan MJ, Longaker MT and Weissman IL. Human melanoma-initiating cells express neural crest nerve growth factor receptor CD271. Nature. 2010; 466:133-137.
18. Schatton T, Murphy GF, Frank NY, Yamaura K, Waaga-Gasser AM, Gasser M, Zhan Q, Jordan S, Duncan LM, Weishaupt C, Fuhlbrigge RC, Kupper TS, Sayegh MH and Frank MH. Identification of cells initiating human melanomas. Nature. 2008; 451:345-349.
19. Hu Y and Smyth GK. ELDA: extreme limiting dilution analysis for comparing depleted and enriched populations in stem cell and other assays. J Immunol Methods. 2009; 347:70-78.
20. Kok M, Koornstra RH, Margarido TC, Fles R, Armstrong NJ, Linn SC, Van’t Veer LJ and Weigelt B. Mammosphere-derived gene set predicts outcome in patients with ER-positive breast cancer. J Pathol. 2009; 218:316-326.
21. Kim HS, Yoo SY, Kim KT, Park JT, Kim HJ and Kim JC. Expression of the stem cell markers CD133 and nestin in pancreatic ductal adenocarcinoma and clinical relevance. Int J Clin Exp Pathol. 2012; 5:754-761.
22. Pirozzi G, Tirino V, Camerlingo R, La Rocca A, Martucci N, Scognamiglio G, Franco R, Cantile M, Normanno N and Rocco G. Prognostic value of cancer stem cells, epithelial-mesenchymal transition and circulating tumor cells in lung cancer. Oncol Rep. 2013; 29:1763-1768.
23. Zhang M, Song T, Yang L, Chen R, Wu L, Yang Z and Fang J. Nestin and CD133: valuable stem cell-specific markers for determining clinical outcome of glioma patients. J Exp Clin Cancer Res. 2008; 27:85.
24. Zhang W, Chen H, Lv S and Yang H. High CD133 Expression Is Associated with Worse Prognosis in Patients with Glioblastoma. Mol Neurobiol. 2015.
25. Laks DR, Masterman-Smith M, Visnyei K, Angenieux B, Orozco NM, Foran I, Yong WH, Vinters HV, Liau LM, Lazareff JA, Mischel PS, Cloughesy TF, Horvath S and Kornblum HI. Neurosphere formation is an independent predictor of clinical outcome in malignant glioma. Stem Cells. 2009; 27:980-987.
26. Kim KJ, Lee KH, Kim HS, Moon KS, Jung TY, Jung S and Lee MC. The presence of stem cell marker-expressing cells is not prognostically significant in glioblastomas. Neuropathology. 2011; 31:494-502.
27. Lee J, Kotliarova S, Kotliarov Y, Li A, Su Q, Donin NM, Pastorino S, Purow BW, Christopher N, Zhang W, Park JK and Fine HA. Tumor stem cells derived from glioblastomas cultured in bFGF and EGF more closely mirror the phenotype and genotype of primary tumors than do serum-cultured cell lines. Cancer Cell. 2006; 9:391-403.
28. Phillips HS, Kharbanda S, Chen R, Forrest WF, Soriano RH, Wu TD, Misra A, Nigro JM, Colman H, Soroceanu L, Williams PM, Modrusan Z, Feuerstein BG and Aldape K. Molecular subclasses of high-grade glioma predict prognosis, delineate a pattern of disease progression, and resemble stages in neurogenesis. Cancer Cell. 2006; 9:157-173.
29. Verhaak RG, Hoadley KA, Purdom E, Wang V, Qi Y, Wilkerson MD, Miller CR, Ding L, Golub T, Mesirov JP, Alexe G, Lawrence M, O’Kelly M, et al. Integrated genomic analysis identifies clinically relevant subtypes of glioblastoma characterized by abnormalities in PDGFRA, IDH1, EGFR, and NF1. Cancer Cell. 2010; 17:98-110.
30. Clement V, Marino D, Cudalbu C, Hamou MF, Mlynarik V, de Tribolet N, Dietrich PY, Gruetter R, Hegi ME and Radovanovic I. Marker-independent identification of glioma-initiating cells. Nat Methods. 2010; 7:224-228.
31. Patrawala L, Calhoun T, Schneider-Broussard R, Zhou J, Claypool K and Tang DG. Side population is enriched in tumorigenic, stem-like cancer cells, whereas ABCG2+ and ABCG2- cancer cells are similarly tumorigenic. Cancer Res. 2005; 65:6207-6219.
32. Brescia P, Richichi C and Pelicci G. Current strategies for identification of glioma stem cells: adequate or unsatisfactory? J Oncol. 2012; 2012:376894.
33. Williams SA, Anderson WC, Santaguida MT and Dylla SJ. Patient-derived xenografts, the cancer stem cell paradigm, and cancer pathobiology in the 21st century. Lab Invest. 2013; 93:970-982.
34. Brescia P, Ortensi B, Fornasari L, Levi D, Broggi G and Pelicci G. CD133 is essential for glioblastoma stem cell maintenance. Stem Cells. 2013; 31:857-869.
35. Barrett LE, Granot Z, Coker C, Iavarone A, Hambardzumyan D, Holland EC, Nam HS and Benezra R. Self-renewal does not predict tumor growth potential in mouse models of high-grade glioma. Cancer Cell. 2012; 21:11-24.
36. Joo KM, Kim J, Jin J, Kim M, Seol HJ, Muradov J, Yang H, Choi YL, Park WY, Kong DS, Lee JI, Ko YH, Woo HG, Lee J, Kim S and Nam DH. Patient-specific orthotopic glioblastoma xenograft models recapitulate the histopathology and biology of human glioblastomas in situ. Cell Rep. 2013; 3:260-273.
37. Pece S, Tosoni D, Confalonieri S, Mazzarol G, Vecchi M, Ronzoni S, Bernard L, Viale G, Pelicci PG and Di Fiore PP. Biological and molecular heterogeneity of breast cancers correlates with their cancer stem cell content. Cell. 2010; 140:62-73.
38. Suva ML, Rheinbay E, Gillespie SM, Patel AP, Wakimoto H, Rabkin SD, Riggi N, Chi AS, Cahill DP, Nahed BV, Curry WT, Martuza RL, Rivera MN, et al. Reconstructing and reprogramming the tumor-propagating potential of glioblastoma stem-like cells. Cell. 2014; 157:580-594.
39. Heddleston JM, Li Z, McLendon RE, Hjelmeland AB and Rich JN. The hypoxic microenvironment maintains glioblastoma stem cells and promotes reprogramming towards a cancer stem cell phenotype. Cell Cycle. 2009; 8:3274-3284.
40. Hjelmeland AB, Wu Q, Heddleston JM, Choudhary GS, MacSwords J, Lathia JD, McLendon R, Lindner D, Sloan A and Rich JN. Acidic stress promotes a glioma stem cell phenotype. Cell Death Differ. 2011; 18:829-840.
41. Auffinger B, Tobias AL, Han Y, Lee G, Guo D, Dey M, Lesniak MS and Ahmed AU. Conversion of differentiated cancer cells into cancer stem-like cells in a glioblastoma model after primary chemotherapy. Cell Death Differ. 2014; 21:1119-1131.
42. Lutz K, Radbruch A, Wiestler B, Baumer P, Wick W and Bendszus M. Neuroradiological response criteria for high-grade gliomas. Clin Neuroradiol. 2011; 21:199-205.