
INTRODUCTION
Osteosarcoma is one of the most frequent primary malignant bone tumors that occurs in childhood [1]. Intensive chemotherapy was introduced in the 1970s, which significantly improved survival and currently about two thirds of patients recover [2]. The treatment aims to reduce the initial tumor volume and to eliminate the potential of micrometastases [3]. The cytostatic drugs that are used in preoperative chemotherapy are doxorubicin, cisplatin, ifosphamide, and methotrexate (MTX) [4]. MTX, a folic acid antagonist, is used in high dosages to treat all osteosarcoma tumors. It penetrates into the cells and inhibits the production of metabolites essential for the synthesis of nucleotides [5]. MTX is very effective in the treatment of osteosarcoma; however, reduced elimination may induce side effects such as hepatotoxicity and myelotoxicity. Therefore, MTX-serum levels after administration are routinely monitored together with hepatic and bone marrow function.
There are large inter-individual differences in the elimination of MTX and in the severity of the toxic symptoms during therapy. There are many influencing factors already known and proven, e.g., hydration, pH level of urine, leucovirin dosage, anatomic and physiological parameters, and differences in the protocol. Beyond these, the individual differences in the pharmacokinetics and toxicities are also influenced by genetic factors; however, mapping of the significance of genetic factors influencing MTX metabolism is still in the initial stages. The genetic variants of the relevant genes may alter adsorption, distribution, metabolism, as well as excretion of the drug, and can lead to these differences [6]. A review of Ferrari S showed that effective molecular-targeted therapies are unlikely to be available in the near future due to genomic complexity and the heterogeneity of osteosarcoma. Therefore, optimizing the use of the current drugs available by personalizing chemotherapy treatment is a potential new line for clinical research in osteosarcoma [7].
A schematic overview of the intracellular MTX pathway with our selected genes is presented in Figure 1. MTX enters the cell via the solute carrier family 19, member 1 (SLC19A1) transporter protein [5]. A frequently studied polymorphism of this gene is the 80G>A (rs1051266), which leads to an Arg27His exchange in the first transmembrane domain and causes an increased affinity for folic acid [8]. This SNP is associated with the development of severe mucositis in children with osteosarcoma [9]. Within the cell, MTX is polyglutamated by the enzyme folylpolyglutamate-synthetase (FPGS) to its active form, which enters the folic acid cycle. The polyglutamated MTX derivatives are hydrolyzed, creating the monoglutamated form by gamma-glutamyl-hydrolase (GGH) in the lysosome to facilitate elimination [10]. The GGH -401C>T (rs3758149) variant enhances promoter activity, increasing protein expression. Increased levels of GGH lead to a decreased accumulation of polyglutamated MTX and MTX-resistance [11]. Free MTX is exported from the cell through the ABCC1-5 and ABCG2 transporters of the ABC (ATP-binding cassette) protein family [12]. The ABCB1 transports its substrates towards the lumen in the intestines and the blood vessels thus preventing adsorption. It participates in excretion, and in forming blood-tissue barriers in the hepatocytes and the cells of the renal tubules [13]. The clinical response to conventional chemotherapy in osteosarcoma is limited due to drug resistance, caused by the overexpression of ABCB1. A study of an ABCB1/ABCC1 inhibitor found that in osteosarcoma cell lines, the inhibitor was able to revert the ABCB1/ABCC1-mediated resistance against doxorubicin [14]. ABCC1 mainly appears in dividing cells and has an explicit barrier function. The primary task of this protein is the protection of cells against toxic effects and contribution to the barrier function [15]. ABCC2 is mainly expressed on the apical surface of hepatocytes, in the intestine, and in the proximal tubules of the kidney [16]. It plays an important role in eliminating endogenous metabolites and xenobiotics. ABCC3 participates in biliary and intestinal excretion of organic anions [17]. ABCG2 blocks the adsorption of toxic substances in the intestine and enhances excretion into the gall bladder [18]. Genetic variants in ABC-transporter genes may alter gene expression, as well as substrate recognition, activity, and function of these proteins [19].
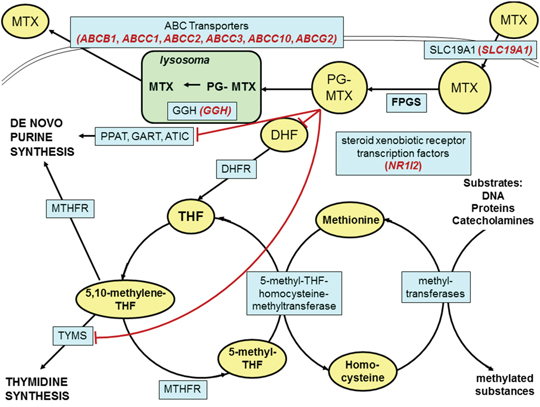
Figure 1: Schematic overview of the intracellular methotrexate pathway. Key molecules and derivatives of the pathway are denoted as yellow ovals; transporter proteins and regulatory enzymes as blue rectangles. The examined genes are shown in brackets with red italics near the name of the encoded proteins. MTX: methotrexate; PG-MTX: methotrexate polyglutamates; DHF: dihydrofolate; THF: tetrahydrofolate; FPGS: folylpolyglutamate synthetase; DHFR: dihydrofolate reductase; MTHFR: 5,10-methylenetetrahydrofolate reductase; TYMS: thymidylate synthetase; PPAT: phosphoribosyl pyrophosphate amidotransferase; GART: glycinamide ribonucleotide formyltransferase; ATIC: 5-aminoimidazole-4-carboxamide ribonucleotide formyltransferase; GGH: gamma-glutamyl hydrolase; SLC19A1: solute carrier family 19, member 1; NR1I2: nuclear receptor subfamily 1, group I, member 2; ABC transporters: ATP-binding cassette transporters.
NR1I2, alias SXR (nuclear receptor subfamily 1, group I, member 2 or steroid and xenobiotic receptor) gene belongs to the nuclear receptor superfamily. The NR1I2 protein activates the transcription of many other genes that participate in the metabolism and secretion of potentially harmful xenobiotics, drugs, and endogenous chemical compounds. In the development of drug resistance, it participates in the regulation of gene transcription [20], [21].
The aim of this study was to investigate the pharmacokinetics of high-dose MTX treatment and the pharmacogenetics, pharmacokinetics, and toxicity of chemotherapy.
RESULTS
In our analysis, 551 MTX blocks in 59 patients were tested. The genotype and allele frequency of these SNPs are summarized in Table 1.
Table 1: Selected genes and single nucleotide polymorphisms important in the methotrexate pathway
Gene |
Polymorphism |
Allele (1/2) |
Genotype N 11 (%) 1 |
Genotype N 12 (%) 1 |
Genotype N 22 (%) 1 |
MAF*100 2 (%) |
HWE 3 (p) |
|---|---|---|---|---|---|---|---|
ABCB1 |
rs1045642 |
C/T |
16 |
23 |
15 |
49 |
0.27 |
ABCB1 |
rs1128503 |
C/T |
16 |
29 |
14 |
48 |
0.28 |
ABCB1 |
rs9282564 |
A/G |
31 |
10 |
0 |
12 |
0.37 |
ABCC1 |
rs4148358 |
G/A |
32 |
11 |
2 |
17 |
0.42 |
ABCC1 |
rs246219 |
G/A |
38 |
9 |
1 |
11 |
0.59 |
ABCC1 |
rs246221 |
A/G |
25 |
17 |
5 |
29 |
0.42 |
ABCC1 |
rs12922588 |
A/G |
20 |
23 |
9 |
39 |
0.49 |
ABCC1 |
rs215060 |
A/G |
28 |
18 |
0 |
20 |
0.1 |
ABCC1 |
rs4148330 |
A/G |
17 |
22 |
4 |
35 |
0.4 |
ABCC2 |
rs2273697 |
G/A |
32 |
19 |
2 |
22 |
0.68 |
ABCC2 |
rs3740066 |
G/A |
23 |
21 |
8 |
36 |
0.39 |
ABCC2 |
rs717620 |
G/A |
28 |
13 |
1 |
18 |
0.72 |
ABCC3 |
rs4793665 |
T/C |
17 |
30 |
9 |
43 |
0.48 |
ABCC3 |
rs2107441 |
A/G |
16 |
23 |
6 |
39 |
0.61 |
ABCC3 |
rs2412333 |
G/A |
23 |
24 |
4 |
31 |
0.5 |
ABCC3 |
rs733392 |
G/A |
21 |
28 |
3 |
33 |
0.1 |
ABCC3 |
rs12602161 |
A/G |
37 |
14 |
0 |
14 |
0.1 |
ABCC10 |
rs1214748 |
G/A |
15 |
28 |
5 |
40 |
0.12 |
ABCC10 |
rs831314 |
A/G |
37 |
13 |
2 |
16 |
0.53 |
ABCC10 |
rs1214752 |
G/A |
19 |
18 |
8 |
38 |
0.31 |
ABCG2 |
rs2231142 |
C/A |
39 |
13 |
0 |
13 |
0.3 |
GGH |
rs3758149 |
C/T |
20 |
28 |
7 |
38 |
0.56 |
SLC19A1 |
rs1051266 |
A/G |
15 |
27 |
14 |
49 |
0.79 |
SXR |
rs7643038 |
A/G |
16 |
20 |
9 |
42 |
0.55 |
SXR |
rs3814055 |
G/A |
18 |
23 |
11 |
43 |
0.47 |
SXR |
rs1054190 |
G/A |
36 |
12 |
0 |
13 |
0.32 |
SXR |
rs3732361 |
G/A |
13 |
24 |
9 |
46 |
0.72 |
SXR |
rs3814058 |
A/G |
25 |
16 |
3 |
25 |
0.84 |
SXR |
rs6785049 |
A/G |
11 |
29 |
9 |
48 |
0.19 |
SNP: single nucleotide polymorphisms
MTX: methotrexate.
1 11: homozygous for the first allele, 12: heterozygous; 22: homozygous for the second allele.
2 MAF: Minor allele frequency * 100 (%).
3 HWE: deviation from the Hardy–Weinberg equilibrium (χ2-test).
Pharmacokinetics of MTX
The results of the univariate association analysis are summarized in Table 2.
Table 2: Relevant p-values of univariate association test between SNPs and target variables
Gene |
Polymorphism |
Tα1/2 |
AUC0-48 |
Peak MTX |
48 h MTX |
Hepato-toxicity |
Myeol-toxicity |
|---|---|---|---|---|---|---|---|
ABCB1 |
rs1045642 |
- |
- |
- |
- |
- |
- |
ABCB1 |
rs1128503 |
- |
- |
- |
- |
- |
- |
ABCB1 |
rs9282564 |
- |
↑0.04 |
↑0.02 |
- |
- |
- |
ABCC1 |
rs4148358 |
- |
- |
- |
- |
- |
- |
ABCC1 |
rs246219 |
- |
- |
- |
- |
- |
- |
ABCC1 |
rs246221 |
- |
- |
- |
- |
- |
- |
ABCC1 |
rs12922588 |
- |
- |
- |
- |
- |
- |
ABCC1 |
rs215060 |
- |
- |
- |
- |
- |
- |
ABCC1 |
rs4148330 |
- |
- |
- |
- |
- |
- |
ABCC2 |
rs2273697 |
- |
- |
- |
- |
- |
↑0.02 |
ABCC2 |
rs3740066 |
- |
↓0.01 |
- |
- |
- |
↓0.02 |
ABCC2 |
rs717620 |
- |
- |
- |
- |
- |
- |
ABCC3 |
rs4793665 |
- |
↓0.03 |
- |
- |
- |
- |
ABCC3 |
rs2107441 |
- |
- |
- |
- |
- |
- |
ABCC3 |
rs2412333 |
- |
- |
- |
- |
- |
- |
ABCC3 |
rs733392 |
- |
- |
- |
- |
- |
- |
ABCC3 |
rs12602161 |
- |
- |
- |
- |
- |
- |
ABCC10 |
rs1214748 |
- |
- |
- |
- |
- |
- |
ABCC10 |
rs831314 |
- |
- |
- |
- |
- |
- |
ABCC10 |
rs1214752 |
- |
- |
- |
- |
- |
- |
ABCG2 |
rs2231142 |
↑0.037 |
- |
- |
- |
- |
- |
GGH |
rs3758149 |
- |
- |
- |
- |
- |
- |
SLC19A1 |
rs1051266 |
- |
- |
- |
- |
- |
- |
SXR |
rs7643038 |
↑0.02 |
- |
- |
- |
- |
- |
SXR |
rs3814055 |
↑0.04 |
- |
- |
- |
- |
- |
SXR |
rs1054190 |
- |
- |
- |
- |
- |
- |
SXR |
rs3732361 |
- |
- |
- |
↑0.01 |
↓0.014 |
↓0.013 |
SXR |
rs3814058 |
- |
- |
- |
- |
↓0.007 |
↓0.007 |
SXR |
rs6785049 |
- |
- |
- |
↑0.006 |
↓0.02 |
↓0.01 |
“-” no correlation with the number of variant allele and the target variable (p > 0.05).
Direction of the arrow: the presence of the variant allele increases (↑) or decreases (↓) the value of the pharmacokinetic target variable or the frequency of the toxicity.
Analyzing the half-live of MTX, it seems that the presence of a variant allele of ABCG2 rs2231142 (odds ratio (OR) = 4.2, 95% confidence interval (CI) = 1.0–17.8, p = 0.037) is associated with a longer first half-life of MTX (Tα1/2). Moreover, the presence of the SNPs NR1I2 rs7643038 (OR = 2.6, 95% CI = 1.2–5.9, p = 0.02) and rs3814055 (OR = 2.2, 95% CI = 1.1–5.1, p = 0.03) show a positive correlation.
The area under the concentration–time curve was also influenced by some SNPs in our population. The presence of a variant allele ABCB1 rs9282564 (OR = 4.2, 95% CI = 0.9–18.2, p = 0.04) was associated with higher AUC0-48 values. In the case of the variant allele ABCC3 rs4793665 (OR = 0.2, 95% CI = 0.1–0.9, p = 0.03), as well as the homozygous variant genotype allele ABCC2 rs3740066 (OR = 0.1, 95% CI = 0.01–0.8, p = 0.01), AUC0-48 was lower.
The peak MTX concentrations proved to be higher in the presence of the polymorphism ABCB1 rs9282564 (OR = 8.8, 95% CI = 1.02–75.6, p = 0.02).
For ABCB1 rs9282564, the AUC0-48 of the concentration–time curve and the peak concentration were higher in patients with the variant allele, compared with patients with the homozygous TT genotype.
A higher 48-h MTX concentration value showed a correlation with the presence of variant alleles of NR1I2, rs3732361 (OR = 2.6, 95% CI = 1.2–5.9, p = 0.01), and rs6785049 (OR = 14.0, 95% CI = 1.8–106.5, p = 0.006) SNPs.
Hepatotoxicity and myelotoxicity
The risk of hepatic toxicity was lower in the presence of variant alleles of NR1I2 rs3732361 (OR = 0.1, 95% CI = 0.01–0.7, p = 0.014), rs3814058 (OR = 0.3, 95% CI = 0.1–0.7, p = 0.007), and rs6785049 (OR = 0.1, 95% CI = 0.01–0.7, p = 0.02) SNPs.
The risk of bone marrow toxicity was higher due to a mutation in ABCC2 rs2273697 (OR = 3.3, 95% CI = 1.2–9.4, p = 0.02) and lower due to variant alleles of ABCC2 rs3740066 (OR = 0.4, 95% CI = 0.2–0.9, p = 0.02), NR1I2 rs3732361 (OR = 0.1, 95% CI = 0.01–0.7, p = 0.013), rs3814058 (OR = 0.3, 95% CI = 0.1–0.7, p = 0.007), and rs6785049 (OR = 0.09, 95% CI = 0.01–0.7, p = 0.01) SNPs.
Bayesian network-based Bayesian univariate and multilevel analysis of relevance (BN-BMLA)
Using the univariate BMLA method, we analyzed whether the above-mentioned 29 SNPs had any effect on the pharmacokinetic factors (AUC0-48, peak MTX level, Tα1/2), as well as the hepatic and bone marrow toxicity. This method gives posterior probability values, indicating the level of probability that the models confirm a strong relationship between the SNP and the analyzed variable, taking into consideration relevant information. The posterior probability is given in brackets after the SNP. The AUC0-48 is likely to be influenced by ABCB1 rs9282564 (0.47), ABCC3 rs4793665 (0.31), GGH rs3758149 (0.45), and NR1I2 rs3814058 (0.38) (Figure 2). The peak concentration is likely to be influenced by ABCB1 rs9282564 (0.7), ABCC3 rs4793665 (0.6), and NR1I2 rs3814058 (0.58). Hepatic toxicity may be influenced by ABCC1 rs246219 (0.6), while bone marrow toxicity may be influenced by the presence of ABCC2 rs717620 (0.56) (Figure 2).
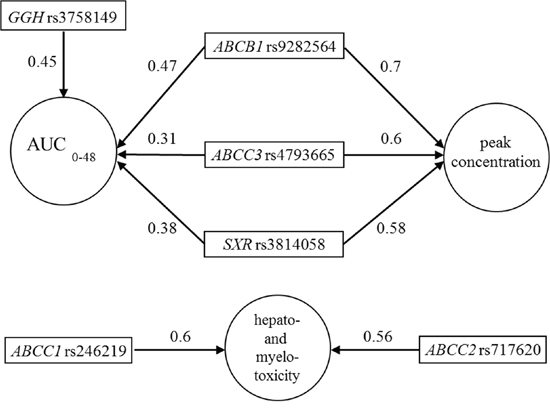
Figure 2: Subgraphs of the strongly relevant variables in pharmacokinetics and hepato-and myelotoxicity according to the univariate Bayesian network-based Bayesian multilevel analysis of relevance (BN-BMLA). The direction of the arrows determines the variable that may produce an effect on the other. Number on the arrow: posterior probability indicating the level of probability that the models may confirm a strong relationship between two variables.
In multiple-target variable BMLA analysis, beyond all possible inner interrelations of the cluster of the target variables (pharmacokinetic and toxicity data) and explanatory variables (age, gender, applied dose, duration of infusion, and the 29 SNPs), we also examined which explanatory variables will have direct relevance for the cluster of target variables. A relevant effect for the target variable cluster was detected in the case of ABCB1 rs928256 (0.6) SNP (Figure 3), which affected the AUC0-48 and also the peak concentration according to univariate analysis. Similarly, in case of the ABCC3 rs4793665 (0.48) and GGH rs3758149 (0.41) SNPs, the influence on the area under the curve could also be demonstrated using multivariate analysis. In the multivariable BMLA analysis, NR1I2 rs3814058 (0.44) may also influence the network system of toxicity and pharmacokinetics; using the univariate BMLA method, it was found to be related to the pharmacokinetic data, and the univariate association method showed a correlation with toxicity occurrence.
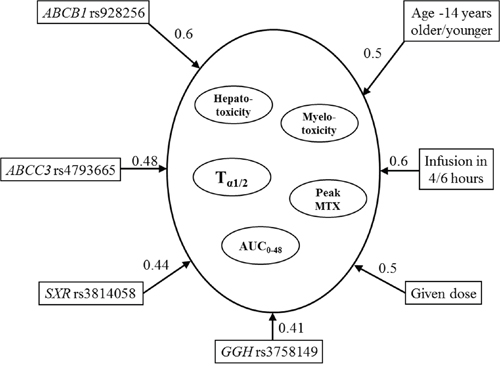
Figure 3: Subgraphs of the strongly relevant variables in pharmacokinetics and hepato- and myelotoxicity according to the multivariate BN-BMLA. The direction of the arrows determines the variable that may produce an effect on the other. Number on the arrow: posterior probability indicating the level of probability that the models may confirm the strong relationship between two variables.
DISCUSSION
There are inter-individual differences in the pharmacokinetics of high-dose MTX treatment, which may lead to toxicities. Due to the complex metabolism and pathway of MTX, there are still several unknown factors that are likely to be revealed through further research. Genetic variants of genes involved in transport and metabolism were analyzed in patients with osteosarcoma to study the pharmacogenetics, pharmacokinetics, and toxicities of MTX.
Certain factors that distort MTX metabolism are already known and proven, such as hydration, pH level of urine, leucovirin dosage, anatomic and physiological parameters, and differences in the protocol, along with many other factors. Beyond these, individual differences in pharmacokinetics and toxicity are mainly influenced by genetic factors, but the significance of these factors regarding their influence in MTX metabolism has yet to be determined.
The most frequently studied polymorphism of the GGH gene is SNP -401C>T, located in the promoter region regulating gene expression. This SNP influenced the area below the 48-h curve in our population, identified using univariate and multivariate BN-BMLA analysis. The polymorphism in the GGH -401C>T promoter and the MTX polyglutamate levels in red blood cells were studied in patients with rheumatoid arthritis, who were treated weekly with low-dose MTX. The probability to have a MTXPG3-5 level below the group median was 4.8 times higher in patients with the GGH-401TT genotype, compared with patients with the C allele [22]. The enzyme GGH is important in both folate and antifolate metabolism; therefore, it is difficult to clearly define its direct role in antifolate drug resistance [23]. The influence on folic acid metabolism may compensate its effect on MTX [24]. The overexpression of the enzyme reduces the effect of antifolates, as the cells are unable to accumulate the polyglutamated form [22]. However, due to the increased GGH activity, folic acid tends to be released faster, which may cause an increased sensitivity to antifolates [10]. Cole et al. found that the overexpression of the enzyme GGH did not provide resistance to short-term MTX exposure in cancer cells. As well as affecting MTX metabolism and accumulation, the enzyme influences folic acid metabolism, which may compensate its effect on MTX [24]. The enzyme GGH is evidently important in the folate and antifolate metabolism in cells; however it is difficult to clearly define its direct role in antifolate drug resistance. Nevertheless, the measurements of the levels of GGH may provide valuable information in determining the antifolate sensitivity of tumors [23].
ABC-transporters are important in drug adsorption, distribution, and elimination. Genetic variants of six ABC-transporter genes were studied to assess whether they have an effect on the pharmacokinetics and toxicity of MTX. The AUC0-48 of the concentration–time curve and the peak concentration proved to be higher in patients with the ABCB1 rs9282564 variant allele, according to both the frequentist-based univariate and univariate BN-BMLA analysis. In our analysis with multiple target variables, the studied ABCB1 SNP was also shown to have a relevant effect on the target variables combining the kinetics and toxicity. The rs9282564 (Asn21Asp) SNP of ABCB1 is a missense polymorphism and creates a T>C exchange at position 61 within exon 2 of the gene. The role of this polymorphism has been studied in connection with several drugs, but no reduced drug elimination has been observed in rs9282564CC homozygous HeLa cell lines [25]. Also, Kimchi-Sarfaty et al. not could detect a reduced gene expression in the presence of this variant in HeLa cell line [25]. In the literature, there are no studies that examine the correlation between this polymorphism and the pharmacogenetics of MTX. Sainz et al. studied the polymorphism in connection with the formation of colorectal tumors and detected a significant association between its presence and the risk of colorectal tumors in men [26].
The rs4793665 polymorphism of the ABCC3 gene was relevant in both univariate and the multivariate analyses. It is located in the promoter region of the gene and causes a C>T exchange at base-pair-211. ABCC3 was studied by sequencing 103 healthy Caucasian individuals, searching for genetic variants which may be related to the mRNA and protein levels measured in the liver. The mRNA level and the protein level of the ABCC3 gene did not correlate with each other. However, in individuals with the -211TT genotype, the mRNA level of ABCC3 was significantly lower compared with people with the CC and CT alleles. It has also been shown that the presence of the polymorphism influences the binding of nuclear factors [27]. In patients with juvenile idiopathic arthritis treated with MTX, ABCC3 rs4793665 had significant effects on the therapeutic response. It could be reached more frequently in the presence of the variant allele (T), compared with patients with other genotypes [28].
NR1I2, also known as SXR, induces the expression of other enzymes or transporters, such as CYP3A4, CYP3A5, and ABCB1 [29]. The NR1I2 variant rs3814058 was shown to be important in all three of the analyses in our population, specifically: (1) it influenced the risk of bone marrow and liver toxicity using univariate frequentist-based analysis and showed a strong relevance with the AUC0-48 and with the peak concentration in univariate BN-BMLA analysis and (2) it had an influence on pharmacokinetic toxicity in multivariate BN-BMLA analysis. NR1I2 rs3814058, located in the 3′- untranslated region of the gene, causes a T>C base-pair replacement at position 42961 UTR, and is poorly documented in the literature. In a Scandinavian study, the prognostic role of the NR1I2 gene variants were examined in primary sclerosing cholangitis; none of the NR1I2 variants were a predisposing factor to the disease, but patients with the rs3814058 homozygous variant genotype had a lower median survival [30]. The P-glycoprotein (ABCB1) level was 1.45 times lower in bowel biopsy samples of patients with NR1I2 rs3814058 heterozygous genotype than in samples of patients with the homozygous wild-type genotype [21].
Our results show that several genetic variants may have an impact on MTX kinetics and toxicity in osteosarcoma patients. The metabolic pathway of the metabolism of MTX is very complex; the genetic variants may influence several molecules. Identifying a single genetic difference is not sufficient for a proper prognostic factor of the kinetics and toxicity of MTX. To properly understand the role of genetic variation, a large prospective study examining the effects of several SNPs is recommended. Evaluating the significance of pharmacokinetic factors, the epigenetic, posttranslational, and biochemical differences of MTX metabolism should also be taken into consideration.
MATERIALS AND METHODS
Patients
Our patient population consisted of 59 children diagnosed with osteosarcoma between 1988 and 2006 at the 2nd Department of Pediatrics of Semmelweis University. All study subjects were Hungarian. Informed consent was requested from the study subjects, or from their parents. The study was conducted according to the principles expressed in the Declaration of Helsinki and was approved by the Hungarian Scientific and Research Ethics Committee of the Medical Research Council (ETT TUKEB; Case No.:8-374/2009-1018EKU 914/PI/08.). Treatment of the patients was based on the COSS-86 and COSS-96 protocols (Figure 4). MTX was used at a dose of 12 g/m2 body surface area, 4–12 times during a protocol. The following clinical parameters were collected retrospectively from patients’ charts: age at diagnosis; gender; classification of patients in risk-groups; serum MTX levels measured at 6, 24, 36, and 48 h subsequent to the application of MTX; lowest serum total protein; white blood cell (WBC) and neutrophil granulocyte numbers; highest values of alanine aminotransferase (ALAT); aspartate aminotransferase (ASAT); and bilirubin and creatinine measured during the first two weeks following the MTX treatment. The adverse drug reactions were graded according to the Common Terminology Criteria for Adverse Events v3.0 (CTCAE).
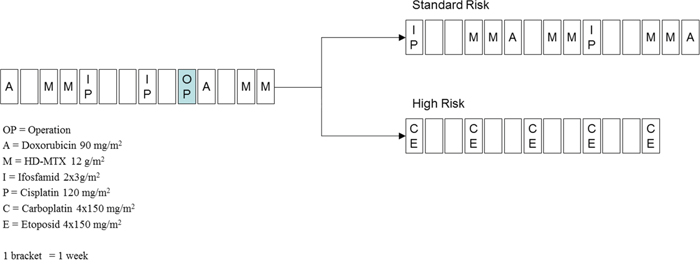
Figure 4: Treatment of osteosarcoma according to the COSS96 protocol. A: doxorubicin 90 mg/m2; C: carboplatin 4 × 150 mg/m2; E: etoposid 4 × 150 mg/m2; I: ifosfamide 2 × 3 g/m2; M: high-dose methotrexate 12 g/m2; OP: date of operation; P: cisplatin 120 mg/m2; 1 bracket = 1 week.
http://www.eortc.be/services/doc/ctc/ctcaev3.pdf
The following target variables were used to describe the pharmacokinetics of MTX: the area under the concentration–time curve (AUC0-48), the peak MTX, and the 48-h MTX levels. Two half-lives of MTX excretion were calculated from the MTX serum levels, according to the two-compartment excretion model. The main characteristics of the patients and the detailed description of the toxicities and pharmacokinetic parameters are shown in Table 3.
Table 3: Main characteristics of the patients and description of the toxicities and pharmacokinetic parameters
Variable |
|
|
|---|---|---|
Patients |
(number) |
59 |
Gender |
Male (number) |
31 |
Female (number) |
28 |
|
Age at diagnosis |
Mean (± SD) (years) |
13.6 (± 3.2) |
Median (range) (years) |
14.3 (5.5–18.5) |
|
Risk groups |
Standard risk (number) |
48 |
High risk (number) |
11 |
|
Hepatotoxicity |
Grade 1-2 (ASAT, ALAT < 200 U/L) (number) |
28 |
Grade 3-4 (ASAT, ALAT > 200 U/L) (number) |
31 |
|
Myelotoxicity |
Grade 1 (WBC > 3.0 × 10⁻⁹/L) (number) |
28 |
Grade 2-4 (WBC < 3.0 × 10⁻⁹/L) (number) |
29 |
|
Myelotoxicity not known (number) |
2 |
|
Peak MTX |
Median (range) (μmol/L) |
1110 (736–1589) |
48-h MTX |
Median (range) (μmol/L) |
0.36 (0.19–1.06) |
AUC0-48 |
Median (range) (μmol/L) |
13680 (8904–20002) |
Tα1/2 |
Median (range) (hours) |
2.52 (1.9–3.5) |
ALAT: Alanine aminotransferase
ASAT: aspartate aminotransferase
AUC 0-48: area under the concentration–time curve 0–48 h
MTX: methotrexate
SD: standard deviation
Tα1/2: first half-life time of MTX excretion
WBC: white blood cells
SNP selection, DNA extraction, and genotyping
DNA was isolated from the blood of children with osteosarcoma using Qiagen isolation kits (QIAmp DNA Blood Maxi Kit or QIAmp DNA Blood Midi Kit, Qiagen, Hilden, Germany). SNPs were selected based on the international literature and prioritized on the basis of their estimated functionality, using the following order: non-synonymous SNPs, SNPs in the promoter and 3′-UTR (3′-untranslated region) region, synonymous SNPs, and intronic SNPs. The minor allele frequency was set at >10%. Our goal was to cover every haplotype block in the gene defined by the Haploview 4.1 software (http://www.broad.mit.edu/mpg/haploview/) (Barrett et al., 2005) with 1 or 2 SNPs. Altogether, 29 single-nucleotide polymorphisms of nine genes (ABCB1, ABCC1, ABCC2, ABCC3, ABCC10, ABCG2, GGH, SLC19A1, and NR1I2) were chosen; detailed information on the selected SNPs are shown in Table 1.
SNPs were genotyped using the GenomeLab SNPstream genotyping platform (Beckman Coulter), according to the manufacturer’s instructions. A detailed description of this procedure can be found in our previous article [31].
Statistical methods
Allele frequencies were calculated by allele counting. The Hardy–Weinberg equilibrium was tested using a χ2 goodness-of-fit test with an acceptable cut-off value of p ≥ 0.05 (https://ihg.gsf.de/cgi-bin/hw/hwa1.pl).
Univariate association analysis was used to determine whether the presence of the variant allele of SNP associates with an increase or decrease in the value of the pharmacokinetic target variable or the frequency of the toxicity. The chi-square (χ2) test was applied. The statistical tests were performed by IBM SPSS statistical software (version 15.1, IBM Corp., Armonk, NY, USA).
BN-BMLA was also used to study the effect of genetic background on pharmacokinetics and toxicity. A Bayesian network is a probabilistic graphical model that represents the conditional dependencies of a set of random variables with a directed acyclic graph. It can efficiently describe the joint probability distribution of the variables. A node of the graph represents a variable, and an edge represents a direct dependency between the corresponding variables. The BN-BMLA method calculates the posterior probability of certain structural features of Bayesian networks (e.g., the presence of an edge between two variables) learned from the data. The current implementation of BN-BMLA deals with only discrete variables, therefore continuous pharmacokinetic covariates must be discretized first, to include them in the BN-BMLA analysis. These variables were discretized based on the median of the values [32], [33]. The posterior probability of the strong relevance of each SNP with respect to the analyzed variable was calculated by the method. A relevant relationship was defined when the probability was >0.3. The applied method was developed by our research team; for further details see the section in the book “Probabilistic graphical models for genetics” [34].
CONCLUSIONS
In our pharmacogenetic analysis, we used three different statistical methods to identify a correlation between the genotype and the clinical data. SNPs ABCB1 rs928256, ABCC3 rs4793665, GGH rs3758149, and NR1I2 rs3814058 were shown to have a relevant effect in both univariate and the multivariate analyses. Pharmacokinetic and pharmacogenetic data would allow developing a population pharmacokinetic model, which could forecast the probable pharmacokinetic parameters individually prior to MTX therapy, thus ensuring an individual medication dosage for each patient.
ACKNOWLEDGMENTS
This study was supported by OTKA (Hungarian Scientific Research Fund): K 115861 (D Erdelyi) and by the János Bolyai Research Scholarship of the Hungarian Academy of Sciences (P. Antal). We are grateful to all of the nurses, doctors, and patients who took part in the study.
CONFLICTS OF INTEREST
The authors declare that they have no conflict of interest statement. None of the authors have any competing financial interests in relation to the work described.
REFERENCES
1. Messerschmitt PJ, Garcia RM, Abdul-Karim FW, Greenfield EM, Getty PJ. Osteosarcoma. J Am Acad Orthop Surg. 2009; 17:515-527.
2. Hegyi M, Semsei AF, Jakab Z, Antal I, Kiss J, Szendroi M, Csoka M, Kovacs G. Good prognosis of localized osteosarcoma in young patients treated with limb-salvage surgery and chemotherapy. Pediatr Blood Cancer. 2011; 57:415-422.
3. Jaffe N, Gorlick R. High-dose methotrexate in osteosarcoma: let the questions surcease—time for final acceptance. J Clin Oncol. 2008; 26:4365-4366.
4. Rozeman LB, Cleton-Jansen AM, Hogendoorn PC. Pathology of primary malignant bone and cartilage tumours. Int Orthop. 2006; 30:437-444.
5. Bruce N. Cronstein JRB. (2000). Methotrexate. In: Michael J. Parnham JB, ed. Milestones in Drug Therapy. (Basel-Boston-Berlin: Birkhauser).
6. Meckley LM, Neumann PJ. Personalized medicine: factors influencing reimbursement. Health policy (Amsterdam, Netherlands). 2010; 94:91-100.
7. Ferrari S, Serra M. An update on chemotherapy for osteosarcoma. Expert opinion on pharmacotherapy. 2015; 16:2727-2736.
8. Krajinovic M, Moghrabi A. Pharmacogenetics of methotrexate. Pharmacogenomics. 2004; 5:819-834.
9. Park JA, Shin HY. Influence of genetic polymorphisms in the folate pathway on toxicity after high-dose methotrexate treatment in pediatric osteosarcoma. Blood research. 2016; 51:50-57.
10. Galivan J, Ryan TJ, Chave K, Rhee M, Yao R, Yin D. Glutamyl hydrolase. pharmacological role and enzymatic characterization. Pharmacol Ther. 2000; 85:207-215.
11. Chave KJ, Ryan TJ, Chmura SE, Galivan J. Identification of single nucleotide polymorphisms in the human gamma-glutamyl hydrolase gene and characterization of promoter polymorphisms. Gene. 2003; 319:167-175.
12. Borst P, Evers R, Kool M, Wijnholds J. A family of drug transporters: the multidrug resistance-associated proteins. J Natl Cancer Inst. 2000; 92:1295-1302.
13. Jamroziak K, Robak T. Pharmacogenomics of MDR1/ABCB1 gene: the influence on risk and clinical outcome of haematological malignancies. Hematology. 2004; 9:91-105.
14. Fanelli M, Hattinger CM, Vella S, Tavanti E, Michelacci F, Gudeman B, Barnett D, Picci P, Serra M. Targeting ABCB1 and ABCC1 with their Specific Inhibitor CBT-1(®) can Overcome Drug Resistance in Osteosarcoma. Current cancer drug targets. 2016; 16:261-274.
15. Bakos E, Homolya L. Portrait of multifaceted transporter, the multidrug resistance-associated protein 1 (MRP1/ABCC1). Pflugers Arch. 2007; 453:621-641.
16. Paulusma CC, Kool M, Bosma PJ, Scheffer GL, ter Borg F, Scheper RJ, Tytgat GN, Borst P, Baas F, Oude Elferink RP. A mutation in the human canalicular multispecific organic anion transporter gene causes the Dubin-Johnson syndrome. Hepatology. 1997; 25:1539-1542.
17. Kool M, van der Linden M, de Haas M, Scheffer GL, de Vree JM, Smith AJ, Jansen G, Peters GJ, Ponne N, Scheper RJ, Elferink RP, Baas F, Borst P. MRP3, an organic anion transporter able to transport anti-cancer drugs. Proc Natl Acad Sci U S A. 1999; 96:6914-6919.
18. Allen JD, Schinkel AH. Multidrug resistance and pharmacological protection mediated by the breast cancer resistance protein (BCRP/ABCG2). Mol Cancer Ther. 2002; 1:427-434.
19. Kerb R, Hoffmeyer S, Brinkmann U. ABC drug transporters: hereditary polymorphisms and pharmacological impact in MDR1, MRP1 and MRP2. Pharmacogenomics. 2001; 2:51-64.
20. Lehmann JM, McKee DD, Watson MA, Willson TM, Moore JT, Kliewer SA. The human orphan nuclear receptor PXR is activated by compounds that regulate CYP3A4 gene expression and cause drug interactions. J Clin Invest. 1998; 102:1016-1023.
21. Zhang J, Kuehl P, Green ED, Touchman JW, Watkins PB, Daly A, Hall SD, Maurel P, Relling M, Brimer C, Yasuda K, Wrighton SA, Hancock M, Kim RB, Strom S, Thummel K, et al. The human pregnane X receptor: genomic structure and identification and functional characterization of natural allelic variants. Pharmacogenetics. 2001; 11:555-572.
22. Dervieux T, Kremer J, Lein DO, Capps R, Barham R, Meyer G, Smith K, Caldwell J, Furst DE. Contribution of common polymorphisms in reduced folate carrier and gamma-glutamylhydrolase to methotrexate polyglutamate levels in patients with rheumatoid arthritis. Pharmacogenetics. 2004; 14:733-739.
23. Schneider E, Ryan TJ. Gamma-glutamyl hydrolase and drug resistance. Clin Chim Acta. 2006; 374:25-32.
24. Cole PD, Kamen BA, Gorlick R, Banerjee D, Smith AK, Magill E, Bertino JR. Effects of overexpression of gamma-Glutamyl hydrolase on methotrexate metabolism and resistance. Cancer Res. 2001; 61:4599-4604.
25. Kimchi-Sarfaty C, Gribar JJ, Gottesman MM. Functional characterization of coding polymorphisms in the human MDR1 gene using a vaccinia virus expression system. Mol Pharmacol. 2002; 62:1-6.
26. Sainz J, Rudolph A, Hein R, Hoffmeister M, Buch S, von Schonfels W, Hampe J, Schafmayer C, Volzke H, Frank B, Brenner H, Forsti A, Hemminki K, Chang-Claude J. Association of genetic polymorphisms in ESR2, HSD17B1, ABCB1, and SHBG genes with colorectal cancer risk. Endocr Relat Cancer. 2011; 18:265-276.
27. Lang T, Hitzl M, Burk O, Mornhinweg E, Keil A, Kerb R, Klein K, Zanger UM, Eichelbaum M, Fromm MF. Genetic polymorphisms in the multidrug resistance-associated protein 3 (ABCC3, MRP3) gene and relationship to its mRNA and protein expression in human liver. Pharmacogenetics. 2004; 14:155-164.
28. de Rotte MC, Bulatovic M, Heijstek MW, Jansen G, Heil SG, van Schaik RH, Wulffraat NM, de Jonge R. ABCB1 and ABCC3 gene polymorphisms are associated with first-year response to methotrexate in juvenile idiopathic arthritis. J Rheumatol. 2012; 39:2032-2040.
29. Whirl-Carrillo M, McDonagh EM, Hebert JM, Gong L, Sangkuhl K, Thorn CF, Altman RB, Klein TE. Pharmacogenomics knowledge for personalized medicine. Clin Pharmacol Ther. 2012; 92:414-417.
30. Karlsen TH, Lie BA, Frey Froslie K, Thorsby E, Broome U, Schrumpf E, Boberg KM. Polymorphisms in the steroid and xenobiotic receptor gene influence survival in primary sclerosing cholangitis. Gastroenterology. 2006; 131:781-787.
31. Semsei AF, Erdelyi DJ, Ungvari I, Csagoly E, Hegyi MZ, Kiszel PS, Lautner-Csorba O, Szabolcs J, Masat P, Fekete G, Falus A, Szalai C, Kovacs GT. ABCC1 polymorphisms in anthracycline-induced cardiotoxicity in childhood acute lymphoblastic leukaemia. Cell biology international. 2012; 36:79-86.
32. Baldwin SA, Fellingham GW. Bayesian Methods for the Analysis of Small Sample Multilevel Data With a Complex Variance Structure. Psychol Methods. 2012.
33. Lautner-Csorba O, Gézsi A, Semsei Á F, Antal P, Erdélyi DJ, Schermann G, Kutszegi N, Csordás K, Hegyi M, Kovács G, Falus A, Szalai C. Candidate gene association study in pediatric acute lymphoblastic leukemia evaluated by Bayesian network based Bayesian multilevel analysis of relevance. BMC Medical Genomics. 2012; 5:42.
34. Antal P MA, Hullam G, Hajos G, Gezsi A, Szalai C, Falus A. (2014). Bayesian, Systems-based, Multilevel Analysis of Associations for Complex Phenotypes: from Interpretation to Decision. In: Christine Sinoquet RM, ed. Probabilistic graphical models for genetics. (New York: Oxford University Press), pp. 319-360.