
Introduction
Colorectal cancer (CRC) arises because of the accumulation of epigenetic and genetic alterations [1-3]. Gene mutations of KRAS, APC, and TP53 are well-known genetic alterations, which were demonstrated in the model of adenoma-carcinoma sequence [4]. Recent exome sequencing studies of CRC revealed the involvement of somatic mutation of other genes, e.g., SOX9, SMAD4, PIK3CA, ARID1A, and NRAS [5-7]. According to a report by the Cancer Genome Atlas (TCGA), CRC is classified into hypermutated and non-hypermutated CRC, and hypermutated CRC exhibits frequent gene mutations such as BRAF and MSH6, microsatellite instability, and promoter methylation of MLH1 [6]. Aberrant DNA methylation of promoter CpG islands has been reported as one of the most important epigenomic alterations in CRC [8, 9]. The CRC subtype with frequent aberrant methylation, so-called CpG island methylator phenotype (CIMP) [10, 11], overlaps with the hypermutated CRC [6].
We and others previously performed epigenotyping of CRC, using comprehensive and quantitative DNA methylation data [12-14]. Two groups of methylation marker genes were established to clearly classify CRC into three distinct epigenotypes [12]. High-methylation epigenotype (or CIMP) showed methylation of both Group-1 and Group-2 markers, while intermediate-methylation epigenotype showed methylation of Group-2, but not of Group-1 markers, and low-methylation epigenotype showed methylation of neither Group-1 nor Group-2 markers. High- and intermediate-methylation epigenotypes strongly correlated with BRAF and KRAS mutations, respectively, and low-methylation epigenotype correlated with the absence of these oncogene mutations, suggesting the existence of at least three distinct pathways in the genesis of CRC.
Familial adenomatous polyposis (FAP) and Lynch syndrome (also known as hereditary nonpolyposis CRC) are the two major autosomal dominant forms of heritable CRC, which accounts for 5-15% of all CRC cases [15-17]. Lynch syndrome can be caused by mutations in the mismatch repair genes, e.g., MLH1, MSH2, MSH6, and PMS2, and is inherited in an autosomal dominant manner. For FAP, APC germline mutation is known to be the cause for colonic polyps. APC is a tumor suppressor gene that is responsible for regulating the Wnt signaling pathway; while one allele was inactivated by germline mutation, the other allele is involved with loss of heterozygosity at 50-59% or another mutation at 33% [18, 19]. Frequent mutations of KRAS (36-44%) [20, 21] and TP53 (31-40%) [22, 23] were reportedly involved in FAP cancer, while mutation frequencies of those in adenomas are rather low, 6-36% for KRAS [20, 24, 25] and 5-38% for TP53 [22, 23, 26]. In spite of the extremely high risk of cancer incidence in FAP, the molecular basis of tumorigenesis in FAP has not been fully investigated. The ‘second hit’ against APC was not necessarily identified in APC-mutation(+) FAP tumors [19]. Approximately 20% of patients with FAP do not possess APC germline mutation, and responsible mutations are yet to be identified [27]. There are only few reports about aberrant DNA methylation in FAP [24], and stratification of FAP tumors into distinct molecular subtype(s) has yet to be investigated.
In this study, we analyzed epigenetic and genetic features of FAP tumors. Using quantitative DNA methylation data, we determined that there are at least two molecular subtypes in FAP tumors, which resembled sporadic CRC: intermediate-methylation epigenotype with KRAS mutation and low-methylation epigenotype with no oncogene mutation. While some patients showed a single epigenotype in all tumors throughout the colon, tumors with two distinct epigenotypes developed within a family with the same APC mutation or even within one patient. These results indicate that there are at least two distinct molecular subtypes in FAP tumors, resembling sporadic CRC and independent from APC germline mutation status. Methylation accumulation might be causally affected by environmental factors, e.g., proximal location and aging.
Results
Mutation analysis of BRAF and KRAS and immunostaining of CTNNB1 and TP53
While KRAS mutations were frequently detected in 46 (41%) out of 112 FAP tumor samples, no sample was BRAF-mutation(+) (Figure 1). We performed TP53 and CTNNB1 immunostaining for 86 samples, 14 (16%) were regarded as TP53-mutation(+), and 46 (53%) were regarded as CTNNB1-activation(+).
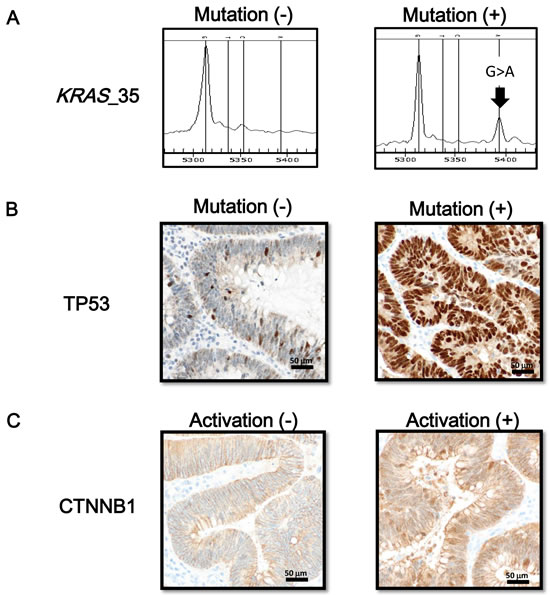
Figure 1: Oncogene mutation status and immunostaining of TP53 and CTNNB1. A. Mutation at nucleotide 35 of the KRAS gene (G > A) is representatively shown. BRAF mutation was not detected in any FAP tumor samples. B. Immunostaining of TP53. When nuclear staining was present in tumor cells, TP53 mutation was considered as positive. C. Immunostaining of CTNNB1. A case with cellular membrane staining, i.e. CTNNB1-activation(-) (left), and a case with nuclear and cytoplasmic staining, i.e. CTNNB1-activation(+) (right), are representatively shown.
Quantitative DNA methylation analysis
Using quantitative methylation data obtained from pyrosequencing, we performed hierarchical clustering on 127 colorectal samples of FAP cases including 112 malignant and 15 benign mucosa samples (Figure 2A). These samples were clearly classified into clusters: Cluster-A (n = 24) with higher methylation and Cluster-C (n = 70) with lower methylation. The 24 tumor samples in Cluster-A significantly correlated with the presence of KRAS mutation (P = 1×10⁻⁴), and proximal location (P = 3×10⁻⁶) (Figure 2A). To evaluate methylation epigenotype of this cluster by comparison with the previously established methylation epigenotypes of sporadic CRC [12, 28], their methylation status was examined with 45 sporadic CRC samples, including 15 high-, 15 intermediate-, and 15 low-methylation epigenotypes, which had been previously evaluated [12]. Hierarchical clustering analysis revealed that all 24 tumor samples in Cluster-A were clustered into intermediate-methylation epigenotype (Figure 2B). The 70 malignant and 15 benign mucosa samples in Cluster-C significantly correlated with the absence of KRAS mutation and distal location (Figure 2A). These were also compared with the 45 sporadic CRC samples, revealing that all 85 samples were clustered into the low-methylation epigenotype (Figure 2C).
Adenocarcinoma samples were detected in both Cluster-A and Cluster-C, without statistical significance (3/24 vs. 10/70, P = 0.5). There were 18 samples in Cluster-B among the 127 FAP samples (Figure 2A), and the hierarchical clustering analysis with the 45 CRC samples showed that two were classified into intermediate-methylation epigenotype and 16 were low-methylation epigenotype.
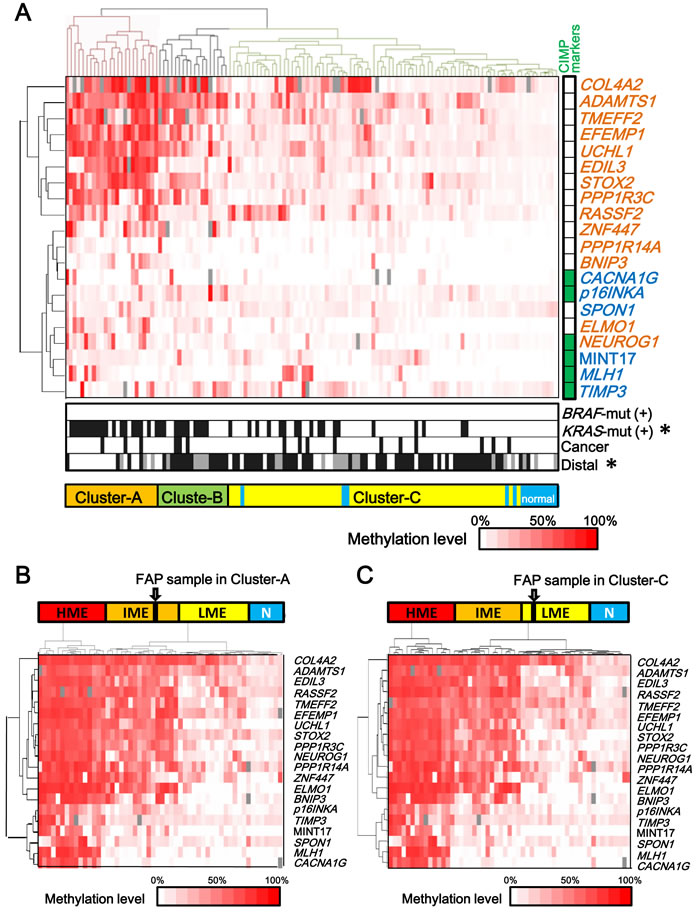
Figure 2: Two epigenotypes of FAP tumors. A. Methylation levels of 6 Group-1 markers (blue) including p16INKA, TIMP3, SPON1, MINT17, MLH1, and CACNA1G and 14 Group-2 markers (orange) including ADAMTS1, TMEFF2, STOX2, COLA4A2, EDIL3, UCHL1, RASSF2, ELMO1, PPP1R3C, PPP1R14A, BNIP3, ZNF447, and NEUROG1 are shown for each tumor or normal sample of FAP cases, and unsupervised hierarchical clustering analysis was performed. Methylation was quantitatively analyzed by pyrosequencing and shown in color scale, or by grey box when not analyzed. FAP samples were clearly classified into clusters: Cluster-A with higher methylation and Cluster-C with lower methylation. The 24 tumors in Cluster-A showed high methylation of Group-2 markers, but low methylation of Group-1 markers, and correlated with KRAS-mutation(+) (P = 1×10⁻⁴). The 70 tumors and 15 normal samples in Cluster-C showed low methylation of both Group-1 and Group-2 markers. CIMP markers: Classical CIMP markers [11, 13, 29, 30] are shown in green. BRAF-mut(+) or KRAS-mut(+): Samples positive for BRAF-mutation or KRAS-mutation are shown in black. Cancer: Cancer is shown in black and adenoma in white. Distal: Tumors in the distal colon are shown in black, those in the proximal colon in white, and those in an unknown location in grey. B. and C. Hierarchical clustering of FAP sample with previously analyzed sporadic CRC samples. The methylation epigenotype of each FAP sample was evaluated by unsupervised hierarchical clustering analysis with 45 sporadic CRC samples including 15 high-, 15 intermediate-, and 15 low-methylation epigenotypes. The methylation epigenotype of the 24 tumors in Cluster-A was considered as the intermediate-methylation epigenotype by hierarchical clustering analysis with 45 CRC samples (B). The methylation epigenotype of the 85 samples in Cluster-C was considered as the low-methylation epigenotype (C). Cluster-A and Cluster-C both included cancer samples, without a significant difference in frequency (3/24 vs. 10/70, P = 0.5). Two of the 18 samples in Cluster-B were clustered with intermediate-methylation CRC samples, whereas the other 16 samples in Cluster-B were clustered with low-methylation CRC samples.
None of the FAP tumors showed high-methylation epigenotype. Considering that no BRAF-mutation was detected, it suggested that high-methylation epigenotype with BRAF mutation is not involved in tumorigenesis of FAP tumor. Six classical CIMP markers proposed by Issa et al. or Laird et al., i.e. CACNA1G (also known as MINT31), p16INKA, NEUROG1, MINT17, MLH1, and TIMP3 [11, 13, 29, 30], were analyzed in this study, and all of these markers were mostly unmethylated in FAP tumors, indicating CIMP(-).
To confirm that the difference of intermediate- and low-methylation epigenotypes in FAP tumors was due to differences in the methylation levels in Group-2 markers, which is feature of sporadic CRC [12, 28], their methylation levels in intermediate- and low-methylation tumors were compared (Figure 3). While all Group-1 markers (≅ CIMP markers) showed low methylation levels in both intermediate- and low-methylation tumors, all Group-2 markers showed significantly higher methylation levels in intermediate-methylation samples when compared to the low-methylation samples.
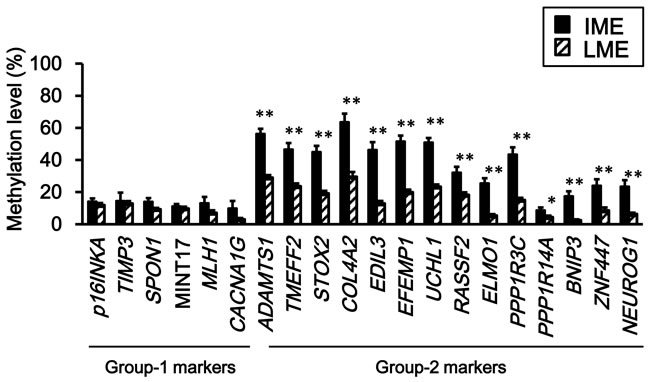
Figure 3: Comparison of methylation levels between intermediate- and low-methylation epigenotypes. Methylation levels are represented by means ± standard errors. IME, intermediate-methylation epigenotype. LME, low-methylation epigenotype. All Group-2 markers showed significantly higher methylation levels in intermediate-methylation samples than in low-methylation samples (*P < 0.05, **P < 0.01, Student’s t-test). Methylation levels of the six Group-1 markers were low in both intermediate- and low-methylation samples, and there was no significant difference between the two epigenotypes.
Comparison between adenoma and cancer
Next, methylation levels of individual genes were compared between adenoma and cancer. None of the genes showed a significant increase of methylation level in cancer when compared with adenoma (Figure 4).
The frequency of KRAS-mutation(+) did not increase significantly in cancer compared with that in adenoma and a significant correlation between intermediate-methylation and KRAS-mutation(+) was already detected at the adenoma stage (Figure 5A). As detected in intermediate-methylation sporadic CRC [12, 28, 31], it suggested that methylation accumulation and KRAS-mutation(+) are mostly completed by the adenoma stage.
The frequency of TP53-mutation(+) increased in cancer compared with that in adenoma (P = 2×10⁻⁵). Low-methylation cancer showed significantly higher frequency of TP53-mutation(+) than low-methylation adenoma (7/10 vs. 5/59, P = 7×10⁻⁵) (Figure 5B).
For activation of CTNNB1, 33 (56%) of 59 adenoma samples were CTNNB1-activation(+) whereas seven (70%) of 10 cancer samples were CTNNB1-activation(+) in low-methylation FAP samples, showing frequent activation in both adenoma and cancer with no significant difference (P = 0.5) (Figure 5C).
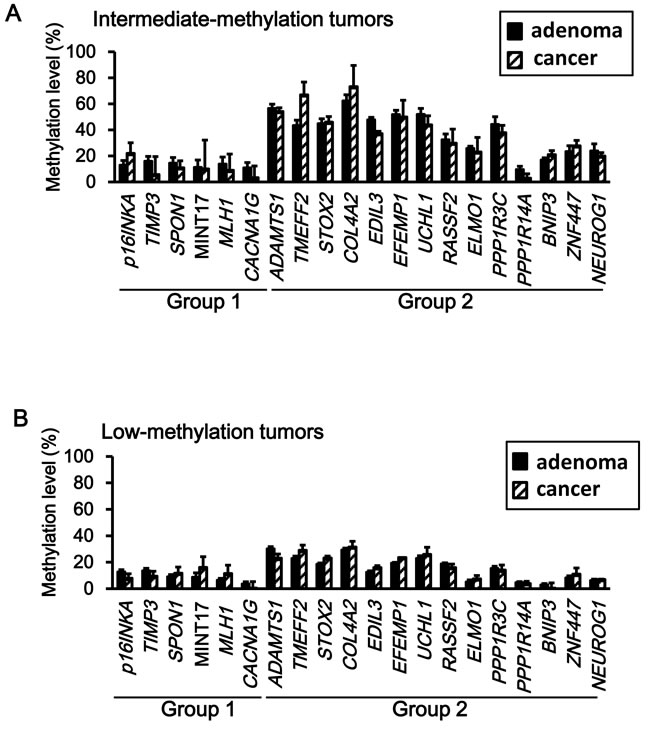
Figure 4: Comparison of methylation levels between adenoma and cancer. Neither intermediate-methylation tumors (A) nor low-methylation tumors (B) did show a significant increase of the methylation level from adenoma to cancer samples (P < 0.05, Student’s t-test).
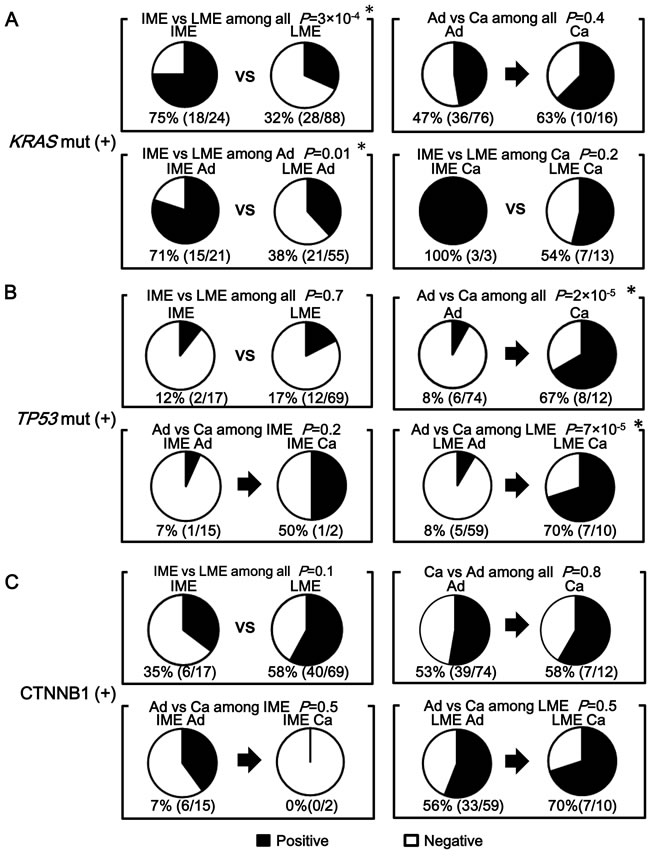
Figure 5: Comparison of KRAS mutation, TP53 mutation, and CTNNB1 activation between adenoma and cancer, and between low- and intermediate-methylation epigenotypes. A. The frequency of KRAS-mutation(+). A significant correlation between intermediate-methylation and KRAS mutation was detected when analyzing all the FAP tumors (P = 3×10⁻⁴). This correlation was aleady detected at the adenoma stage (P = 0.01). The frequency of KRAS-mutation(+) did not significantly increase from adenoma to cancer (P = 0.4). B. The frequency of TP53 mutation. The frequency of TP53 mutation significantly increased in cancer compared with adenoma (P = 2×10⁻⁵). Among low-methylation tumors, cancer showed significantly higher frequency of TP53 mutation compared with adenoma (P = 7×10⁻⁵). C. The frequency of CTNNB1-activation(+). Frequent CTNNB1 activation was observed in both adenoma (39/74) and cancer (7/12) with no significant difference (P = 0.8). Among low-methylation tumors, CTNNB1 activation was frequently observed in both adenoma (33/59) and cancer (7/10) with no significant difference (P = 0.5).
Methylation epigenotypes in each FAP case
Among the 14 FAP cases, > 15 tumor samples were analyzed in three cases, Case-1A, Case-2, and Case-3. When we analyzed methylation levels of tumors in these FAP cases individually, methylation patterns of tumors showed interesting tendencies (Figure 6).
First, while all the tumors in Case-1A and Case-2 showed low-methylation epigenotype, Case-3 developed both low- and intermediate-methylation tumors. If we compare Case-1A with two other patients from the same family (Cases-1B and 1C), the two patients also developed both low- and intermediate-methylation tumors, although only nine and eight tumors were analyzed (Figure 6). A single FAP patient did not necessarily develop a single methylation epigenotype.
Secondly, the two methylation epigenotypes could occur independently of APC mutation status. Case-3 showed both low- and intermediate-methylation tumors within a single patient. Interestingly, intermediate-methylation epigenotype significantly correlated with KRAS mutation (10 of 12, compared with two of seven in low-methylation, P = 0.03).
Thirdly, the methylation status might perhaps correlate with tumor location. Proximal location was significantly associated with intermediate-methylation epigenotype in Case-3 (P = 0.009). Although the number of tumors was small, this significant association was also detected in Case-1B (P = 0.007)
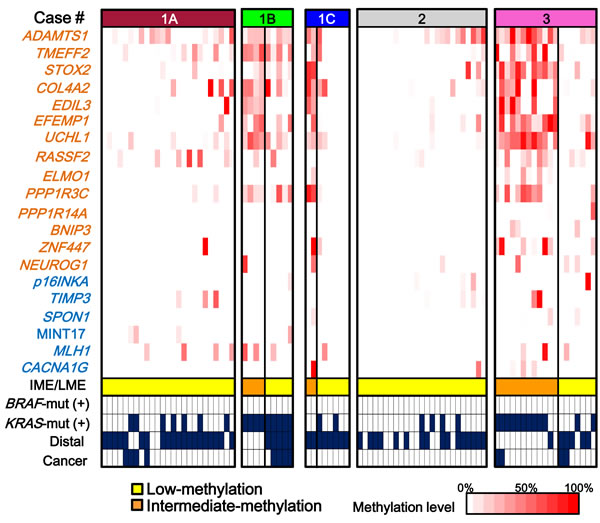
Figure 6: Methylation patterns of tumors in each patient. Case-1A and Case-2 showed single epigenotype in all the tumors. Case-1B, Case-1C, and Case-3 showed two distinct epigenotypes in a single patient. Case-1A, Case-1B and Case-1C were from the same family and possessed the same APC germline mutation (L540X). Nevertheless, Case-1B and Case-1C showed two epigenotypes and Case-1A showed low-methylation epigenotype only throughout the colon. For Case-3, intermediate-methylation tumors were preferentially observed with KRAS mutation (P = 0.03) and in the proximal colon (P = 0.009). For Case-1B, a significant association was observed between intermediate-methylation epigenotype and proximal location (P = 0.007).
Comparison using linear single regression
To evaluate the possible association of methylation accumulation with tumor location and with age, methylation levels and these factors as well as KRAS mutation status were analyzed by linear single regression model using all samples (Figure 7). Eight Group-2 markers showed a significant correlation between higher methylation level and KRAS-mutation(+), while none of Group-1 markers did (Figure 7A and Supplementary Figure S1). Five of Group-2 markers, EDIL3, EFEMP1, UCHL1, ELMO1, and BNIP3, showed a significant correlation between higher methylation level and proximal location, while none of Group-1 markers did (Figure 7B and Supplementary Figure S2). Twelve of Group-2 markers showed a significant correlation between higher methylation level and age, while none of Group-1 markers did (Figure 7C and Supplementary Figure S3).
Discussion
In this study, we stratified FAP tumors into distinct molecular subtypes. Quantitative DNA methylation analysis of Group-1 and Group-2 markers indicated that there are at least two subtypes in FAP tumors: low- and intermediate-methylation epigenotypes. As observed in sporadic CRC and adenoma, intermediate-methylation epigenotype is accompanied with KRAS mutation and low-methylation epigenotype is accompanied with no oncogene mutation. These subtypes might be formed independently from APC germline mutation status, and both subtypes could develop malignant tumors.
There have been few studies reporting aberrant DNA methylation in FAP tumors. Wynter et al. analyzed eight methylation markers (MINT1, MINT2, MINT12, and MINT31 markers, and promoter regions of HPP1, MGMT, p14, and p16) in sporadic and FAP adenoma samples and suggested that FAP adenoma might develop through non-CIMP pathway [24]. Whereas CIMP(+)/high-methylation tumors could be distinguished from CIMP(-) tumors using the classic CIMP markers (≅Group-1 markers), two groups of markers should be necessary to distinguish three subtypes, including low- and intermediate-methylation epigenotypes in CIMP(-) tumors [12-14]. In the present study, we analyzed both Group-1 and Group-2 markers quantitatively and clearly demonstrated that, while high-methylation epigenotype with BRAF mutation is not involved, there are at least two molecular subtypes of FAP tumors: low- and intermediate-methylation epigenotypes. The hierarchical clustering analysis using FAP tumor samples (Figure 2), however, showed three clusters: Cluster-A, Cluster-B, and Cluster-C. Although Cluster-A is considered equivalent to the intermediate-methylation epigenotype and Cluster-C equivalent to the low-methylation epigenotype in sporadic CRC, further studies using more samples and methylation markers are necessary to determine if FAP tumors consist of these two epigenotypes only or if there are other distinct epigenotypes (e.g., Cluster-B), and whether there are any specific and suitable methylation markers to stratify FAP tumors.
KRAS mutation has been frequently detected [20, 21, 24, 25] in adenoma and cancer in FAP patients. In agreement with these previous reports, KRAS mutation was frequently detected in 46 (41%) out of 112 tumor samples. However, KRAS mutation was preferentially detected in intermediate-methylation epigenotype (P = 3×10⁻⁴) (Figure 5A). The frequency of KRAS mutation was not different between adenoma and cancer. Methylation levels did not significantly increase from adenoma to cancer either, suggesting that methylation accumulation to form intermediate-methylation epigenotype and KRAS mutation was mostly completed by the adenoma stage, which resembles sporadic colorectal tumors [28, 31].
On the other hand, the frequency of TP53 mutation was not different between intermediate- and low-methylation epigenotypes, but the frequency of TP53-mutation increased in cancer when compared to that in adenoma (P = 2×10⁻⁵) (Figure 5B). TP53 mutation is necessary during cancer development from adenoma, in agreement with the previously reported concept of adenoma-carcinoma sequence [4, 28, 32]. Our results suggest that KRAS mutation occurs preferentially in intermediate-methylation epigenotype and by adenoma stage, and that TP53 mutation occurs at later stages.
Similarity to sporadic CRC was also detected in CTNNB1 activation. CTNNB1 activation was frequently observed in both intermediate- and low-methylation epigenotypes without statistical significance (P = 0.1), and its frequency did not increase from adenoma to cancer (P = 0.8) (Figure 5C). This is also in agreement with the adenoma-carcinoma sequence [4, 28, 32].
In addition to the presence of two methylation epigenotypes in FAP tumors, this study revealed that these two types of tumors could be developed within a family with the same APC mutation or even within a single FAP patient (Figure 6). Cases-1A, 1B, and 1C were from the same family and possessed the same APC germline mutation (L540X) (Table 1). Low-methylation epigenotype was formed throughout the colon in Case-1A, whereas both epigenotypes of tumors were detected in Cases-1B and 1C. The two distinct epigenotypes were also observed in Case-3. These results suggest that the mechanisms underlying the formation of these distinct molecular subtypes should be independent from APC germline mutation status.
Table 1: Clinical characteristics of FAP patients
Case # |
Sex |
Age (years) |
polyps > 100 |
mutation of APC |
# of analyzed adenoma |
# of analyzed cancer |
# of tumors in each epigenotype |
|
LME |
IME |
|||||||
1A |
Male |
29 |
Yes |
L540X |
21 |
4 |
25 |
0 |
1B |
Female |
50 |
Yes |
L540X |
5 |
4 |
5 |
4 |
1C |
Male |
25 |
Yes |
L540X |
8 |
0 |
6 |
2 |
2 |
Male |
20 |
Yes |
R564X |
25 |
0 |
25 |
0 |
3 |
Female |
50 |
Yes |
R216X |
15 |
4 |
7 |
12 |
4 |
Male |
36 |
Yes |
R499X |
11 |
0 |
9 |
2 |
5 |
Female |
38 |
Yes |
V1414X |
5 |
0 |
4 |
1 |
6 |
Female |
59 |
- |
R805X |
2 |
1 |
2 |
1 |
7 |
Female |
55 |
Yes |
H1329X |
1 |
1 |
2 |
0 |
8 |
Male |
54 |
Yes |
S1163X |
1 |
0 |
1 |
0 |
9 |
Male |
58 |
Yes |
R332X |
1 |
0 |
0 |
1 |
10 |
Male |
16 |
Yes |
L1385X |
0 |
1 |
1 |
0 |
11 |
Female |
32 |
Yes |
S338X |
0 |
1 |
1 |
0 |
12 |
Female |
71 |
- |
R1114X |
1 |
0 |
0 |
1 |
Case-1A, Case-1B and Case-1C were from the same family, and possessed the same APC germline mutation. LME, low-methylation epigenotype. IME, intermediate-methylation epigenotype.
Whether known environmental factors of methylation accumulation in sporadic CRC could be associated with methylation in FAP tumors remains to be clarified. Aging is known as one of the factors causing aberrant promoter methylation e.g., ER and c-FOS [33, 34], and aberrant methylation was reported to be preferentially accumulated in the proximal colon [35, 36]. While Group-1 marker methylation was not involved in the development of FAP tumors, 12/14 Group-2 markers showed significant correlation between higher methylation level and older age in the tumorigenesis of FAP (Figure 7). As for location, higher methylation level significantly correlated with proximal location in 5/14 Group-2 markers. These results may suggest that methylation accumulation might occur preferentially in relation to proximal location and older age, but further investigation using more FAP cases and samples is necessary to clarify the contribution of environmental factors to methylation accumulation in patients with FAP.
In summary, there are at least two molecular subtypes in FAP tumors: low- and intermediate-methylation epigenotypes. These subtypes are independent from APC germline mutation status, and the both subtypes could develop malignant tumors. Similar to sporadic CRC, KRAS mutation significantly correlates with intermediate-methylation epigenotype. CTNNB1 activation and KRAS mutation occur at an earlier stage of adenoma formation, and TP53 occurs at a later stage of FAP tumorigenesis from adenoma to cancer.
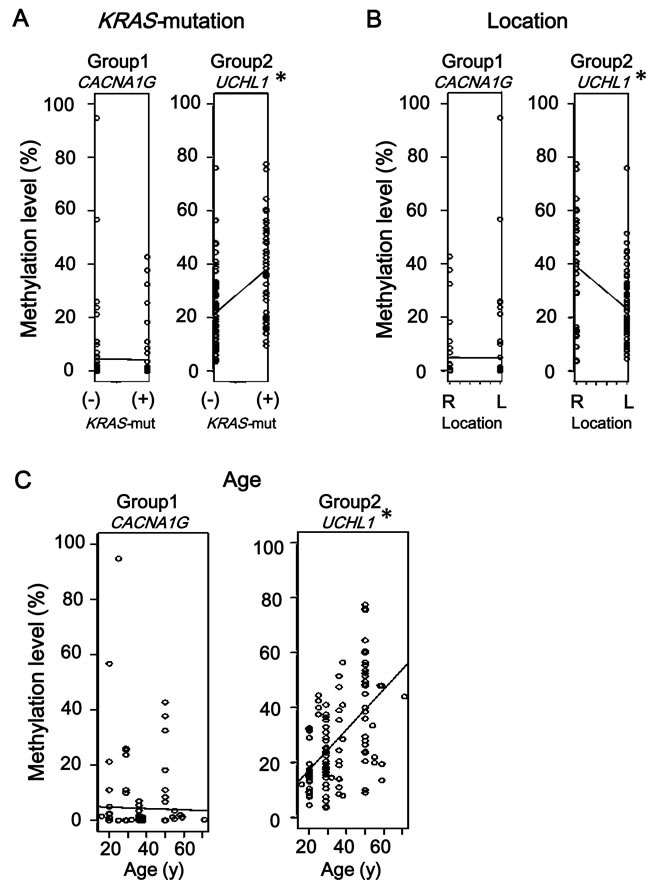
Figure 7: Comparison using linear single regression model. A. Association of methylation accumulation with KRAS-mutation. Eight of 14 Group-2 markers, e.g., UCHL1, showed significant correlation between higher methylation level and KRAS-mutation(+) status, none of Group-1 markers did, e.g., CACNA1G. (See Supplementary Figure S1) B. Association of methylation accumulation with location. Five of 14 Group-2 markers, e.g., UCHL1, showed significant correlation between higher methylation level and proximal location, while none of Group-1 markers did, e.g., CACNA1G. (See Supplementary Figure S2) C. Association of methylation accumulation with age. Twelve of 14 Group-2 markers, e.g., UCHL1, showed a significant correlation between higher methylation level and age, while none of Group-1 markers did, e.g. CACNA1G. (See Supplementary Figure S3) Since six Group-1 markers and 14 Group-2 markers were evaluated for each factor, P-value < 0.008 (i.e., 0.05/6) and < 0.004 (i.e., 0.05/14) were considered significant, respectively, instead of P < 0.05 (*).
Materials and Methods
Clinical samples
In total, 127 colorectal samples (96 adenoma, 16 cancer, and 15 benign mucosa samples) were obtained from 14 patients with FAP who underwent operation at Chiba University Hospital and Saitama Cancer Center with written informed consents (Table 1). Cases-1A, 1B and 1C were from the same family. Colorectal samples of Cases-1A, 1B, 1C, Case-2, and Case-3 were fixed with 10% formalin and then embedded in paraffin. Samples of Case-4 through Case-12 were frozen immediately after surgical resection and kept at -80 °C until DNA extraction. The formalin-fixed paraffin-embedded (FFPE) samples were cut in 10-μm-thick sections using a paraffin sectioning method, and the frozen samples were cut into 20-μm-thick sections. When necessary, they underwent laser microdissection using Leica CM1860 cryostat (Life Technologies, Carlsbad, CA) to enrich tumor cells. DNA was extracted using QIAamp DNA FFPE Tissue Kit (Qiagen, Hilden, Germany) or QIAamp DNA Mini Kit (Qiagen). This study was approved by Ethics Committee in Chiba University and Saitama Cancer Center.
Histological evaluation
The FFPE specimens were cut in 4-μm thick sections and stained with hematoxylin and eosin. Two experienced pathologists performed histopathological examination, and the tumor cell content was confirmed to be > 70%. When the content was < 70%, laser microdissection was performed to enrich tumor cells. In this study, carcinoma in situ and invasive carcinoma were considered as cancer.
Bisulfite treatment
Bisulfite conversion of 500 ng of genomic DNA from each tissue sample was performed using Zymo EZ DNA Methylation Kit (Zymo Research, Irvine, CA), and the DNA was eluted in 80 μL of 10 mEq Tris buffer. By bisulfite treatment, unmethylated cytosine is converted to uracil, i.e., recognized as thymine (T) after PCR reaction, but methylated cytosine is not converted, i.e. cytosine (C) after PCR reaction. Unmethylated DNA and methylated DNA are therefore distinguishable by detecting the difference of T and C in the sequence after bisulfite treatment.
Methylation control samples (0%, 25%, 50%, 75% and 100%) were prepared as previously described [12]. Briefly, human peripheral lymphocyte DNA was amplified using GenomiPhi v2 DNA amplification kit (GE Healthcare Life-Science, Buckinghamshire, England). The amplified DNA was not methylated in any CpG sites, and was used as unmethylated (0%) control. The amplified DNA was methylated by SssI methylase and used as fully methylated (100%) control. Other methylation control samples (25%, 50%, and 75%) were prepared by mixing 0% and 100% samples at a ratio of 3:1, 1:1 and 1:3. These control samples were also treated with bisulfite in the same manner.
Methylation analysis
Methylation levels were quantitatively analyzed by pyrosequencing on the PyroMark Q96 (Qiagen) using six Group-1 markers (p16INKA, TIMP3, SPON1, MINT17, MLH1 and CACNA1G) and 14 Group-2 markers (ADAMTS1, TMEFF2, STOX2, COLA4A2, EDIL3, UCHL1, RASSF2, ELMO1, PPP1R3C, PPP1R14A, BNIP3, ZNF447, and NEUROG1) as previously reported [12, 28]. Primer sequences of the methylation markers are shown in supplementary Table 1. Briefly, the biotinylated PCR product was bound to Streptavidin Sepharose High Performance (Amersham Biosciences, Uppsala, Sweden), washed, and denatured using a 0.2 mol/L NaOH solution. After addition of 0.3 µmol/L sequencing primer to the single-stranded PCR product, pyrosequencing was carried out according to the manufacturer’s instructions. By using methylation control samples, it was confirmed in each pyrosequencing assay that methylation analysis for the 20 markers was highly quantitative. Primer sequences and PCR conditions are available in our previous study [26].
Mutation analysis
Mutations of BRAF (nucleotide 1799) and KRAS (nucleotide 34, 35, 37 and 38) were analyzed by genotyping assay on the MassARRAY platform as previously described [31]. PCR and extension primers for these mutations were previously designed using MassARRAY Assay Design 3.0 software (Sequenom, San Diego, CA) and applying default single base extension settings and default parameters. DNA was amplified by PCR and a single base extension reaction was performed using a custom mixture of nucleotides and extension primers that hybridized immediately adjacent to the mutations. Reaction products were transferred to a SpectroCHIP (Sequenom) and mass difference was analyzed using MALDI-TOF mass spectrometry to identify the extended base at the possible mutation site (Figure 1A).
APC mutations were analyzed by targeted sequencing of all 18 exons of APC. By using Ion AmpliSeq™ Library Kit 2.0 (Thermo Fisher Scientific, Waltham, MA) and Ion Xpress™ Barcode Adapter 1-16 Kit (Thermo Fisher Scientific), an amplicon library of the targeted exons was prepared with an Ion AmpliSeq™ Custom Panel (Solution ID: IAD45865_089, Thermo Fisher Scientific) designed with Ion AmpliSeq™ Designer (www.ampliseq.com) for 18 exons of the APC gene. The custom panel with 90 primer sets was prepared (Supplementary Table S2), and the coverage rate was 99.42%. After 100 ng of each genomic DNA sample was amplified using Ion AmpliSeq™ HiFi Master Mix (Thermo Fisher Scientific), amplicon libraries were constructed according to the manufacturers’ instructions. After the emulsion PCR was carried out using the Ion OneTouch™2 System and Ion PGM™ Template OT2 200 Kit (Thermo Fisher Scientific), sequencing was performed with an Ion Torrent Personal Genome Machine (PGM) system using the Ion PGM™ Sequencing 200 Kit v2 and Ion 316™ Chip v2 (Thermo Fisher Scientific). The sequence data were processed with standard Ion Reporter™ Software (Thermo Fisher Scientific), a suite of bioinformatics tools, mapping to human genome sequence (build GRCh37/hg19).
Immunohistochemistry
Immunostaining for TP53 was conducted using DO-7 anti-mouse monoclonal antibody (Santa Cruz Biotechnology, Santa Cruz, CA) as previously described [12] and samples with nuclear staining were considered TP53-IHC(+) and, thus, designated as TP53-mutation(+). Immunostaining for CTNNB1 was performed using anti-mouse monoclonal antibody (BD Transduction Laboratories) as previously described [28, 37]. Activation of the WNT signaling pathway, e.g., APC inactivation [38], resulted in the accumulation of CTNNB1 in the cytoplasm and/or nucleus. CTNNB1 activation was considered positive, (i) if nuclear staining was positive in at least one tumor cell per high-power field, or (ii) if cytoplasmic staining was positive in > 25% of tumor cells [39].
Statistical analysis
Differences in methylation levels of each marker were analyzed using Student’s t-test. Mutation status and tumor location were compared between intermediate- and low-methylation epigenotypes, or between adenoma and carcinoma using Fisher’s exact test. These statistical analyses were performed using SPSS, ver. 11.0 (SPSS Inc., Chicago, IL). Unless otherwise specified, P values < 0.05 were considered to denote statistical significance. Unsupervised 2-way hierarchical clustering was carried out based on the City-block distance and the complete linkage-clustering algorithm using Cluster 3.0 software. The heatmap was drawn using Java Tree View software. Correlation of methylation level of each marker with KRAS mutation, tumor location, and age was evaluated by linear single regression of R software (https://www.r-project.org/).
Acknowledgments
We thank Hiromi Tanaka, Aki Komatsu, and Kaoru Nakano for technical assistance, and Editage (www.editage.jp) for English language editing. This study was supported by the CREST program (AK) and Practical Research for Innovative Cancer Control program (AK) from Japan Agency for Medical Research and Development, grants from Surgery Research Fund (AK) and Daiichi Sankyo Foundation of Life Science (AK), and Grant-in-Aid #15H06098 (KT) from Japan Society for the Promotion of Science. All authors have no potential conflict of interest to disclose.
CONFLICTS OF INTEREST
The authors declare no conflicts of interest.
Editorial note
This paper has been accepted based in part on peer-review conducted by another journal and the authors’ response and revisions as well as expedited peer-review in Oncotarget.
References
1. Grady WM, Carethers JM. Genomic and epigenetic instability in colorectal cancer pathogenesis. Gastroenterology 2008; 135: 1079-1099.
2. Jones PA, Baylin SB. The epigenomics of cancer. Cell 2007; 128: 683-692.
3. Kaneda A, Feinberg AP. Loss of imprinting of IGF2: a common epigenetic modifier of intestinal tumor risk. Cancer Res 2005; 65: 11236-11240.
4. Vogelstein B, Fearon ER, Hamilton SR, Kern SE, Preisinger AC, Leppert M, Nakamura Y, White R, Smits AM, Bos JL. Genetic alterations during colorectal-tumor development. N Engl J Med 1988; 319: 525-532.
5. Greenman C, Stephens P, Smith R, Dalgliesh GL, Hunter C, Bignell G, Davies H, Teague J, Butler A, Stevens C, Edkins S, O’Meara S, Vastrik I, et al. Patterns of somatic mutation in human cancer genomes. Nature 2007; 446: 153-158.
6. The Cancer Genome Atlas Network. Comprehensive molecular characterization of human colon and rectal cancer. Nature 2012; 487: 330-337.
7. Sjöblom T, Jones S, Wood LD, Parsons DW, Lin J, Barber TD, Mandelker D, Leary RJ, Ptak J, Silliman N, Szabo S, Buckhaults P, Farrell C, et al. The consensus coding sequences of human breast and colorectal cancers. Science 2006; 314: 268-274.
8. Lao VV, Grady WM. Epigenetics and colorectal cancer. Nat Rev Gastroenterol Hepatol 2011; 8: 686-700.
9. Irizarry RA, Ladd-Acosta C, Wen B, Wu Z, Montano C, Onyango P, Cui H, Gabo K, Rongione M, Webster M, Ji H, Potash JB, Sabunciyan S, et al. The human colon cancer methylome shows similar hypo- and hypermethylation at conserved tissue-specific CpG island shores. Nat Genet 2009; 41: 178-186.
10. Kaneda A, Matsusaka K, Sakai E, Funata S. DNA methylation accumulation and its predetermination of future cancer phenotypes. J Biochem 2014; 156: 63-72.
11. Toyota M, Ahuja N, Ohe-Toyota M, Herman JG, Baylin SB, Issa JP. CpG island methylator phenotype in colorectal cancer. Proc Natl Acad Sci U S A 1999; 96: 8681-8686.
12. Yagi K, Akagi K, Hayashi H, Nagae G, Tsuji S, Isagawa T, Midorikawa Y, Nishimura Y, Sakamoto H, Seto Y, Aburatani H, Kaneda A. Three DNA methylation epigenotypes in human colorectal cancer. Clin Cancer Res 2010; 16: 21-33.
13. Shen L, Toyota M, Kondo Y, Lin E, Zhang L, Guo Y, Hernandez NS, Chen X, Ahmed S, Konishi K, Hamilton SR, Issa JP. Integrated genetic and epigenetic analysis identifies three different subclasses of colon cancer. Proc Natl Acad Sci U S A 2007; 104: 18654-18659.
14. Hinoue T, Weisenberger DJ, Lange CP, Shen H, Byun HM, Van Den Berg D, Malik S, Pan F, Noushmehr H, van Dijk CM, Tollenaar RA, Laird PW. Genome-scale analysis of aberrant DNA methylation in colorectal cancer. Genome Res 2012; 22: 271-282.
15. Bishop JM. The molecular genetics of cancer. Science 1987; 235: 305-311.
16. Al-Sukhni W, Aronson M, Gallinger S. Hereditary colorectal cancer syndromes: familial adenomatous polyposis and lynch syndrome. Surg Clin North Am 2008; 88: 819-844.
17. Hegde M, Ferber M, Mao R, Samowitz W, Ganguly A. ACMG technical standards and guidelines for genetic testing for inherited colorectal cancer (Lynch syndrome, familial adenomatous polyposis, and MYH-associated polyposis). Genet Med 2014; 16: 101-116.
18. Prise KM, Folkard M, Michael BD. Bystander responses induced by low LET radiation. Oncogene 2003; 22: 7043-7049.
19. Will OC, Leedham SJ, Elia G, Phillips RK, Clark SK, Tomlinson IP. Location in the large bowel influences the APC mutations observed in FAP adenomas. Fam cancer 2010; 9: 389-393.
20. Miyaki M, Seki M, Okamoto M, Yamanaka A, Maeda Y, Tanaka K, Kikuchi R, Iwama T, Ikeuchi T, Tonomura A, Nakamura Y, White R, Miki Y, et al. Genetic Changes and Histopathological Types in Colorectal Tumors from Patients with Familial Adenomatous Polyposis. Cancer Res 1990; 50: 7166-7173.
21. Sasaki M, Sugio K, Sasazuki T. K-ras activation in colorectal tumors from patients with familial polyposis coli. Cancer 1990; 65: 2576-2579.
22. Kikuchi-Yanoshita R, Konishi R, Ito S, Seki M, Tanaka K, Maeda Y, Iino H, Fukayama M, Koike M, Mori T, Sakuraba H, Fukunari H, Koike M, et al. Genetic changes of both p53 alleles associated with the conversion from colorectal adenoma to early carcinoma in familial adenomatous polyposis and non-familial adenomatous polyposis patients. Cancer Res 1992; 52: 3965-3971.
23. Shirasawa S, Urabe K, Yanagawa Y, Toshitani K, Iwama T, Sasazuki T. p53 gene mutations in colorectal tumors from patients with familial polyposis coli. Cancer Res 1991; 51: 2874-2878.
24. Wynter CV, Kambara T, Walsh MD, Leggett BA, Young J, Jass JR. DNA methylation patterns in adenomas from FAP, multiple adenoma and sporadic colorectal carcinoma patients. Int J Cancer 2006; 118: 907-915.
25. Kashiwagi H, Spigelman AD, Talbot IC, Debinski HS, McKie AB, Lemoine NR, Phillips RK. p53 and K-ras status in duodenal adenomas in familial adenomatous polyposis. Br J Surg 1997; 6: 826-829.
26. Levi E, Stryker SJ, Rao MS. p53 Protein overexpression in colorectal tumors from patients with familial adenomatous polyposis: is it an early or late event? Am J Gastroenterol 1996; 1: 11-14
27. Bisgaard ML, Ripa R, Knudsen AL, Bulow S. Familial adenomatous polyposis patients without an identified APC germline mutation have a severe phenotype. Gut 2004; 53: 266-270.
28. Sakai E, Ohata K, Chiba H, Matsuhashi N, Doi N, Fukushima J, Endo H, Takahashi H, Tsuji S, Yagi K, Matsusaka K, Aburatani H, Nakajima A, et al. Methylation epigenotypes and genetic features in colorectal laterally spreading tumors. Int J Cancer 2014; 135: 1586-1595.
29. Toyota M, Ho C, Ohe-Toyota M, Baylin SB, Issa JP. Inactivation of CACNA1G, a T-type calcium channel gene, by aberrant methylation of its 5’ CpG island in human tumors. Cancer Res 1999; 59: 4535-4541.
30. Weisenberger DJ, Siegmund KD, Campan M, Young J, Long TI, Faasse MA, Kang GH, Widschwendter M, Weener D, Buchanan D, Koh H, Simms L, Barker M, et al. CpG island methylator phenotype underlies sporadic microsatellite instability and is tightly associated with BRAF mutation in colorectal cancer. Nat Genet 2006; 38:787-793.
31. Yagi K, Takahashi H, Akagi K, Matsusaka K, Seto Y, Aburatani H, Nakajima A, Kaneda A. Intermediate methylation epigenotype and its correlation to KRAS mutation in conventional colorectal adenoma. Am J Pathol 2012; 180: 616-625.
32. Vogelstein B, Papadopoulos N, Velculescu VE, Zhou S, Diaz LA Jr, Kinzler KW. Cancer genome landscapes. Science 2013; 339: 1546-1558.
33. Issa JP, Ottaviano YL, Celano P, Hamilton SR, Davidson NE, Baylin SB. Methylation of the oestrogen receptor CpG island links ageing and neoplasia in human colon. Nat Gener 1994; 7: 536-540.
34. Uehara Y, Ono T, Kurishita A, Kokuryu H, Okada S. Age-dependent and tissue-specific changes of DNA methylation within and around the c-fos gene in mice. Oncogene 1989; 4: 1023-1028.
35. Samowitz WS, Albertsen H, Herrick J, Levin TR, Sweeney C, Murtaugh MA, Wolff RK, Slattery ML. Evaluation of a large, population-based sample supports a CpG island methylator phenotype in colon cancer. Gastroenterology 2005; 129: 837-845.
36. Yamauchi M, Morikawa T, Kuchiba A, Imamura Y, Qian ZR, Nishihara R, Liao X, Waldron L, Hoshida Y, Huttenhower C, Chan AT, Giovannucci E, Fuchs C, et al. Assessment of colorectal cancer molecular features along bowel subsites challenges the conception of distinct dichotomy of proximal versus distal colorectum. Gut 2012; 61: 847-854.
37. Kawasaki T, Nosho K, Ohnishi M, Suemoto Y, Kirkner GJ, Dehari R, Meyerhardt JA, Fuchs CS, Ogino S. Correlation of beta-catenin localization with cyclooxygenase-2 expression and CpG island methylator phenotype (CIMP) in colorectal cancer. Neoplasia 2007; 9: 569-577.
38. Morin PJ, Sparks AB, Korinek V, Barker N, Clevers H, Vogelstein B, Kinzler KW. Activation of beta-catenin-Tcf signaling in colon cancer by mutations in beta-catenin or APC. Science 1997; 275: 1787-1790.
39. Ng TL, Gown AM, Barry TS, Cheang MC, Chan AK, Turbin DA, Hsu FD, West RB, Nielsen TO. Nuclear beta-catenin in mesenchymal tumors. Mod Pathol 2005; 18: 68-74.