
INTRODUCTION
Ovarian cancer is the fifth leading cause of cancer related deaths in American women [1]. The American Cancer Society projects 22,280 new cases of ovarian cancer in 2016 and the estimated 5 year death rate is 65% [1]. Epithelial ovarian cancer (EOC) constitutes the most predominant form of the disease with high grade serous ovarian cancer (HGSOC) being the most common and lethal histotype [2]. One of the obstacles in developing treatments for HGSOC is the lack of understanding of the pathogenesis of HGSOC due to an uncertain site of origin [3]. Traditionally, it was thought that HGSOC arises from the ovarian surface epithelium (OSE), but over the last decade it has become apparent that the fallopian tube epithelium (FTE) is also a likely source for HGSOC [4]. As evidence, prophylactically removed fallopian tubes from women who are genetically predisposed to developing ovarian cancer expressed dysplastic and hyperplastic lesions with accumulation of mutations in the tumor suppressor gene psmall proteoglycan associated with53 in the FTE [5]. Marquezet et al. and Merritt et al. found significant correlations between the transcriptome of serous ovarian cancers and normal fallopian tube epithelium and a decrease in overall survival for fallopian tube like tumors [6, 7]. A retrospective study found that salpingectomy was associated with a 45% reduction in the risk of ovarian cancer [8]. Lastly, a mouse model with Pax8 driven tissue specific Brca and Pten deletion combined with Tp53 mutation in fallopian tube secretory epithelium leads to HGSOC [9].
Mutations in p53 occur in 96% of HGSOC, and the identification of p53 mutations in putative benign lesions suggests that mutation of this gene is critically important and occurs early in fallopian-tube derived HGSOC [10]. In HGSOC, the most frequent p53 mutations occur in the DNA binding domain at codons R273, R248 and R175 [11]. Some DNA binding mutations are termed gain of function (GOF) mutations, which refers to the enhanced biological activity that facilitates tumor growth and metastasis [12]. Mouse models with p53R270H/- and p53R172H develop more carcinomas, with increased capacity for metastasis [13]. Mice expressing a knock-in p53R248W have accelerated formation of lymphomas and sarcomas with increased chemoresistance [14]. Ovarian carcinoma patients harboring a R248W mutation have a poor overall survival compared to R273H with selective chemoresistance to microtubule stabilizers [15]. Currently, small molecules are being identified that can alter the mutant p53 configuration back to wild-type or can degrade mutant p53 protein. Treatment with NSC59984 in p53R273H mutant colorectal cancer cell lines demonstrated an increase in mutant p53 degradation and stabilization of p53WT signaling through activation of p73 [16]. Given the evidence that mutation in p53 impacts tissues differently, the response of HGSOC derived from OSE and fallopian tube to small molecules that alter mutant p53 may differ.
Murine oviductal epithelial cells (MOE), the equivalent of human fallopian tube, harboring the p53R273H mutation migrate more than control cells [17]. Microarray data confirmed expression changes of pro-migratory genes in p53R273H transfected MOE cells compared to parental cells [17]. The tissue specificity of the pro-migratory genes remains unknown. However, the same mutation did not show any phenotypic changes in murine ovarian surface epithelial cells (MOSE) [17] largely due to a lack of SLUG induction. SLUG is a p53 transcriptional target and a migratory protein [18]. Different p53 mutations have tissue specific signaling mechanisms in other cancers. For example, a study in pediatric adrenal cortical carcinoma found that p53R337H did not form sarcoma in soft tissues or bone which is frequently found in case of Li-Fraumeni families [19]. Another study found tissue specific regulation of p53 targets in liver and spleen cells [20]. Liver cells had induced p21 induction with no expression of apoptotic genes, but spleen cells had the inverse, specific induction of apoptotic gene PUMA occurred without changes in p21 [20].
The objective of this study was to identify a mutant p53 FTE target gene to determine if markers might be present that can facilitate determination of the cell of origin. Two frequently reported p53 DNA contact mutants (R273H and R248W) in HGSOC were chosen and a panel of pro-migratory genes from our previously published cDNA microarray data in FTE vs OSE was mined to determine if they are differentially regulated by mutant p53 in the OSE compared to oviductal cells. In addition, NSC59984 treatment in MOE cells harboring p53R273H and p53R248W suggests that p53 DNA binding mutants may differ and may require different small molecules to inhibit their activity.
RESULTS
CDH6 is decreased by p53 mutation in MOE cells not MOSE cells
A microarray analysis in MOE cells expressing the p53R273H revealed a significantly altered pro-migratory gene signature compared to the MOE vector control cells [17]. Based on those results, several candidate genes (Supplementary Table S1) were chosen based on their expression in the fallopian tube, their role in migration, and their association with cancer [21–25]. The selected candidate genes were cadherin-6 type 2, K-cadherin (Cdh6, cell adhesion proteoglycan), pregnancy-associated plasma protein A (Pappa, secreted metalloprotease), wingless-type MMTV integration site family, member 4 (Wnt4, local signaling molecule) and decorin (Dcn, small proteoglycan associated with collagen). Quantitative PCR (qPCR) was used to validate the microarray using MOE cells expressing p53R270H mutation (the murine equivalent of R273H). Ccl2 expression was repressed by mutant p53 [26] and this was confirmed as a positive control (Figure 1A). Increased Dcn, decreased Pappa, Cdh6 and Wnt4 expression levels were measured in MOE p53R270H (Figure 1A) cells compared to control. Next, CDH6 and DCN protein levels were examined. Reduced CDH6 and increased DCN protein was seen in MOE cells with p53R270H (Figure 1B and 1C).
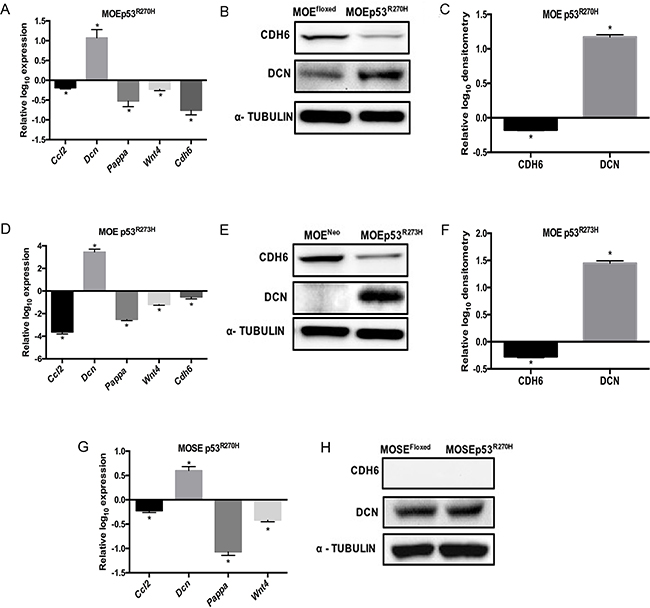
Figure 1: Comparative pro-migratory gene expression levels in MOE and MOSE cells. Pro-migratory mRNA levels were measured by qPCR in MOE and MOSE cells with p53 mutation and normalized to their respective controls. A. MOEp53R270H relative to MOEFloxed control cells. Cell lysates were probed with CDH6 and DCN antibodies. α - Tubulin is used as a loading control. B. Western blot on MOEFloxed and MOEp53R270H cells. C. Densitometry analysis of MOEp53R270H relative to MOEFloxed control cells. D. qPCR data obtained from MOEp53R273H relative to MOENeo control cells. E. Western blot on MOENeo and MOEp53R273H cells. F. Densitometry analysis of MOEp53R273H relative to MOENeo control cells. G. qPCR data obtained from MOSEp53R270H relative to MOSEFloxed control cells. H. Western blot on MOSEFloxed and MOSEp53R270H cells. Data represent mean ± SEM. Student t-test was used to determine significance, (*p < 0.05) relative to control.
To test if human p53 mutations (R273H and R248W) alter the pro-migratory gene expression in MOE cells, qPCR was performed. MOE cells harboring human p53 mutation R273H exhibited induced Dcn expression and reduced Cdh6, Pappa, Wnt4 and Ccl2 mRNA levels compared to control cells (Figure 1D). Western blot analysis confirmed that p53R273H repressed CDH6 expression and induced DCN expression in MOE cells (Figure 1E and 1F) similar to the murine p53R270H. To further determine if any of these targets are uniquely regulated in fallopian tube cells compared to the OSE, MOSE cells expressing p53R270H mutation (the murine equivalent of R273H) were used. qPCR revealed increased Dcn and reduced Ccl2, Pappa and Wnt4 in MOSEp53R270H cells compared to control cells (Figure 1G). Interestingly, Cdh6 expression was not detected in MOSE cells. Consistent with qPCR analysis, CDH6 protein was not detected and DCN expression was not altered in MOSE cells with p53R270H (Figure 1H). These analyses revealed that CDH6 is repressed in MOE cells by p53 mutation, but its expression and regulation in MOSE cells was not detectable.
MOE cells with stable p53R248W expression were next investigated. A MOEp53R248W clone was confirmed for human p53 mRNA (Supplementary Figure S1A) and p53 protein expression (Supplementary Figure S1B and S1C). p53R248W increased Dcn and reduced Ccl2, Cdh6, Pappa and Wnt4 as compared to control (Figure 2A). CDH6 protein levels were decreased and DCN was induced due to p53R248W in MOE cells (Figure 2B and 2C) similar to p53R273H. Because p53R273H and p53R248W are the two most frequently mutated sites in ovarian cancer, and our previous data indicated that p53R273H mutation enhanced migration [17], we tested the effect of stable p53R248W on migration. MOEp53R248W cells migrated ~20% faster than the vector control (MOENeo cells), but not as rapidly as MOE p53R273H cells (Figure 2D). FOXM1 is induced by mutant p53 and can increase tumor metastases [27]. Our previous data indicated that SLUG was a key downstream target of R273H that mediated motility [27]. FOXM1 expression levels in MOE p53R248W cells were lower than the levels in MOE p53R273H cells (Figure 2E & 2F). SLUG expression was not detected in MOE p53R248W cells (Figure 2E & 2F). These data suggest that p53R273H and p53R248W do not equally induce SLUG and FOXM1 expression in the fallopian tube and this modified migration.
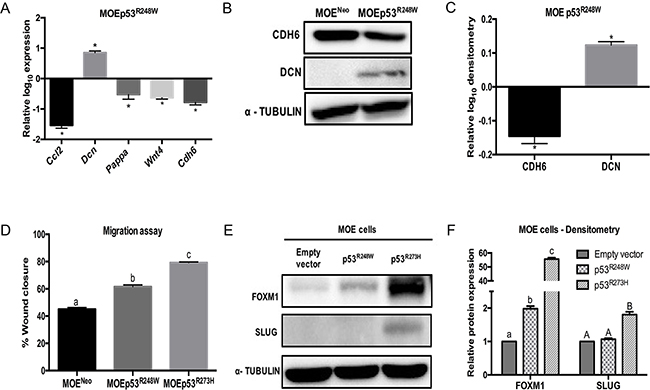
Figure 2: p53R248W reduces CDH6 expression and increases migration in MOE cells. A. qPCR analysis on MOEp53R248W cells relative to MOENeo control cells. Cell lysates were probed with CDH6 and DCN antibodies. α - Tubulin is used as a loading control. B. Western blot on MOENeo and MOEp53R248W cells. C. Densitometry analysis of MOEp53R248W relative to MOENeo control cells. D. Migration assay of MOENeo, MOEp53R273H, and MOEp53R248W cells 8 hours after wounding. E. FOXM1 and SLUG western blot. α - Tubulin is used as loading control. F. Densitometry analysis on relative FOXM1 and SLUG protein levels compared to empty vector cells. Data represent mean ± SEM. Data was analyzed with a student t-test (*p < 0.05 relative to control) or one-way ANOVA (a–c or A-B bar without common letter differ, p < 0.05).
The PAX8cre/+p53R270H/+ mouse model confirms CDH6 is regulated in the oviducts and not the ovaries
In order to verify whether CDH6 is regulated by mutant p53 in vivo, a transgenic mouse model was developed. A tissue specific transgenic mouse model was generated by crossing mice with a Lox-stop-Lox site regulating expression of the R270H mutation with mice expressing cre-recombinase driven by the Pax8 promoter. Using this model, p53R270H remains floxed and only p53WT is expressed except in PAX8 expressing tissues, such as the oviduct, uterus, and kidney. PCR confirmed that the p53R270H had recombined in the oviduct and uterus, but not in the ovaries, which do not express PAX8 and therefore would lack cre-recombinase (Supplementary Figure S2A). Mice were sacrificed after 9 months, tissues were dissected and mRNA was extracted for qPCR. Cdh6, Pappa, Wnt4, and Ccl2 mRNA levels were decreased and Dcn mRNA was increased in PAX8cre/+p53R270H/+ compared to control PAX8cre/+ oviducts (Figure 3A). Dcn, Pappa, Wnt4, and Ccl2 were not significantly altered in the PAX8cre/+p53R270H/+ ovaries (Supplementary Figure S2B). Consistent with the cellular models, Cdh6 mRNA levels were not detected in ovaries. Immunohistochemistry (IHC) analysis was used to identify the protein levels in PAX8cre/+p53R270H/+ and PAX8cre/+ oviducts and ovaries. CDH6 staining was high in PAX8cre/+ oviducts and the staining intensity decreased in PAX8cre/+p53R270H/+ oviducts as predicted based on repression from p53R270H (Figure 3B). DCN was detected in PAX8cre/+ and was induced in PAX8cre/+p53R270H/+ oviducts (Figure 3B). p53 stabilization was not detected in PAX8cre/+p53R270H/+ oviducts (Figure 3B). Negative CDH6 and p53 staining was seen in the ovaries (Supplementary Figure S2C). Both PAX8cre/+p53R270H/+ and PAX8cre/+ ovaries stained positive for DCN with no change at the protein level by R270H (Supplementary Figure S2C). Normal human fallopian tube fimbriae also expressed CDH6 (Figure 3C). DCN expression and p53 stabilization was not observed in normal human fallopian tube fimbriae (Figure 3C). CDH6 staining was not detected in normal human ovarian surface epithelium by IHC (Figure 3D). CK8 positive staining confirmed the presence of OSE (Figure 3D). Additionally, CDH6 protein was not detected in immortalized ovarian surface epithelial cell lysate (IOSE80) (Figure 3E). These in vivo analyses demonstrate that CDH6 is specifically repressed by mutant p53 in the oviducts.
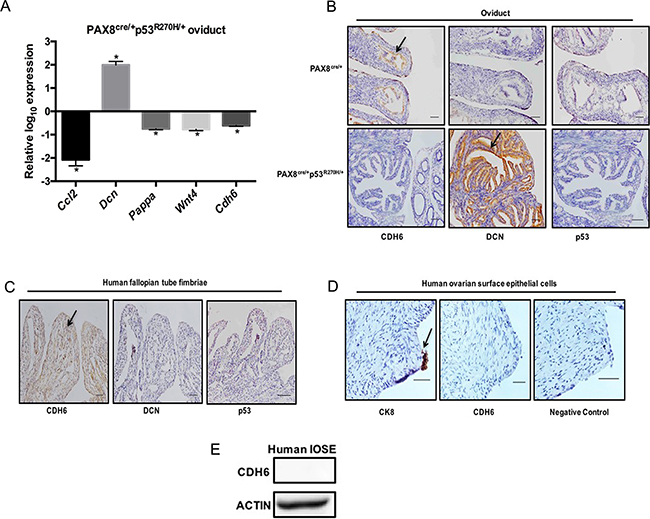
Figure 3: CDH6 is repressed by mutant p53 in murine oviducts. A. qPCR data on the pro-migratory genes mRNA levels from PAX8cre/+p53R270H/+ oviducts relative to Pax8cre/+ oviducts. B. Immunohistochemistry analysis of CDH6, DCN and p53 staining in Pax8cre/+ and PAX8cre/+p53R270H/+ oviducts C. Immunohistochemistry on human fallopian tube for CDH6, DCN and p53. Black arrow indicates positive staining. Scale bars = 100 μm. D. Immunohistochemistry on human ovaries for CDH6 and CK8. Black arrow indicates positive staining. Scale bars = 20 μm. E. CDH6 western blot in normal human IOSE cells. Actin is used as loading control. Data represent mean ± SEM. Student t-test was used to determine significance, (*p < 0.05) relative to control.
Mutant p53 reduces CDH6 expression independently and through SLUG induction in HGSOC
Mutations in p53 may directly or indirectly repress Cdh6 promoter activity. To determine if mutant p53 regulates CDH6 through direct transcriptional repression, MOE cells harboring p53WT, p53R273H, and P53R248W were cultured and ChIP analysis was performed using p53 and Non–specific IgG antibodies. Mdm2 and Atf were used as positive controls in ChIP analysis (Supplementary Figure S3A and S3B) [28]. Increased p53WT occupancy was observed on the Cdh6 promoter when compared to control IgG (Figure 4A). The p53R273H and p53R248W demonstrated a significantly higher occupancy on the Cdh6 promoter compared to p53WT (Figure 4A). These findings suggest that p53 mutation decreases Cdh6 expression in oviductal epithelium through direct repression of the promoter.
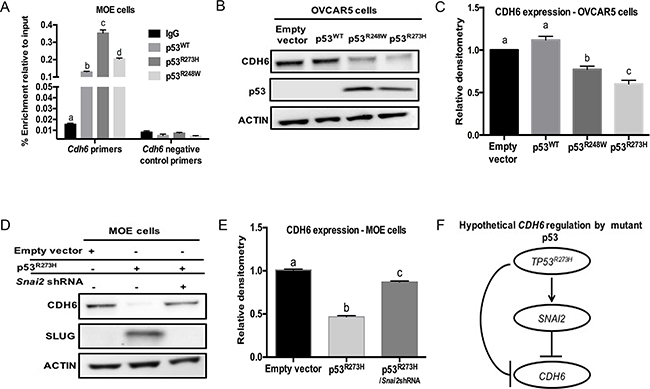
Figure 4: Mutant p53 repress CDH6 independent of p53WT in human HGSOC cell lines. A. ChIP analysis on MOE cells for non-specific IgG, p53WT, p53R273H and p53R248W occupancy on Cdh6 promoter. Primers designed on non - p53-binding site used as negative control primers. B. OVCAR5 cells were transiently transfected with empty vector, p53WT, p53R273H and p53R248W. Western blot analysis for CDH6 and p53 levels. Actin is used as loading control. C. Densitometry analysis for CDH6 expression levels on transiently transfected OVCAR5 cells relative to actin. D. Western blot image for CDH6 and SLUG levels in MOE cells. E. Densitometry data obtained on CDH6 expression levels in MOE cells with empty vector, p53R273H and p53R273H/Snai2shRNA stable expression. F. Hypothetical pathway for CDH6 regulation by p53R273H in HGSOC. Data represent mean ± SEM. One-way ANOVA was used to determine, a – d (p < 0.05) bars without common letter differ.
A panel of human HGSOC cell lines including OVCAR3, OVCAR5, OVKATE, OVSAHO and OVCAR8 were tested for the presence of CDH6. CDH6 protein was detected in OVCAR5, OVKATE, OVSAHO and OVCAR8 cells (Supplementary Figure S3C). A weak expression of CDH6 was observed in OVCAR3 cells (Supplementary Figure S3C). In order to decipher the regulation of CDH6 by mutant p53 in the absence of p53WT, a p53null human HGSOC cell line (OVCAR5 cells) was transfected to express p53WT, p53R273H or p53R248W. Endogenous CDH6 protein expression did not change in p53WT compared to empty vector control transfected cells (Figure 4B & 4C). CDH6 expression was decreased by p53R273H and p53R248W in OVCAR5 cells (Figure 4B & 4C). These results suggest that CDH6 was repressed by mutant p53 and that its repression was not dependent on blocking p53WT protein.
To identify if SLUG, a mutant p53 induced pro-migratory protein can reduce CDH6, MOE cells with stable p53R273H expression and Snai2 knock down were used. MOEp53R273H cells had increased SLUG expression and stable SLUG knock down significantly decreased cell migration compared to control cells [17]. SLUG can repress cadherin expression by binding to the E-box motifs on their promoters [29]. Knockdown of SLUG restored CDH6 protein compared to MOEp53R273H cells (Figure 4D & 4E). Therefore, both SLUG and mutant p53 regulate CDH6 (Figure 4F).
NSC59984 rescues CDH6 expression and inhibits cell migration in MOE cells
In order to study if inhibition of mutant p53 activity can rescue CDH6 repression, MOE cells with p53R273H were treated with NSC59984. NSC59984 is a small molecule that stabilizes wild type p53 signaling and increases the degradation of mutant p53 [16]. NSC59984 degraded mutant p53 protein and rescued CDH6 repression in MOE cells with p53R273H (Figure 5A and 5B). NSC59984 also reduced the cell migration in MOEp53R273H with no change in migration in MOEp53WT cells compared to DMSO treated cells (Figure 5C and 5D). HGSOC cell line OVCAR3 was selected to test the activity of NSC59984 because it expresses the p53R248W mutation and is considered a viable model of high grade serous cancer [30]. NSC59984 did not have an effect on OVCAR3 cells (Supplementary Figure S4). Our results demonstrate that NSC59984 reduces p53R273H activity, but not R248W, and can revive CDH6 repression and reduces cell migration.
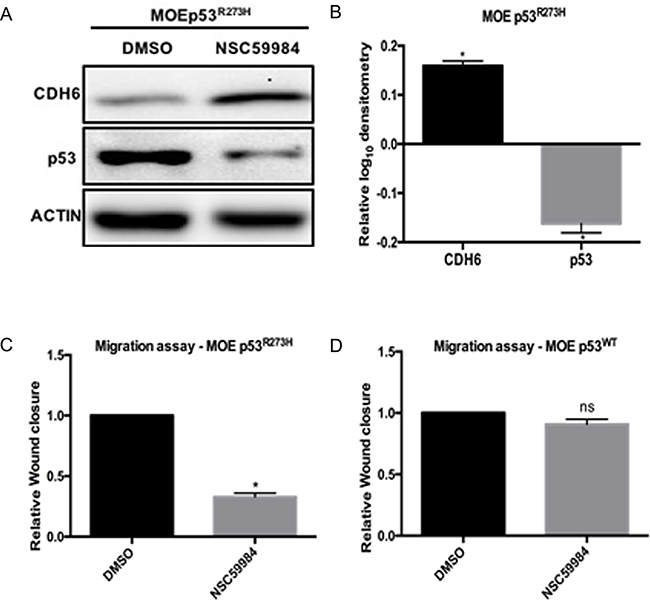
Figure 5: NSC59984 degrades p53R273H, restores CDH6 and inhibits cell migration in MOE cells. A. MOE cells withp53R273H and p53R248W cells were treated with 25 μM/L NSC59984 for 8 hours. Cells lysates were probed for CDH6 and p53. Western blot image is represented and Actin is used as loading control. B. Densitometry analysis on CDH6 and p53 expression levels with NSC59984 treatment in MOEp53R273H cells relative to DMSO treated cells. C. Migration assay after 8 hours of scratch in MOEp53R273H cells with 25 μM/L NSC59984. D. Migration assay after 8 hours of scratch in MOEp53WT cells with 25 μM/L NSC59984. Data represent mean ± SEM. Student t-test was used to determine significance, (*p < 0.05) relative to control. n.s – not significant.
DISCUSSION
Mounting evidence suggests that the FTE is a likely progenitor cell for HGSOC with p53 mutation almost being essential in HGSOC [5–7, 10]. However, the ovarian surface may still give rise to some serous tumors [31]. While almost all tumors have a p53 mutation, the two most frequent mutations are the DNA binding missense mutations, R273H and R248W [12, 32]. One potential route to improving personalized therapy for ovarian cancer is to understand the accumulating steps in tumor formation that might be targeted, which could be specific to the tissue from where the tumors originate. Thus if a tissue specific target of mutant p53 exists, it may help to differentiate FTE from OSE derived tumors. Using previously published microarray data on MOEp53R273H cells [17] a set of pro-migratory genes including Cdh6, Pappa, Dcn, Wnt4 and Ccl2 were chosen to study in oviductal epithelium and OSE. CDH6 was repressed by p53 mutants only in the MOE cells, but it was not expressed or regulated in MOSE cells. Human fallopian tube epithelial cells express CDH6, but CDH6 expression was not detected in human OSE. While gene expression for mutant p53 targets may not be retained throughout all phases of tumor progression, these data suggest that unique mutant p53 targets are present in fallopian tube that may provide clues to distinguish the two cell progenitor populations. This study also identified that p53 mutations are capable of altering a subset of genes identically in fallopian tube and ovarian surface. CDH6 is membrane glycoprotein and a member of the cadherin family that mediates homophilic cell-to-cell adhesion. CDH6 plays a key role in cell morphogenesis and when disrupted, may contribute to cell migration [33, 34]. CDH6 has been associated with cancer cells in the literature as a target that is repressed by estrogen signaling in ovarian cancer [21]. Cristofaro et al. demonstrated PAX8 can directly bind to CDH6 promoter and induce its expression in an immortalized fallopian tube secretory epithelial cell line [35]. Lastly, CDH6 was identified as a downstream target for p53 and Pax2 co-operative regulation during kidney development and nephrogenesis [36].
MOE cells stably transfected with p53R248W migrated more than control cells, but this was lower than p53R273H cells, consistent with previous reports suggesting that R273H increases tumor invasion [12, 32]. R273H and R248W may have distinct regulation on certain pro-migratory targets, for example SLUG and FOXM1 were only highly regulated by R273H. However, this study cannot fully explain the longer survival times in patients with R273 compared to R248 [32], which may be a reflection of the chemoresistance often seen in tumors with R248 [12, 32].
In HGSOC, p53 signatures (p53 protein stabilization in FTE) are a proposed early precursor lesions [37]. Intriguingly, Pax8cre/+p53R270H/+ oviducts lacked p53 staining by IHC, which is consistent with published data that mutation in p53 alone did not result in p53 stabilization in murine models [13, 17]. In other models with constitutive mutant p53 expression, the stabilization of the protein is seen in tumors, but not in the adjacent normal cells with a p53 mutation [38]. Terzian et al. found mice lacking Mdm2 or p16Ink4a stabilized mutant p53 when crossed with p53 homozygous mutant mice suggesting that loss of heterozygosity, loss of MDM2, or loss of p16 are necessary to mediate p53 stabilization [39]. The Pax8cre/+p53R270H/+ animals demonstrated no signs of tumor formation up to 12 months whereas our previous results using stable cells lines derived from oviductal cells with stable PTEN knockdown alone demonstrated p53 stabilization [40]. These data suggest that mutation alone may not generate the p53 signature, but may be a prerequisite for p53 stabilization.
High mutant p53 occupancy compared to the p53WT on the Cdh6 promoter was demonstrated by ChIP analysis in MOE cells. SLUG knockdown restored CDH6 repression in MOE cells with p53R273H mutation. SLUG, a p53 transcriptional target, was enhanced by p53R273H and increased migration [17]. SLUG can bind to E-box motifs to repress cadherin expression [41]. The TCGA reports amplification of SNAI2 (encodes for SLUG) in 12% HGSOC. Together, the data suggests that p53 independently and coupled with SLUG can regulate CDH6 expression. CDH6 levels were significantly reduced when p53R273H and p53R248W were expressed even in the absence of wild-type p53. This supports that CDH6 repression by mutant p53 is independent of p53WT and may be due to GOF activity. Zhu et al. found that p53 GOF mutants, including R273 and R248, in a CHIPseq analyses had proximal peaks on chromatin regulatory genes in breast cancer cell lines [42]. The same study also found that p53R273H had enriched peaks on E26 transformation-specific (ETS) motifs that were distinct from p53WT [42]. The CDH6 promoter contains an ETS binding motif. This observation support that CDH6 repression by mutant p53 could be due to GOF activity and this is consistent with mechanisms in the literature that require ETS motifs [42].
Currently, researchers are trying to identify small molecules to increase the degradation of mutant p53 or revert the mutant confirmation to wild type. A cell-penetrating peptide significantly inhibited p53 aggregation in OVCAR3 cells resulting in reduced tumors in vivo [43]. NSC59984 is a small molecule that can effectively degrade mutant p53 protein via MDM2 mediated ubiquitination, and is effective against colorectal cancer [16]. NSC59984 enhanced CDH6 expression, reduced mutant p53 expression, and inhibited cell migration in MOEp53R273H cells. NSC59984 did not have an effect on p53 or CDH6 protein in OVCAR3 cells harboring the p53R248W mutation. These data indicate that p53 mutants are unique and may require distinct small molecules to inhibit their activity, however more exploration is required to support this finding. Additionally, future clinical studies using small molecules or peptides that inhibit mutant p53 aggregation or that degrade mutant p53 should therefore be considered along with sequencing HGSOC tumors prior and post treatment. The existence of a p53 DNA contact mutant target, which is regulated in the fallopian tube but not expressed in ovaries, with further validations using human ovarian tumors and HGSOC clinical samples, may add to the existing tools for finding the cell of origin of serous tumors and improve personalized therapies that work better in tumors arising from the fallopian tube.
MATERIALS AND METHODS
Cell culture
Murine oviductal epithelial (MOE) cells were obtained from Dr. Barbara Vanderhyden at the University of Ottawa and were maintained in media as previously described [17]. MOENeo, MOEfloxed, MOEp53R273H, MOEp53R270H, MOSEfloxed and MOSEp53R270H cell lines were made as previously described [17]. MOEp53R248W stable cell lines were generated using a construct pCMV-Neo-BAM p53 R248W which was a gift from Bert Vogelstein (Addgene plasmid # 16437) [44]. Stable clones were selected using Neomycin resistance and were verified with Western blot and qPCR analysis. OVCAR3 cells were obtained from ATCC and maintained in media as described previously [45]. Small molecule NSC59984 was available through National Cancer Institute (NCI) as part of NCI/DTP Open Chemicals Repository. OVCAR5 cells (gift from Dr. Gustavo Rodriguez and Dr. Teresa Woodruff at Northwestern University) and are available through NCI as part of the NCI60 tumor cell line anticancer drug screen and maintained in media as described previously [46]. Human Immortalized ovarian surface epithelial cells (IOSE80) were a gift from Dr. Nelly Auersperg at the University of Vancouver and were maintained as described previously [46]. OVKATE and OVSAHO were obtained through MTA from the Japanese Collection of Research Bioresources Cell Bank (JCRB) and maintained in media as described previously [47]. OVCAR8 cells were obtained from ATCC and maintained in media as described previously [47]. OVCAR3, OVCAR5, OVKATE, OVSAHO and OVCAR8 cells have been verified by STR analysis. The molecular profiles and in vivo tumor growth capabilities of the human HGSOC cell lines used in this study have been previously characterized [47]. OVCAR5 cells were transiently transfected with antibiotic resistant plasmids containing gene of interests which includes pCMV6-Myc-Neo (Origene, donated by Dr. Kwong Wong, M.D. Anderson Cancer Center, Houston, TX), pCMV-Neo-BAM p53 R273H was a gift from Bert Vogelstein (Addgene plasmid # 16439) [44], pCMV-Neo-BAM p53 wt was a gift from Bert Vogelstein (Addgene plasmid # 16434) [44] and pCMV-Neo-BAM p53 R248W. All transfections were performed using TransIT LT1TM (Mirus Bio, Madison, WI) according to the manufacturer’s instructions.
Animals
All animals were treated in accordance with the National Institutes of Health Guidelines for the Care and Use of Laboratory Animals and the established Institutional Animal Use and Care protocol at the University of Illinois at Chicago (UIC). In addition, the Animal Care Committee approved the protocol 14-163. Animals were housed in a temperature and light controlled environment (12 hours’ light, 12 hours dark) and were provided food and water ad libitum. The Lox-stop-Lox regulating p53R270H mice (from Mouse models of Human Cancer Consortium) were bred with mice that express Cre- Recombinase (from Research institute of molecular pathology, Vienna, Dr. Bohr-Gasse [48] under the control of Pax8 promoter to generate p53R270H/+ mice. Genotyping was done as previously described (Jackson Laboratory, Bar Harbor, ME) to identify p53R270H/+ mice from p53Cre/+ mice. All mice were euthanized by CO2 inhalation followed by cervical dislocation. Reproductive tract was extracted and used for immunohistochemistry and qPCR analysis.
Immunohistochemistry (IHC)
Reproductive tract was prepared for paraffin sectioning and immunohistochemistry or hematoxylin and eosin stain as described previously [49]. Tissues were incubated with the following primary antibodies at 4°C overnight: CDH6 1:50 (cat No: ab197845, Abcam, Cambridge, MA), decorin (DCN) 1:50 (Cat No: PA5-13538, ThermoFisher scientific, Rockford, IL), Cytokeratin 8 (CK8) 1:100 (Developmental studies, Hybridoma Bank, Iowa city, IA) and p53 1:50 (Cat No: SC6243, Santa Cruz Biotechnology, Dallas, TX). In all experiments, tissues without the primary antibody treatment were used as a negative control. Images were acquired on a Nikon Eclipse E600 microscope using a DS-Ri1 digital camera and NIS Elements software (Nikon Instruments).
Quantitative reverse transcriptase PCR (qPCR) and standard PCR
RNA extraction was performed using Trizol (Life Technologies, Grand Island, NY) and chloroform with isopropanol precipitation followed by ethanol washes and DNAse step. RNA concentrations were determined using NanoVue plus spectrophotometer (GE healthcare, product code 28-9569-62). 1μg of RNA was reverse transcribed using iScript cDNA synthesis kit (Biorad, Hercules, CA) according to manufacturer’s instructions. All qPCR measurements were performed using the ABI ViiA7 (Life Technologies, San Diego, CA) and SYBR green (Roche, Madison, WI). All primers were validated for efficiency through serial dilutions and generation of a standard curve and visual inspection of the melt curve. Standard PCR was done on the mouse models for genotyping and to demonstrate cre-mediated expression of the mutant p53 allele in PAX8-cre expressing tissues. The primers and the protocol are as described previously [9]. Primers used in qPCR are listed in Supplementary Table S2.
Western blot analyses
Cells were lysed using RIPA buffer (50mM Tris, pH 7.6, 150 mM NaCl, 1% Triton X-100, 0.1% SDS) with protease and phosphatase inhibitors (Sigma-Aldrich, St. Louis, MO). Protein concentration was determined by BCA assay (Pierce, Rockford, IL). 30 μg of total protein was electrophoresed in 10% SDS – PAGE gel and transferred to nitrocellulose membrane (Thermo Fisher Scientific, Waltham, MA). Blots were then blocked with 5% milk in TBS-T or 5% BSA in TBS-T and probed at 4°C overnight with primary antibodies. The following primary antibodies were used: ACTIN 1:1000 (Cat No: A2066, Sigma-Aldrich, St. Louis, MO), CDH6 1:500 (cat No: ab197845, Abcam, Cambridge, MA), DCN 1:1000 (Cat No: PA5-13538, ThermoFisher scientific, Rockford, IL), p53 1:500 (Cat No: SC6243, Santa Cruz Biotechnology, Dallas, TX), FOXM1 1:200 (Cat No: SC500, Santa Cruz Biotechnology, Dallas, TX), SLUG 1:1000 (Cat No: ab106077, Abcam, Cambridge, MA and α – Tubulin 1: 1000 (Cat No: 2144, Cell Signaling, Beverly, MA). Anti-rabbit HRP-linked secondary antibodies (Cell Signaling Technology, Inc.) were used at a concentration of 1:1000 for all blots except for actin, which was used at 1:10,000 (Promega, Madison, WI) for 30 min in blocking buffer. After washing, membranes were incubated in SuperSignal West Femto substrate (Thermo Scientific, Rockford, IL) before imaging on a FlourChem™ E system (ProteinSimple, Santa Clara, CA). Densitometric analysis was performed using NIH ImageJ.
Migration assay
Cells were plated to confluence (1.5 x 10⁵ cells/well) in a 24- well plate. A uniform wound was created through the cell monolayer. Cells were washed with 1X phosphate buffer saline (PBS) and replenished with new media. Pictures were taken at 0 and 8 hrs after scratching using an AmScope MU900 with Toupview software (AmScope, Irvine, CA). The area of the scratch was analyzed with ImageJ NIH software. Percentage of closure was determined by measuring the final volume of the wound relative to the initial volume of the scratch.
Chromatin immunoprecipitation (ChIP analysis)
30 μl Dynabeads protein G (Life technologies, Cat no. 10003D) were used per pull down assay. Bead washing and antibody binding was performed as described previously [50]. A magnetic separation rack (Cell signaling – 7017) was used to pull the beads off between washes. Normal rabbit IgG 1:100 (Cat No: 2729, Cell signaling, Beverly, MA) was used as control and p53 1:100 (Cat No: SC6243, Santa Cruz Biotechnology, Dallas, TX) as test antibody. MOEp53WT and MOEp53R273H and MOEp53R248W cells in 10cm dish were fixed with 1% formaldehyde. MOEp53WT were treated with 10 μM proteasome inhibitor MG132 (Sigma - M7449) for 4 hours prior to fixing. Cell lysis and cross-linking was done as described previously [50]. Sonication was done with 20 second pulse “on”, 40 second pulse “off” for a total of 4 minutes, with 50% amplitude using a Sonic Dismembrator (Branson, Model 500). Cross-linking was achieved by mixing 250 μl sonicated supernatant and 100 μl of Protein G bead slurry attached to IgG and p53 antibodies separately. De-crosslinking and dissociation of chromatin-antibody complexes from the beads was done as described previously [50]. Phenol chloroform extraction was performed using UltraPure™ Phenol: Chloroform: Isoamyl Alcohol (25:24:1 v/v) as described by manufacturer’s protocol (Thermo Fisher Scientific, Waltham, MA). Combining 3.6 μl dH2O, 0.5 μM primer pair, 5 μl SYBR green mix and 1 μl sample qPCR analysis was done using the ABI ViiA7 (Life Technologies, San Diego, CA). The relative occupancy of the immunoprecipitated protein (IgG and p53) on the target gene promoter was estimated using the following equation: 2ˆ(Mean Ct Input-log1002 – Mean CtIgG or p53). Primers used are listed in Supplementary Table S3.
Statistical analyses
Data are presented as the mean ± standard error of the mean. Statistical analysis was carried out using GraphPad Prism software (GraphPad, La Jolla, CA). Statistical significance was determined by Student’s t-test or one-way ANOVA followed by a Tukey’s posthoc test. p<0.05 considered significant.
ACKNOWLEDGMENTS
We would like to thank May Fern Toh for her assistance with standard PCR assays. We would like to thank Saurabh Malpani, Mary Ellen Pavone, and Teresa Woodruff at Northwestern University for human tissue samples.
CONFLICTS OF INTEREST
The authors have declared that no conflict of interest exists.
GRANT SUPPORT
This research has been generously funded by the American Cancer Society Grant RSG-12-230-01-TBG and National Institutes of Health Grants UH3TR001207.
REFERENCES
1. Siegel RL, Miller KD and Jemal A. Cancer statistics, 2016. CA. 2016; 66:7-30.
2. Karst AM and Drapkin R. Ovarian cancer pathogenesis: a model in evolution. Journal of oncology. 2010; 2010:932371.
3. Karst AM and Drapkin R. The new face of ovarian cancer modeling: better prospects for detection and treatment. F1000 medicine reports. 2011; 3:22.
4. Vang R, Shih IM and Kurman RJ. Fallopian tube precursors of ovarian low- and high-grade serous neoplasms. Histopathology. 2013; 62:44-58.
5. Piek JM, van Diest PJ, Zweemer RP, Jansen JW, Poort-Keesom RJ, Menko FH, Gille JJ, Jongsma AP, Pals G, Kenemans P and Verheijen RH. Dysplastic changes in prophylactically removed Fallopian tubes of women predisposed to developing ovarian cancer. The Journal of pathology. 2001; 195:451-456.
6. Marquez RT, Baggerly KA, Patterson AP, Liu J, Broaddus R, Frumovitz M, Atkinson EN, Smith DI, Hartmann L, Fishman D, Berchuck A, Whitaker R, Gershenson DM, Mills GB, Bast RC, Jr. and Lu KH. Patterns of gene expression in different histotypes of epithelial ovarian cancer correlate with those in normal fallopian tube, endometrium, and colon. Clinical cancer research. 2005; 11:6116-6126.
7. Merritt MA, Bentink S, Schwede M, Iwanicki MP, Quackenbush J, Woo T, Agoston ES, Reinhardt F, Crum CP, Berkowitz RS, Mok SC, Witt AE, Jones MA, Wang B and Ince TA. Gene expression signature of normal cell-of-origin predicts ovarian tumor outcomes. PloS one. 2013; 8:e80314.
8. Falconer H, Yin L, Gronberg H and Altman D. Ovarian cancer risk after salpingectomy: a nationwide population-based study. J Natl Cancer Inst. 2015; 107.
9. Perets R, Wyant GA, Muto KW, Bijron JG, Poole BB, Chin KT, Chen JY, Ohman AW, Stepule CD, Kwak S, Karst AM, Hirsch MS, Setlur SR, Crum CP, Dinulescu DM and Drapkin R. Transformation of the fallopian tube secretory epithelium leads to high-grade serous ovarian cancer in Brca;Tp53;Pten models. Cancer cell. 2013; 24:751-765.
10. Jones PM and Drapkin R. Modeling high-grade serous carcinoma: how converging insights into pathogenesis and genetics are driving better experimental platforms. Frontiers in oncology. 2013; 3.
11. Freed-Pastor WA and Prives C. Mutant p53: one name, many proteins. Genes & development. 2012; 26:1268-1286.
12. Brachova P, Thiel KW and Leslie KK. The consequence of oncomorphic TP53 mutations in ovarian cancer. International journal of molecular sciences. 2013; 14:19257-19275.
13. Olive KP, Tuveson DA, Ruhe ZC, Yin B, Willis NA, Bronson RT, Crowley D and Jacks T. Mutant p53 gain of function in two mouse models of Li-Fraumeni syndrome. Cell. 2004; 119:847-860.
14. Song H, Hollstein M and Xu Y. p53 gain-of-function cancer mutants induce genetic instability by inactivating ATM. Nature cell biology. 2007; 9:573-580.
15. Seagle BL, Yang CP, Eng KH, Dandapani M, Odunsi-Akanji O, Goldberg GL, Odunsi K, Horwitz SB and Shahabi S. TP53 hot spot mutations in ovarian cancer: selective resistance to microtubule stabilizers in vitro and differential survival outcomes from The Cancer Genome Atlas. Gynecologic oncology. 2015; 138:159-164.
16. Zhang S, Zhou L, Hong B, van den Heuvel AP, Prabhu VV, Warfel NA, Kline CL, Dicker DT, Kopelovich L and El-Deiry WS. Small-Molecule NSC59984 Restores p53 Pathway Signaling and Antitumor Effects against Colorectal Cancer via p73 Activation and Degradation of Mutant p53. Cancer research. 2015; 75:3842-3852.
17. Quartuccio SM, Karthikeyan S, Eddie SL, Lantvit DD, E Oh, Modi DA, Wei JJ and Burdette JE. Mutant p53 expression in fallopian tube epithelium drives cell migration. International journal of cancer. 2015; 137:1528-1538.
18. Fenouille N, Tichet M, Dufies M, Pottier A, Mogha A, Soo JK, Rocchi S, Mallavialle A, Galibert MD, Khammari A, Lacour JP, Ballotti R, Deckert M and Tartare-Deckert S. The epithelial-mesenchymal transition (EMT) regulatory factor SLUG (SNAI2) is a downstream target of SPARC and AKT in promoting melanoma cell invasion. PloS one. 2012; 7:e40378.
19. Ribeiro RC, Sandrini F, Figueiredo B, Zambetti GP, Michalkiewicz E, Lafferty AR, DeLacerda L, Rabin M, Cadwell C and Sampaio G. An inherited p53 mutation that contributes in a tissue-specific manner to pediatric adrenal cortical carcinoma. Proceedings of the National Academy of Sciences. 2001; 98:9330-9335.
20. Soussi T. p53 alterations in human cancer: more questions than answers. Oncogene. 2007; 26:2145-2156.
21. Walker G, MacLeod K, Williams AR, Cameron DA, Smyth JF and Langdon SP. Estrogen-regulated gene expression predicts response to endocrine therapy in patients with ovarian cancer. Gynecologic oncology. 2007; 106:461-468.
22. Hess AP, Talbi S, Hamilton AE, Baston-Buest DM, Nyegaard M, Irwin JC, Barragan F, Kruessel JS, Germeyer A and Giudice LC. The human oviduct transcriptome reveals an anti-inflammatory, anti-angiogenic, secretory and matrix-stable environment during embryo transit. Reproductive biomedicine online. 2013; 27:423-435.
23. Becker MA, Haluska P, Jr., Bale LK, Oxvig C and Conover CA. A novel neutralizing antibody targeting pregnancy-associated plasma protein-a inhibits ovarian cancer growth and ascites accumulation in patient mouse tumorgrafts. Molecular cancer therapeutics. 2015; 14:973-981.
24. Kuchenbaecker KB, Ramus SJ, Tyrer J, Lee A, Shen HC, Beesley J, Lawrenson K, McGuffog L, Healey S, Lee JM, Spindler TJ, Lin YG, Pejovic T, Bean Y, Li Q, Coetzee S, et al. Identification of six new susceptibility loci for invasive epithelial ovarian cancer. Nature genetics. 2015; 47:164-171.
25. Zhang Y, Wang Y, Du Z, Wang Q, Wu M, Wang X, Wang L, Cao L, Hamid AS and Zhang G. Recombinant human decorin suppresses liver HepG2 carcinoma cells by p21 upregulation. OncoTargets and therapy. 2012; 5:143-152.
26. Hacke K, Rincon-Orozco B, Buchwalter G, Siehler SY, Wasylyk B, Wiesmuller L and Rosl F. Regulation of MCP-1 chemokine transcription by p53. Molecular cancer. 2010; 9:82.
27. Raychaudhuri P and Park HJ. FoxM1: a master regulator of tumor metastasis. Cancer research. 2011; 71:4329-4333.
28. Garritano S, Inga A, Gemignani F and Landi S. More targets, more pathways and more clues for mutant p53. Oncogenesis. 2013; 2:e54.
29. Alves CC, Carneiro F, Hoefler H and Becker KF. Role of the epithelial-mesenchymal transition regulator Slug in primary human cancers. Frontiers in bioscience. 2009; 14:3035-3050.
30. Anglesio MS, Wiegand KC, Melnyk N, Chow C, Salamanca C, Prentice LM, Senz J, Yang W, Spillman MA, Cochrane DR, Shumansky K, Shah SP, Kalloger SE and Huntsman DG. Type-specific cell line models for type-specific ovarian cancer research. PloS one. 2013; 8:e72162.
31. Kim J, Coffey DM, Ma L and Matzuk MM. The ovary is an alternative site of origin for high-grade serous ovarian cancer in mice. Clinical Cancer Research. 2015; 21.
32. Seagle BL, Eng KH, Dandapani M, Yeh JY, Odunsi K and Shahabi S. Survival of patients with structurally-grouped TP53 mutations in ovarian and breast cancers. Oncotarget. 2015; 6:18641-18652. doi: 10.18632/oncotarget.4080.
33. Gao J, Aksoy BA, Dogrusoz U, Dresdner G, Gross B, Sumer SO, Sun Y, Jacobsen A, Sinha R, Larsson E, Cerami E, Sander C and Schultz N. Integrative analysis of complex cancer genomics and clinical profiles using the cBioPortal. Sci Signal. 2013; 6:pl1.
34. Cerami E, Gao J, Dogrusoz U, Gross BE, Sumer SO, Aksoy BA, Jacobsen A, Byrne CJ, Heuer ML, Larsson E, Antipin Y, Reva B, Goldberg AP, Sander C and Schultz N. The cBio cancer genomics portal: an open platform for exploring multidimensional cancer genomics data. Cancer Discov. 2012; 2:401-404.
35. de Cristofaro T, Di Palma T, Soriano AA, Monticelli A, Affinito O, Cocozza S and Zannini M. Candidate genes and pathways downstream of PAX8 involved in ovarian high-grade serous carcinoma. Oncotarget. 2016; 7:41929-41947. doi: 10.18632/oncotarget.9740.
36. Saifudeen Z, Liu J, Dipp S, Yao X, Li Y, McLaughlin N, Aboudehen K and El-Dahr SS. A p53-Pax2 pathway in kidney development: implications for nephrogenesis. PloS one. 2012; 7:e44869.
37. Levanon K, Crum C and Drapkin R. New Insights Into the Pathogenesis of Serous Ovarian Cancer and Its Clinical Impact. J Clin Oncol. 2008; 26:5284-5293.
38. Lang GA, Iwakuma T, Suh YA, Liu G, Rao VA, Parant JM, Valentin-Vega YA, Terzian T, Caldwell LC, Strong LC, El-Naggar AK and Lozano G. Gain of function of a p53 hot spot mutation in a mouse model of Li-Fraumeni syndrome. Cell. 2004; 119:861-872.
39. Terzian T, Suh YA, Iwakuma T, Post SM, Neumann M, Lang GA, Van Pelt CS and Lozano G. The inherent instability of mutant p53 is alleviated by Mdm2 or p16INK4a loss. Genes & development. 2008; 22:1337-1344.
40. Eddie SL, Quartuccio SM, E Oh, Moyle-Heyrman G, Lantvit DD, Wei JJ, Vanderhyden BC and Burdette JE. Tumorigenesis and peritoneal colonization from fallopian tube epithelium. Oncotarget. 2015; 6:20500-20512. doi: 10.18632/oncotarget.3985.
41. Hotz B, Arndt M, Dullat S, Bhargava S, Buhr HJ and Hotz HG. Epithelial to mesenchymal transition: expression of the regulators snail, slug, and twist in pancreatic cancer. Clinical cancer research. 2007; 13:4769-4776.
42. Zhu J, Sammons MA, Donahue G, Dou Z, Vedadi M, Getlik M, Barsyte-Lovejoy D, Al-awar R, Katona BW, Shilatifard A, Huang J, Hua X, Arrowsmith CH and Berger SL. Gain-of-function p53 mutants co-opt chromatin pathways to drive cancer growth. Nature. 2015; 525:206-211.
43. Soragni A, Janzen DM, Johnson LM, Lindgren AG, Thai-Quynh Nguyen A, Tiourin E, Soriaga AB, Lu J, Jiang L, Faull KF, Pellegrini M, Memarzadeh S and Eisenberg DS. A Designed Inhibitor of p53 Aggregation Rescues p53 Tumor Suppression in Ovarian Carcinomas. Cancer cell. 2016; 29:90-103.
44. Baker SJ, Markowitz S, Fearon ER, Willson JK and Vogelstein B. Suppression of human colorectal carcinoma cell growth by wild-type p53. Science. 1990; 249:912-915.
45. Modi DA, Sunoqrot S, Bugno J, Lantvit DD, Hong S and Burdette JE. Targeting of follicle stimulating hormone peptide-conjugated dendrimers to ovarian cancer cells. Nanoscale. 2014; 6:2812-2820.
46. O’ hAinmhire E, Quartuccio SM, Cheng W, Ahmed RA, King SM and Burdette JE. Mutation or loss of p53 differentially modifies TGFβ action in ovarian cancer. PloS one. 2014; 9:e89553.
47. Mitra AK, Davis DA, Tomar S, Roy L, Gurler H, Xie J, Lantvit DD, Cardenas H, Fang F, Liu Y, Loughran E, Yang J, Sharon Stack M, Emerson RE, Cowden Dahl KD, M VB, et al. In vivo tumor growth of high-grade serous ovarian cancer cell lines. Gynecologic oncology. 2015; 138:372-377.
48. Bouchard M, Souabni A and Busslinger M. Tissue-specific expression of cre recombinase from the Pax8 locus. Genesis. 2004; 38:105-109.
49. King SM, Hilliard TS, Wu LY, Jaffe RC, Fazleabas AT and Burdette JE. The impact of ovulation on fallopian tube epithelial cells: evaluating three hypotheses connecting ovulation and serous ovarian cancer. Endocrine-related cancer. 2011; 18:627-642.
50. Vasudevan D, Hickok JR, Bovee RC, Pham V, Mantell LL, Bahroos N, Kanabar P, Cao X-J, Maienschein-Cline M and Garcia BA. Nitric oxide regulates gene expression in cancers by controlling histone posttranslational modifications. Cancer research. 2015; 75:5299-5308.