
INTRODUCTION
Until now cancer is still the second leading cause of death, which remains a big challenge to the world [1]. Although there is an increasing trend in the number of cancer survivors that should attribute to early examination and treatment, traditional detective methods such as imaging techniques and biopsy still have their limitations [2, 3]. So it is necessary to find a new way to diagnose cancer and judge the prognosis early and precisely.
MicroRNAs (miRNAs) are a class of endogenously expressed non-coding small RNAs which contain 19 – 25 nucleotides [4]. These RNAs have been proven to play important roles in cellular growth, differentiation, proliferation, metastasis, migration, and apoptosis [4–6]. Recently, many studies have demonstrated that the regulation and expression levels of miRNAs were closely related with clinicopathological features and prognoses of cancers [7, 8]. Thus miRNAs might be used as diagnostic biomarkers for cancers.
MicroRNA-9 (miR-9) was firstly found to participate in neurogenesis as a regulator to the fate of neuronal progenitor cells [9]. This kind of miRNA has also been reported to express in various kinds of cancers [10–12]. Up to now several studies have revealed that overexpressed miR-9 was related to poor survival in some kind of carcinomas such as hepatocellular carcinoma [13], adrenocortical cancer [14], osteosarcoma [15], and breast cancer [16]. There were some opposite results as well [17–19]. Therefore, the prognostic value of miR-9 on cancer patients remained unclear. We conducted this systematic review and meta-analysis to clarify the relationship between the miR-9 expression and the survival outcome of human carcinomas.
RESULTS
Study characteristics
By using the described searching strategy, we primarily collected 1355 records. After excluding duplicates and articles failed to meet the aim of our study, 71 records were assessed as eligible for full-text review. Then 55 full-text articles were excluded for insufficient data. Finally, 17 studies from 16 articles were qualified and enrolled in this meta-analysis [13–28]. Figure 1 revealed the flow chart of study selection process.
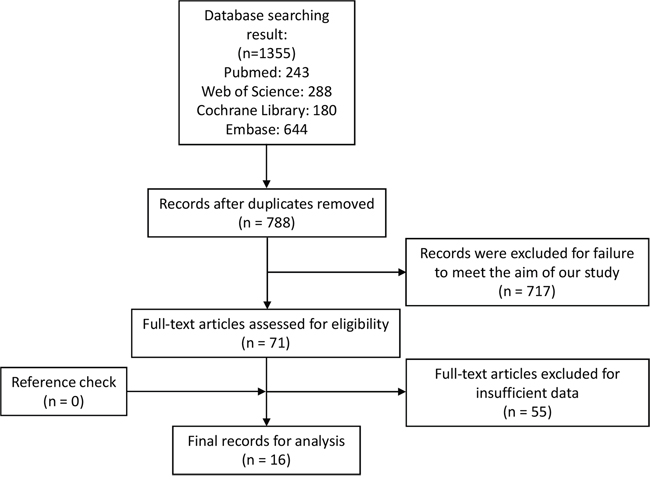
Figure 1: Flow chart of study selection process.
Main information of the included studies were summarized in Table 1. The collected 1491 patients with overall survival (OS) data, 340 patients with progress-free survival (PFS) data, 315 patient with disease-free survival (DFS) data, and 206 patients with recurrence-free survival (RFS) data were from China, German, Republic of Korea, France, Brazil, and United States. These patients were diagnosed as hepatocellular carcinoma, adrenocortical cancer, osteosarcoma, breast cancer, ovarian carcinoma, lung cancer, bladder cancer, thyroid cancer, esophageal carcinoma, glioma, and laryngeal carcinoma. Among the 17 studies, 16 measured the miR-9 expression by quantitative real-time PCR (qRT-PCR) while 1 by in situ hybridization (ISH) [20]. All studies assessed miR-9 expression in tumor tissue except 1 research in peripheral venous blood [15]. One research preferred methylated/unmethylated as cut-off values [20], one preferred positive/negative [23], one preferred mean expression level [17], one did not mention the concerning information [24], and the rests preferred median expression level. Hazard ratios (HRs) and 95% confidence intervals (CIs) were directly reported in 10 studies [13, 16, 18, 20, 22-27]. Only 1 study reported the risk ratio (RR) [25], thus we combined HRs and RR. The details of assay were summarized in Table 2. The samples in 16 outcomes were collected before any clinical treatment, in 1 outcome was collected after a period of treatment, and in 5 outcomes the related information was neglected.
Table 1: Characteristics of the included studies
Study ID |
Country |
Disease |
Number |
Stage |
Sample |
Assay |
Cut-off |
Survival |
HR |
Follow-up (months) |
|---|---|---|---|---|---|---|---|---|---|---|
Cai et al. 2014 [13] |
China |
Hepatocellular carcinoma |
200 |
I-IV |
Tissue |
qRT-PCR |
Median |
OS |
R |
Up to 60 |
Faria et al. 2015 [14] |
Germany |
Adrenocortical cancer |
28 (OS) |
I-IV |
Tissue |
qRT-PCR |
Median |
OS, DFS |
SC |
Up to 400 |
Fei et al. 2014 [15] |
China |
Osteosarcoma |
118 |
I-III |
Blood |
qRT-PCR |
Median |
OS |
SC |
48 (10 - 81) |
Gwak et al. 2014 [16] |
Republic of Korea |
Breast cancer |
129 (FS) |
I-III |
Tissue |
qRT-PCR |
Median |
DFS |
R |
68.4 (2.4 - 124.8) (FS) |
Li et al. 2013 [17] |
China |
Serous ovarian carcinoma |
45 |
I-IV |
Tissue |
qRT-PCR |
Mean |
OS, PFS |
SC |
Up to 140 (OS) |
Li et al. 2015 [18] |
China |
Epithelial ovarian carcinoma |
66 |
I-IV |
Tissue |
qRT-PCR |
Median |
OS, PFS |
R |
Up to 140 (OS) |
Muraoka et al. 2013 [20] |
Japan |
Non-small cell lung cancers |
293 |
I-III |
Tissue |
ISH |
Methylated/ |
OS |
R |
32 |
Pignot et al. 2013 [21] |
France |
Muscle-invasive bladder cancer |
72 |
T2-4 |
Tissue |
qRT-PCR |
Median |
OS, RFS |
SC |
30.5 (4 - 100) |
Sondermann et al. 2015 [22] |
Brazil |
Papillary thyroid cancer |
66 |
I-IV |
Tissue |
qRT-PCR |
Median |
RFS |
R |
Up to 120 |
Song et al. 2014 [23] |
China |
Esophageal squamous cell carcinoma |
243 |
I-IV |
Tissue |
qRT-PCR |
+/- |
OS |
R |
Up to 60 |
Sun et al. 2013 [19] |
China |
Serous ovarian cancer |
113 |
IIIC-IV |
Tissue |
qRT-PCR |
Median |
PFS |
SC |
Up to 50 |
Wu et al. 2013 [25] |
China |
Glioma |
128 |
I-IV |
Tissue |
qRT-PCR |
Median |
OS |
(RR) R |
Up to 60 |
Wu et al. 2014 [24] |
China |
Laryngeal squamous cell carcinoma |
103 |
I-IV |
Tissue |
qRT-PCR |
NR |
OS |
R |
24 - 60 |
Xu et al. 2014 [27] |
China |
Non-small cell lung cancer |
116 |
I-III |
Tissue |
qRT-PCR |
Median |
OS, PFS |
R |
36 (20 – 48) |
Xu et al. 2014 [26] |
China |
Osteosarcoma |
79 |
I-III |
Tissue |
qRT-PCR |
Median |
OS |
R |
Up to 60 |
Zhou et al. 2012 [28] |
USA |
Breast cancer |
68 |
0-IV |
Tissue |
qRT-PCR |
Median |
RFS |
SC |
77.5 |
HR, hazard ratio; FS, the first set, in which samples were from Seoul National University Bundang Hospital from 2003 to 2011; SVS, the second validation set, in which samples were from Seoul National University Bundang Hospital from 2003 to 2006; ISH, in situ hybridization; NR, not reported; OS, overall survival; PFS, progress-free survival; DFS, disease-free survival; RFS, recurrence-free survival; RR, risk ratio; R, reported; SC, survival curve.
Table 2: Details of HRs and their 95% CIs
Studie ID |
Disease |
Outcome |
HR |
95% CI and P value |
Univariate analysis or multivariate analysis |
Assay |
Internal reference |
Before or after treatment |
|---|---|---|---|---|---|---|---|---|
Cai et al. 2014 [13] |
Hepatocellular carcinoma |
OS |
4.28 |
2.77 – 7.23, P < 0.001 |
Multivariate analysis |
qRT-PCR |
U6 |
Before |
Faria et al. 2015 [14] |
Adrenocortical cancer |
OS |
4.45 |
1.02 – 19.44, P = 0.01 |
Univariate analysis |
qRT-PCR |
β-actin, |
Unknown |
Faria et al. 2015 [14] |
Adrenocortical cancer |
DFS |
7.25 |
1.07 – 49.20, P = 0.01 |
Univariate analysis |
qRT-PCR |
β-actin, |
Unknown |
Fei et al. 2014 [15] |
Osteosarcoma |
OS |
2.93 |
1.52 – 5.63, P = 0.02 |
Univariate analysis |
qRT-PCR |
U6 |
Before |
Gwak et al. 2014 [16] |
Breast cancer |
DFS (FS) |
12.204 |
1.788 – 83.299, P = 0.011 |
Multivariate analysis |
qRT-PCR |
U6 |
Before |
Gwak et al. 2014 [16] |
Breast cancer |
DFS (SVS) |
3.418 |
1.083 – 10.783, P = 0.036 |
Multivariate analysis |
qRT-PCR |
U6 |
Before |
Li et al. 2013 [17] |
Serous ovarian carcinoma |
OS |
0.53 |
0.28 – 1.00, P = 0.021 |
Univariate analysis |
qRT-PCR |
U6 |
Before |
Li et al. 2013 [17] |
Serous ovarian carcinoma |
PFS |
0.54 |
0.29 – 1.00, P = 0.0261 |
Univariate analysis |
qRT-PCR |
U6 |
Before |
Li et al. 2015 [18] |
Epithelial ovarian carcinoma |
OS |
0.37 |
0.18 – 0.76, P = 0.007 |
Multivariate analysis |
qRT-PCR |
U6, GAPDH |
Before |
Li et al. 2015 [18] |
Epithelial ovarian carcinoma |
PFS |
0.24 |
0.12 – 0.50, P = 0.000 |
Multivariate analysis |
qRT-PCR |
U6, GAPDH |
Before |
Muraoka et al. 2013 [20] |
Non-small cell lung cancers |
OS |
4.2 |
1.2 – 27.0, P = 0.026 |
Multivariate analysis |
ISH |
NR |
Unknown |
Pignot et al. 2013 [21] |
Muscle-invasive bladder cancer |
OS |
3.32 |
1.77 – 6.20, P = 0.025 |
Univariate analysis |
qRT-PCR |
U6B, RNU44 |
Unknown |
Pignot et al. 2013 [21] |
Muscle-invasive bladder cancer |
RFS |
2.51 |
1.32 – 4.75, P = 0.025 |
Univariate analysis |
qRT-PCR |
U6B, RNU44 |
Unknown |
Sondermann et al. 2015 [22] |
Papillary thyroid cancer |
RFS |
1.48 |
1.24 – 1.77, P < 0.001 |
Univariate analysis |
qRT-PCR |
RNU48 |
Before |
Song et al. 2014 [23] |
Esophageal squamous cell carcinoma |
OS |
1.543 |
1.112 – 2.140, P = 0.009 |
Multivariate analysis |
qRT-PCR |
U6, GAPDH |
Before |
Sun et al. 2013 [19] |
Serous ovarian cancer |
PFS |
0.53 |
0.36 – 0.79, P = 0.01 |
Univariate analysis |
qRT-PCR |
U6 |
After |
Wu et al. 2013 [25] |
Glioma |
OS |
3.62 (RR) |
1.81 – 7.33, |P = 0.01 |
Multivariate analysis |
qRT-PCR |
RNU6B |
Before |
Wu et al. 2014 [24] |
Laryngeal squamous cell carcinoma |
OS |
3.18 |
2.19 – 11.91, P = 0.012 |
Multivariate analysis |
qRT-PCR |
U6 |
Before |
Xu et al. 2014 [27] |
Non-small cell lung cancer |
OS |
1.491 |
1.089 – 2.042, P = 0.013 |
Multivariate analysis |
qRT-PCR |
U6 |
Before |
Xu et al. 2014 [27] |
Non-small cell lung cancer |
PFS |
1.544 |
1.174 – 2.055, P = 0.002 |
Multivariate analysis |
qRT-PCR |
U6 |
Before |
Xu et al. 2014 [26] |
Osteosarcoma |
OS |
4.77 |
2.86 – 5.91, P = 0.002 |
Multivariate analysis |
qRT-PCR |
U6 |
Before |
Zhou et al. 2012 [28] |
Breast cancer |
RFS |
2.67 |
1.07 – 6.66, P = 0.08 |
Univariate analysis |
qRT-PCR |
U6 |
Before |
OS, overall survival; PFS, progress-free survival; DFS, disease-free survival; RFS, recurrence-free survival; FS, the first set, in which samples were from Seoul National University Bundang Hospital from 2003 to 2011; SVS, the second validation set, in which samples were from Seoul National University Bundang Hospital from 2003 to 2006; HR, hazard ratio; RR, risk ratio; ISH, in situ hybridization; NR, not reported.
Meta-analysis results
A total of 12 studies reported the OS of patients [13-15, 17, 18, 20, 21, 23-27]. As the result of meta-analysis exhibited obvious heterogeneity (P < 0.001 (2.07 * 10-13), I2 = 87.0%), the random effect model was used to calculate the pooled HR and its 95% CI. The result revealed that higher expression of miR-9 might predict poor OS in various carcinomas, and the pooled HR was 2.17 (95% CI: 1.39 – 3.41, P = 0.001) (Figure 2A). PFS was reported by 4 studies [17-19, 27]. The P value and I2 of heterogeneity test were < 0.001 (3.84 * 10-8) and 92.0% respectively. After using random effect model, the pooled HR was 0.59 (95% CI: 0.27 – 1.33, P = 0.205), indicating no significant relationship between miR-9 expression and PFS (Figure 2B). The analysis result of DFS reported by 3 studies in 2 articles [14, 16] showed that the high level of miR-9 expression was related to poor DFS (HR: 5.22, 95% CI: 2.17 – 12.53, P < 0.001 (2.21 * 10-4)) (Figure 2C). The fixed effect model was used as no heterogeneity was found (P = 0.500, I2 = 0.0%). The outcomes of RFS reported by 3 studies were also pooled and analyzed [21, 22, 28]. The result of heterogeneity test was P = 0.151 and I2 = 47.1%. So, a fixed effect model was used to calculate the pooled HR which was 1.57 (95% CI: 1.32 – 1.85, P = 0.004) (Figure 2D). This result implied that the expression level of miR-9 was negatively correlated with the RFS of carcinomas.
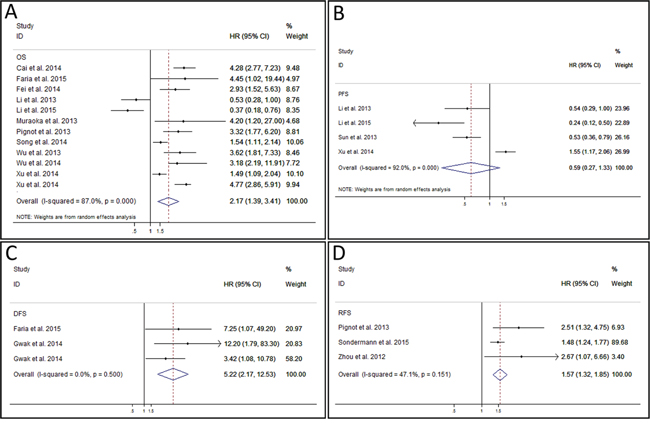
Figure 2: Forest plot of overall survival analysis, progress-free survival analysis, disease-free survival analysis, and recurrence-free survival analysis. A. meta-analysis of miR-9 expression and overall survival in various cancers. B. meta-analysis of miR-9 expression and progress-free survival in various cancers. C. meta-analysis of miR-9 expression and disease-free survival in various cancers. D. meta-analysis of miR-9 expression and recurrence-free survival in various cancers.
Subgroup analyses were carried out in osteosarcoma, ovarian carcinoma, lung cancer, and breast cancer (Figure 3A). In part of OS, results of osteosarcoma, ovarian carcinoma, and lung cancer were pooled respectively. No significant heterogeneity was found in each group (osteosarcoma: P = 0.202 and I2 = 38.6%; ovarian carcinoma: P = 0.464 and I2 = 0.0%; lung cancer: P = 0.201 and I2 = 38.8%), thus fixed effect model was used to pool the HRs according to the carcinoma. The results of analyses revealed that the over-expressed miR-9 predicted poor OS for patients with osteosarcoma (HR: 4.25, 95% CI: 3.10 – 5.84, P < 0.001 (3.89 * 10-19)) [15, 26] and lung cancer (HR: 1.55, 95% CI: 1.14 – 2.11, P = 0.005) [20, 27] while predicted good OS for patients with ovarian carcinoma (HR: 0.45, 95% CI: 0.28 – 0.73, P = 0.001) [17, 18]. In 3 articles which used PFS to assess the outcome of ovarian carcinoma [17–19], no significant heterogeneity was found (P = 0.139, I2 = 49.4%), and the fixed model calculation produced the pooled HR as 0.46 (95% CI: 0.34 – 0.62, P < 0.001 (5.03*10-7)), indicating the significant relationship between low tissue miR-9 level and poor PFS in ovarian carcinoma. No significant heterogeneity (P = 0.265, I2 = 19.5%) was revealed in pooled result of 2 studies from one article in which DFS was used as outcome assessment value of breast cancer [16]. The combined HR reached 4.78 (95% CI: 1.78 – 12.82, P = 0.002) after fixed effect model was used. Thus, the over-expressed miR-9 predicted poor outcome of breast cancer patients.
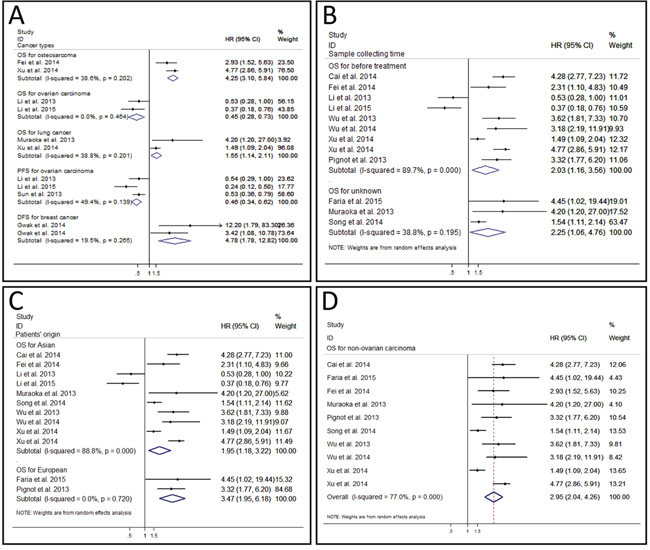
Figure 3: Forest plot of subgroup analysis. A. subgroup analysis of different cancer types. B. subgroup analysis of sample collecting time. C. subgroup analysis of patients’ origin. D. subgroup analysis of overall survival for non-ovarian carcinoma.
We also evaluated the influences of sample collecting time (Figure 3B) and patients’ origin (Figure 3C) in OS group by the subgroup analysis. A total of 9 studies collected samples and evaluated the relationship between miR-9 expression and OS before treatment [13, 15, 17, 18, 21, 24-27], and the combined HR was 2.03 (95% CI: 1.16 – 3.56, P = 0.014). As obvious heterogeneity was found (P < 0.001 (1.35 * 10-13), I2 = 89.7%), a random effect model was used. Results of 3 studies that failed to report the exact sample collecting time in OS group were pooled as well [14, 20, 23]. The combined HR was 2.25 (95% CI = 1.06 – 4.76, P = 0.034), which was comparable with the pooled result of untreated patient and OS for all. On the other hand, we performed subgroup analysis of OS according to the different patients’ origins. Patients in 10 studies were from Asia [13, 15, 17, 18, 20, 23-27]. The analysis revealed that over-expressed miR-9 was associated with unfavorable OS in Asian patients (HR: 1.95, 95% CI: 1.18 – 3.22, P = 0.009) after a random effect model was used (P < 0.001 (1.48 * 10-13), I2 = 88.8%). The HRs of OS in patients from Europe were also combined [14, 21]. The pooled HR was 3.47 (95% CI: 1.95 – 6.18, P < 0.001 (2.34 * 10-5)), which was comparable to that of Asian patients and OS for all. These results suggested that nether the sample collecting time nor the patients’ origin had significant influence on the predictive effect of miR-9.
Heterogeneity analysis
We used different methods to analyze the potential sources of the heterogeneity.
A meta-regression analysis was conducted to evaluate the possible factors related to the heterogeneity of OS. Results showed that the cut-off value (P = 0.911), follow-up period (P = 0.340), risk evaluation method (P = 0.228), sample size (P = 0.444), sample specimen (P = 0.938), univariate analysis or multivariate analysis (p = 0.759), publication year (P = 0.559), and stages of cancers (P = 0.345) contributed little to the heterogeneity. Sensitivity analysis could help to evaluate the credibility and stability of heterogeneity by omitting each study by turns. The result showed that no individual study could significantly influence the combined HR (Figure 4A). Subgroup analyses were also carried out. We divided the 12 studies into 3 groups in accordance with the cancer type: osteosarcoma including 2 studies [15, 26], ovarian carcinoma including 2 studies [17, 18], and lung cancer including 2 studies [20, 27] (Figure 3A). No obviously heterogeneity was found in each subgroup, so the cancer type could partly explain the heterogeneity of OS analysis. However, when we performed subgroup analyses based on the sample collecting time and the patients’ origin, the heterogeneity was still significant (Figure 3B and 3C), so these two factors could hardly solely explain the heterogeneity in OS analysis group. What’s more, as the studies of ovarian tumor showed opposite prognostic effect of miR-9 expression, we also carried out the subgroup analysis of OS by excluding the 2 ovarian tumor studies. Result showed that although the heterogeneity was decreased compared with that of OS for all, obvious heterogeneity could still be found (P < 0.001 (1.08 * 10-5), I2 = 77.0%) (Figure 3D).
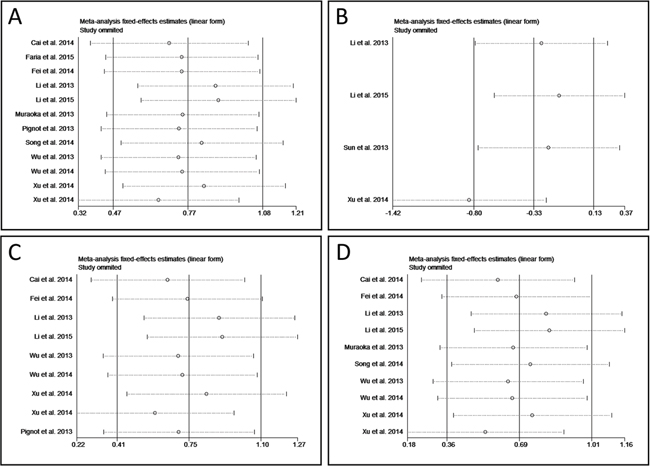
Figure 4: Forest plot of sensitivity analysis. A. sensitivity analysis of overall survival. B. sensitivity of progress-free survival. C. sensitivity analysis of OS for before treatment. D. sensitivity analysis of OS for Asian.
If less than ten studies were included in an analysis, the meta-regression analysis is not proper to find the sources responsible for the heterogeneity. Thus, sensitivity analysis was performed in PFS group, OS for before treatment, and OS for Asian instead. Result exhibited that study of Xu et al. was responsible for the heterogeneity of PFS group (Figure 4B) [27], while in the other two subgroups the results of association between miR-9 expression and OS were relatively credible and stable (Figure 4C and 4D).
Publication bias
We used funnel plots and Egger’s tests to evaluate the publication bias of included studies. The funnel plot of OS analysis was revealed in Figure 5, and the P value of Egger’s regression intercept was 0.860, indicating that no evidence of significant publication bias was found in this meta-analysis. We did not analyze the publication bias and funnel plots of PFS group, DFS group, RFS group and subgroups as the number of included studies was limited and the results were not reliable.
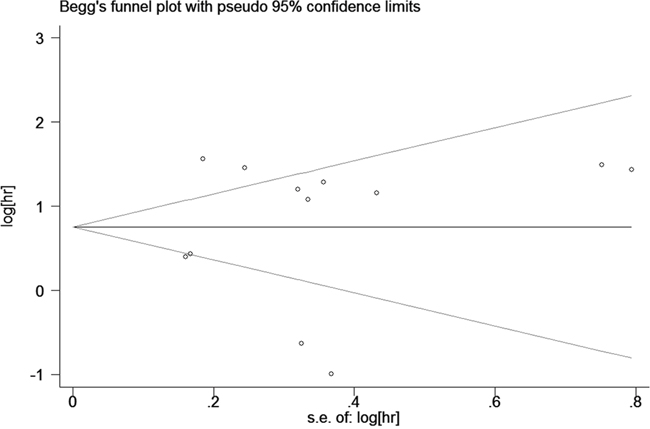
Figure 5: Begg’s funnel plot for publication bias in overall survival.
DISCUSSION
MiR-9 has been found to take part in the development of the nervous system and hepatocytes under physiologic conditions [29, 30], and induce the negative regulation of the acute responses in innate immunity [31]. Studies revealed that miR-9 also plays a pivotal role in tumorigenesis and tumor progression [32–34]. In some tumors such as ovarian cancer [18], colon cancer [12], esophageal cancer [35], and neuroblastoma [36], miR-9 is down-regulated and acts as the tumor suppressor. On contrary, miR-9 is up-regulated to enhance the growth and metastasis of breast cancer [37], non-small cell lung cancer [27], and so on.
Human miR-9 has been mapped to three chromosomal locations in the human genome (chromosomes1, 5, and 15), and three members are involved in miR-9 family: miR-9-1, miR-9-2, and miR-9-3 [38, 39]. Studies found that the alteration for any of these three independent genes could lead to the dysregulation of miR-9, while the differential transcription of primary miR-9 transcripts could mainly attribute to cell type and cellular context [40]. Study of Davila et al. revealed that Mef2C could activate miR-9-2 which resulted in the increased expression of miR-9 and further facilitated the neurogenic differentiation of neural progenitor cells [41]. On the contrary, miR-9-2 could be inhibited by REI-silencing transcription factor (REST) in undifferentiated neuroblastoma cells, leading to a suppression of miR-9 [42]. Shan et al. found that during hypoxia, the increased regulation of miR-9 was accompanied with the up-regulated transcription of miR-9-1 and miR-9-3 in a hypoxia-inducible factor-1α-dependent manner [40]. It is noteworthy that despite these different primary miRNA transcripts, all the three loci will give rise to the same mature miRNA sequence [43].
It is an interesting phenomenon that miR-9 shows low expression in neuroblastoma [36] and medulloblastoma [44] but high expression in glioma [25]. Zhang et al. found that down-regulated miR-9 was mainly associated with the invasion, metastasis and angiogenesis of neuroblastoma cells [36]. The same year, Annibali et al. found that low expression of miR-9 could up-regulate transcription factor inhibitor of DNA binding-2 (ID-2) to promote proliferation and inhibit differentiation of neuroblastoma cells. Their study also revealed that miR-9 could directly targets REST which served as a secondary inhibitor to prevent transition from progenitor cells to neurons. So they considered miR-9 as a competing endogenous RNA which could mediate the communication between ID2 and REST mRNAs [45]. As to medulloblastoma, its proliferation can also be promoted by the knockdown of miR-9 [44]. In glioma, highly expressed miR-9 plays dual roles of both proliferation-inhibitor and migration-enhancer, which is balanced by cyclic AMP response element-binding protein to carry out the migration-proliferation dichotomy [46]. Considering the histogenesis of these neural tumors, and the differentiation of neuroblastoma and medulloblastoma cells is inhibited by the down-regulated miR-9, the stage-specific expression of miR-9 may play a more important role besides the expression level itself. However, more in-depth studies are still needed to demonstrate this theory.
Recent studies have also found that miR-9 had opposing effects in the prognosis of different cancers [13, 14, 17, 18]. However, to our knowledge, the relationship between the miR-9 expression and the prognosis of various cancers hasn’t been systematic reviewed and investigated. Thus we conducted this meta-analysis to evaluate the prognostic value of miR-9.
In this meta-analysis, a total of 16 studies with 11 different types of cancers were enrolled and 4 survival assessment parameters (OS, PFS, DFS, and RFS) were measured. The result of analysis revealed that elevated miR-9 expression did predicted poor OS in carcinomas patient. We also carried out subgroup analysis of OS to try to eliminate heterogeneity and find out the specific relationship between the miR-9 expression and the OS of each tumor. Results showed that the association between the over-expression of miR-9 and poor OS was more prominent in osteosarcoma and lung cancer patients. Conversely, in patients of ovarian carcinoma, a down-regulated miR-9 usually indicated the unsatisfactory OS. Our study found that the high expression of miR-9 might predict good PFS for cancer patients. However, the P value was not statistically significant (P = 0.205) and obviously heterogeneity was found. The result of sensitivity analysis revealed that study of Xu et al. was responsible for the heterogeneity [27]. This might because the cancer type in their study was lung cancer while in the other 3 studies was ovarian cancer. This conjecture was confirmed by the subgroup analysis as no obviously heterogeneity was found after excluding the study of Xu et al., and statistically significant was revealed between the low expression of miR-9 and poor PFS in ovarian cancer patients (P < 0.001 (5.03*10-7)). We also found that the down-regulated miR-9 was related to the good outcomes of DFS and RFS. Thus, miR-9 may be a potential predictor of poor survival in cancers except for ovarian cancer. Sun et al. attributed this result to that miR-9 could mediate the down-regulation of BRCA1 which predicted good prognosis of ovarian and could inhibit the reparation of DNA damage in ovarian cancer [19]. MiR-9 can also improve the efficacy of chemotherapeutics to ovarian cancer [18].
Therapies such as chemotherapy and radiotherapy can kill cancer cells and may further influence the miR-9. The expression of miR-9 in the included studies were detected in samples of different treatment status, such as before treatment, after treatment, and unclear. So we carried out subgroup analysis to evaluate the influence of sample collecting time. In OS group the pooled results revealed that the prognostic effect of miR-9 was comparable among the untreated group, unclear group, and OS for all group. As to PFS group, DFS group, and RFS group the data were insufficient for subgroup analysis. Our result preliminarily demonstrated that there was no significant treatment effect on the relationship between miR-9 expression and OS. Similarly, we also explored the influence of patients’ origin. Most patients in OS group were from China, and the rest were from different countries respectively, which made it hard to form subgroups based on countries strictly. So we combined the patients’ origins according to the continent each country belongs to. It was hard to carry out the subgroup analysis in other survival groups because of the limited number of included studies. The result of analysis showed that OS for all patients, OS for Asian patients, and OS for European patients shared the similar combined HRs and P values, initially indicating that miR-9 held comparable predicting effect of OS in different ethnicities.
Some limitations of this study should be acknowledged. First, as only 16 articles with 17 studies were included, the data in some analyses and subgroup analyses were relatively insufficient. Second, the cut-off value used in each study was different so that a clear threshold could not be set up. Additionally, different detection methods, tumor types, follow-up period, and sample sources may also affect the effectiveness and contribute to the heterogeneity. Finally, parts of HRs were calculated based on the data extracted from the survival curves, which might lead to small statistical errors.
Our meta-analysis suggests that in most cancer types the highly expressed miR-9 is associated with poor survival of patients, whereas in patients with ovarian cancer the down-regulated miR-9 may predict poor prognosis. In conclusion, miR-9 is a potentially suitable prognostic biomarker in cancers. However, considering the limitations of the current analysis, the conclusion should be cautiously interpreted. More clinical investigations with high quality and large sample size are needed to further testify the prognostic roles of miR-9 expression in cancers.
MATERIALS AND METHODS
Guidelines of Preferred Reporting Items for Systematic Review and Meta-Analyses (PRISMA) [47] and Meta-analysis of Observational Studies in Epidemiology group (MOOSE) [48] were totally followed to carry out this meta-analysis.
Search strategy
We carefully searched online databases including PubMed, Embase, Web of Science, and Cochrane Library (last update by November 30, 2015) for literatures. Key terms used for database research were: miR-9, cancer, carcinoma, tumor, and neoplasm. These keywords were combined by Boolean operators of “AND” and “OR”. We did not set any advanced limitations when searching the database. The references of full-text articles were also manually searched to avoid omitted studies. Two reviewers independently conducted the search. Any disagreement was unified by discussion.
Inclusion and exclusion criteria
Literatures were considered to be eligible if they met the following criteria: (1) the subject of the study should be patients with any type of carcinoma; (2) the expression of miR-9 was measured in cancer tissue or serum; (3) the relationship between miR-9 expression level and survival outcome should be investigated. Articles were excluded based on the following criteria: (1) reviews, letters, comments, or laboratory studies; (2) miR-9 were not expressed in any cell line of the cancer; (3) investigation of a set of miRNAs rather than miR-9 alone; (4) only relationship between each miR-9 family member and prognostic outcome but lack of the result of integration; (5) studies of nondichotomous miR-9 expression levels; (6) absence of key information of survival outcome or cannot estimate HRs and 95% CIs by the shown data.
Quality assessment
We evaluated the included studies according to the critical review checklist of the Dutch Cochrane Centre proposed by MOOSE [48]. The basic standards were as following: (1) enough report of study population; (2) clear method of study design; (3) enough report of the cancer; (4) clear definition of outcome assessment; (5) enough description of miR-9 measurement; (6) enough period of follow-up. Studies that failed to contain these seven points were excluded.
Data extraction
Two reviewers extracted the data independently. Relevant parameters included first author’s surname, year of publication, country of origin, tumor type, tumor stage, sample type and number, method, cutoff value, follow-up period, source of miRNA, sample collecting time, and HRs of miR-9 expression for OS, PFS, DFS, and RFS, as well as their 95% CIs and P values. If the HR and 95% CI were not reported directly, we calculated them through the total observed death events and the numbers of patients in each group reported in articles. If only Kaplan-Meier curves were available, data were extracted from graphical survival plots to estimate the HRs [49]. If a study reported the results of univariate and multivariate analysis at the same time, only the latter was extracted. This is because results of multivariate analysis were more precious due to its accounting for confounding factors. Discrepancies about data extraction were resolved by discussion among the first three authors.
Statistical analysis
We used HRs with their corresponding 95% CIs to calculate pooled data. Statistically significant was defined as P < 0.05 and overall 95% CI did not include ‘1’. We use the Q test and I2 statistic to evaluate heterogeneity. A random effect model was used if P < 0.05 or I2 > 50% which indicated heterogeneity. On the contrary, a fixed effects model was used when P ≥ 0.05 and I2 ≤ 50%. Sensitivity analysis was used to investigate the source of heterogeneity. We used subgroup analysis, sensitive analysis, or meta regression to find out the factors contributed to heterogeneities. Publication bias was analyzed by funnel plot and Egger test. All these analyses were carried out by Stata 12.0 (Stata Corporation, College Station, TX, USA).
ACKNOWLEDGMENTS
Han Sun and Yingjie Shao contributed equally to this work. Han Sun, Yingjie Shao, and Huilin Yang designed the study. Han Sun and Yingjie Shao wrote the manuscript. Jin Huang and Siwei Sun collected the relevant papers and data. Han Sun, Yingjie Shao, Yijie Liu and Pinghui Zhou analyzed the data. All authors reviewed the manuscript.
CONFLICTS OF INTEREST
The authors declared no conflicts of interest.
REFERENCES
1. Siegel RL, Miller KD, Jemal A. Cancer statistics, 2015. CA. 2015; 65:5-29.
2. DeSantis CE, Lin CC, Mariotto AB, Siegel RL, Stein KD, Kramer JL, Alteri R, Robbins AS, Jemal A. Cancer treatment and survivorship statistics, 2014. CA. 2014; 64:252-271.
3. Ljungberg B, Cowan NC, Hanbury DC, Hora M, Kuczyk MA, Merseburger AS, Patard JJ, Mulders PF, Sinescu IC. EAU guidelines on renal cell carcinoma: the 2010 update. European urology. 2010; 58:398-406.
4. Wang J, Dan G, Zhao J, Ding Y, Ye F, Sun H, Jiang F, Cheng J, Yuan F, Zou Z. The predictive effect of overexpressed miR-34a on good survival of cancer patients: a systematic review and meta-analysis. OncoTargets and therapy. 2015; 8:2709-2719.
5. Bouyssou JM, Manier S, Huynh D, Issa S, Roccaro AM, Ghobrial IM. Regulation of microRNAs in cancer metastasis. Biochimica et biophysica acta. 2014; 1845:255-265.
6. Ling H, Fabbri M, Calin GA. MicroRNAs and other non-coding RNAs as targets for anticancer drug development. Nature reviews Drug discovery. 2013; 12:847-865.
7. Zhang J, Chong CC, Chen GG, Lai PB. A Seven-microRNA Expression Signature Predicts Survival in Hepatocellular Carcinoma. PloS one. 2015; 10:e0128628.
8. Tao K, Yang J, Guo Z, Hu Y, Sheng H, Gao H, Yu H. Prognostic value of miR-221-3p, miR-342-3p and miR-491-5p expression in colon cancer. American journal of translational research. 2014; 6:391-401.
9. Wienholds E, Kloosterman WP, Miska E, Alvarez-Saavedra E, Berezikov E, de Bruijn E, Horvitz HR, Kauppinen S, Plasterk RH. MicroRNA expression in zebrafish embryonic development. Science (New York, NY). 2005; 309:310-311.
10. Song Y, Mu L, Han X, Li Q, Dong B, Li H, Liu X. MicroRNA-9 inhibits vasculogenic mimicry of glioma cell lines by suppressing Stathmin expression. Journal of neuro-oncology. 2013; 115:381-390.
11. Liu S, Kumar SM, Lu H, Liu A, Yang R, Pushparajan A, Guo W, Xu X. MicroRNA-9 up-regulates E-cadherin through inhibition of NF-kappaB1-Snail1 pathway in melanoma. The Journal of pathology. 2012; 226:61-72.
12. Cekaite L, Rantala JK, Bruun J, Guriby M, Agesen TH, Danielsen SA, Lind GE, Nesbakken A, Kallioniemi O, Lothe RA, Skotheim RI. MiR-9, -31, and -182 deregulation promote proliferation and tumor cell survival in colon cancer. Neoplasia (New York, NY). 2012; 14:868-879.
13. Cai L, Cai X. Up-regulation of miR-9 expression predicate advanced clinicopathological features and poor prognosis in patients with hepatocellular carcinoma. Diagnostic pathology. 2014; 9:1000.
14. Faria AM, Sbiera S, Ribeiro TC, Soares IC, Mariani BM, Freire DS, de Sousa GR, Lerario AM, Ronchi CL, Deutschbein T, Wakamatsu A, Alves VA, Zerbini MC, Mendonca BB, Fragoso MC, Latronico AC, et al. Expression of LIN28 and its regulatory microRNAs in adult adrenocortical cancer. Clinical endocrinology. 2015; 82:481-488.
15. Fei D, Li Y, Zhao D, Zhao K, Dai L, Gao Z. Serum miR-9 as a prognostic biomarker in patients with osteosarcoma. The Journal of international medical research. 2014; 42:932-937.
16. Gwak JM, Kim HJ, Kim EJ, Chung YR, Yun S, Seo AN, Lee HJ, Park SY. MicroRNA-9 is associated with epithelial-mesenchymal transition, breast cancer stem cell phenotype, and tumor progression in breast cancer. Breast cancer research and treatment. 2014; 147:39-49.
17. Li X, Lu Y, Chen Y, Lu W, Xie X. MicroRNA profile of paclitaxel-resistant serous ovarian carcinoma based on formalin-fixed paraffin-embedded samples. BMC cancer. 2013; 13:216.
18. Li X, Pan Q, Wan X, Mao Y, Lu W, Xie X, Cheng X. Methylation-associated Has-miR-9 deregulation in paclitaxel- resistant epithelial ovarian carcinoma. BMC cancer. 2015; 15:509.
19. Sun C, Li N, Yang Z, Zhou B, He Y, Weng D, Fang Y, Wu P, Chen P, Yang X, Ma D, Zhou J, Chen G. miR-9 regulation of BRCA1 and ovarian cancer sensitivity to cisplatin and PARP inhibition. Journal of the National Cancer Institute. 2013; 105:1750-1758.
20. Muraoka T, Soh J, Toyooka S, Maki Y, Shien K, Furukawa M, Ueno T, Tanaka N, Yamamoto H, Asano H, Tsukuda K, Miyoshi S. Impact of aberrant methylation of microRNA-9 family members on non-small cell lung cancers. Molecular and clinical oncology. 2013; 1:185-189.
21. Pignot G, Cizeron-Clairac G, Vacher S, Susini A, Tozlu S, Vieillefond A, Zerbib M, Lidereau R, Debre B, Amsellem-Ouazana D, Bieche I. microRNA expression profile in a large series of bladder tumors: identification of a 3-miRNA signature associated with aggressiveness of muscle-invasive bladder cancer. International journal of cancer. 2013; 132:2479-2491.
22. Sondermann A, Andreghetto FM, Moulatlet ACB, da Silva Victor E, de Castro MG, Nunes FD, Brandão LG, Severino P. MiR-9 and miR-21 as prognostic biomarkers for recurrence in papillary thyroid cancer. Clinical and Experimental Metastasis. 2015; 32:521-530.
23. Song Y, Li J, Zhu Y, Dai Y, Zeng T, Liu L, Li J, Wang H, Qin Y, Zeng M, Guan XY, Li Y. MicroRNA-9 promotes tumor metastasis via repressing E-cadherin in esophageal squamous cell carcinoma. Oncotarget. 2014; 5:11669-11680. doi: 10.18632/oncotarget.2581.
24. Wu S, Jia S, Xu P. MicroRNA-9 as a novel prognostic biomarker in human laryngeal squamous cell carcinoma. International journal of clinical and experimental medicine. 2014; 7:5523-5528.
25. Wu Z, Wang L, Li G, Liu H, Fan F, Li Z, Li Y, Gao G. Increased expression of microRNA-9 predicts an unfavorable prognosis in human glioma. Molecular and cellular biochemistry. 2013; 384:263-268.
26. Xu SH, Yang YL, Han SM, Wu ZH. MicroRNA-9 expression is a prognostic biomarker in patients with osteosarcoma. World journal of surgical oncology. 2014; 12:195.
27. Xu T, Liu X, Han L, Shen H, Liu L, Shu Y. Up-regulation of miR-9 expression as a poor prognostic biomarker in patients with non-small cell lung cancer. Clinical & translational oncology. 2014; 16:469-475.
28. Zhou X, Marian C, Makambi KH, Kosti O, Kallakury BV, Loffredo CA, Zheng YL. MicroRNA-9 as potential biomarker for breast cancer local recurrence and tumor estrogen receptor status. PloS one. 2012; 7:e39011.
29. Shibata M, Nakao H, Kiyonari H, Abe T, Aizawa S. MicroRNA-9 regulates neurogenesis in mouse telencephalon by targeting multiple transcription factors. The Journal of neuroscience. 2011; 31:3407-3422.
30. Kim N, Kim H, Jung I, Kim Y, Kim D, Han YM. Expression profiles of miRNAs in human embryonic stem cells during hepatocyte differentiation. Hepatology research. 2011; 41:170-183.
31. Tsitsiou E, Lindsay MA. microRNAs and the immune response. Current opinion in pharmacology. 2009; 9:514-520.
32. Gomez GG, Volinia S, Croce CM, Zanca C, Li M, Emnett R, Gutmann DH, Brennan CW, Furnari FB, Cavenee WK. Suppression of microRNA-9 by mutant EGFR signaling upregulates FOXP1 to enhance glioblastoma tumorigenicity. Cancer research. 2014; 74:1429-1439.
33. Tang H, Yao L, Tao X, Yu Y, Chen M, Zhang R, Xu C. miR-9 functions as a tumor suppressor in ovarian serous carcinoma by targeting TLN1. International journal of molecular medicine. 2013; 32:381-388.
34. Zhu L, Chen H, Zhou D, Li D, Bai R, Zheng S, Ge W. MicroRNA-9 up-regulation is involved in colorectal cancer metastasis via promoting cell motility. Medical oncology (Northwood, London, England). 2012; 29:1037-1043.
35. Hu Y, Correa AM, Hoque A, Guan B, Ye F, Huang J, Swisher SG, Wu TT, Ajani JA, Xu X-C. Prognostic significance of differentially expressed miRNAs in esophageal cancer. International Journal Of Cancer. 2011; 128:132-143.
36. Zhang H, Qi M, Li S, Qi T, Mei H, Huang K, Zheng L, Tong Q. microRNA-9 targets matrix metalloproteinase 14 to inhibit invasion, metastasis, and angiogenesis of neuroblastoma cells. Molecular cancer therapeutics. 2012; 11:1454-1466.
37. Ma L, Young J, Prabhala H, Pan E, Mestdagh P, Muth D, Teruya-Feldstein J, Reinhardt F, Onder TT, Valastyan S, Westermann F, Speleman F, Vandesompele J, Weinberg RA. miR-9, a MYC/MYCN-activated microRNA, regulates E-cadherin and cancer metastasis. Nature cell biology. 2010; 12:247-256.
38. Krichevsky AM, King KS, Donahue CP, Khrapko K, Kosik KS. A microRNA array reveals extensive regulation of microRNAs during brain development. RNA (New York, NY). 2003; 9:1274-1281.
39. Sheng Y, Previti C. Genomic features and computational identification of human microRNAs under long-range developmental regulation. BMC genomics. 2011; 12:270.
40. Shan F, Li J, Huang QY. HIF-1 alpha-induced up-regulation of miR-9 contributes to phenotypic modulation in pulmonary artery smooth muscle cells during hypoxia. Journal of cellular physiology. 2014; 229:1511-1520.
41. Davila JL, Goff LA, Ricupero CL, Camarillo C, Oni EN, Swerdel MR, Toro-Ramos AJ, Li J, Hart RP. A positive feedback mechanism that regulates expression of miR-9 during neurogenesis. PloS one. 2014; 9:e94348.
42. Laneve P, Gioia U, Andriotto A, Moretti F, Bozzoni I, Caffarelli E. A minicircuitry involving REST and CREB controls miR-9-2 expression during human neuronal differentiation. Nucleic acids research. 2010; 38:6895-6905.
43. Wilting SM, Snijders PJ, Verlaat W, Jaspers A, van de Wiel MA, van Wieringen WN, Meijer GA, Kenter GG, Yi Y, le Sage C, Agami R, Meijer CJ, Steenbergen RD. Altered microRNA expression associated with chromosomal changes contributes to cervical carcinogenesis. Oncogene. 2013; 32:106-116.
44. Ferretti E, De Smaele E, Po A, Di Marcotullio L, Tosi E, Espinola MS, Di Rocco C, Riccardi R, Giangaspero F, Farcomeni A, Nofroni I, Laneve P, Gioia U, Caffarelli E, Bozzoni I, Screpanti I, et al. MicroRNA profiling in human medulloblastoma. International journal of cancer. 2009; 124:568-577.
45. Annibali D, Gioia U, Savino M, Laneve P, Caffarelli E, Nasi S. A new module in neural differentiation control: two microRNAs upregulated by retinoic acid, miR-9 and -103, target the differentiation inhibitor ID2. PloS one. 2012; 7:e40269.
46. Tan X, Wang S, Yang B, Zhu L, Yin B, Chao T, Zhao J, Yuan J, Qiang B, Peng X. The CREB-miR-9 negative feedback minicircuitry coordinates the migration and proliferation of glioma cells. PloS one. 2012; 7:e49570.
47. Moher D, Liberati A, Tetzlaff J, Altman DG. Preferred reporting items for systematic reviews and meta-analyses: the PRISMA statement. International journal of surgery (London, England). 2010; 8:336-341.
48. Stroup DF, Berlin JA, Morton SC, Olkin I, Williamson GD, Rennie D, Moher D, Becker BJ, Sipe TA, Thacker SB. Meta-analysis of observational studies in epidemiology: a proposal for reporting. Meta-analysis Of Observational Studies in Epidemiology (MOOSE) group. Jama. 2000; 283:2008-2012.
49. Tierney JF, Stewart LA, Ghersi D, Burdett S, Sydes MR. Practical methods for incorporating summary time-to-event data into meta-analysis. Trials. 2007; 8:16.