
INTRODUCTION
Lung cancer is the leading cause of life-threatening malignant diseases in humans. The American Cancer Society estimates that lung cancer incidences in 2012 were 125 per 100,000 men (0.125%) and 50 per 100,000 women (0.05%) [1]. Lung cancer accounted for 28% of cancer-related deaths in 2015, which can be partly attributed to the lack of effective molecular markers for early tumor diagnosis. As a result, lung cancer diagnosis is often delayed in patients who are initially asymptomatic or show non-specific symptoms. Fortunately, as the prevalence of lung computed tomographic (CT) screening in smoking adults has increased, rates of early diagnosis in lung cancer have also increased [2]; additionally, 5-year survival rates increased from 12% in 1975–1977 to 18% in 2005–2011 [1]. However, CT scans have many shortcomings, including high cost, radiation exposure, and low specificity [3].
MicroRNAs (miRNAs) are endogenous non-coding small RNAs ranging from 19 to 25 nucleotides in length [4]. Approximately 50% of miRNAs are located in tumor-related regions [5]. Circulating miRNAs in serum or plasma and miRNAs identified in sputum samples remain stable even under harsh experimental conditions [6–8]. Many studies have indicated that miRNA levels in fluid samples might be promising biomarkers for the detection of lung cancer because measurements of miRNA expression, which varies widely, are noninvasive, quantitative, and reproducible [9–11].
Xing et al. first demonstrated that the miRNA miR-210 distinguished lung squamous cell carcinoma patients from normal controls with 58% sensitivity and 79% specificity [12]. Since then, many additional studies have suggested that miR-210 might serve as a biomarker for lung cancer [12–20]. Furthermore, Osugi et al. found that high miR-210 expression was correlated with increased lymph node metastasis, later cancer stages, and poor prognosis in patients with non-small-cell lung cancer (NSCLC), suggesting that miR-210 might be a prognostic biomarker in these patients [21].
However, inconsistencies exist among studies that have examined the diagnostic value of miR-210. Here, we performed, to our knowledge, the first meta-analysis of all eligible studies to assess the diagnostic accuracy of miR- 210 for lung cancer.
RESULTS
Data extraction
215 potentially relevant articles were identified using several databases. As shown in Figure 1, 16 articles were retrieved and read in detail. Among these 16 papers, four that had no diagnostic indicators and three that lacked 2 × 2 contingency tables were excluded. Ultimately, the nine remaining articles were included in the meta-analysis.
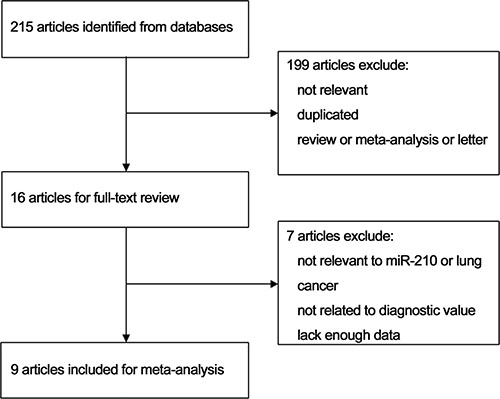
Figure 1: Flow chart of the study selection process.
Data characteristics and quality assessment
The nine studies, sorted by publication year (ranging from 2010 to 2016), are shown in Table 1. A total of 993 patients were involved in these studies, including 554 lung cancer patients and 439 non-cancer patients. Two of the studies were conducted in China and seven in the United States. Two studies investigated both NSCLC and small-cell lung carcinoma (SCLC), while seven examined only NSCLC. Four papers included stage I–II lung cancer patients, and five included stage I–IV patients. The number of patients in each study ranged from 75 to 156, and the median number of samples per study was 96. Five studies examined sputum samples and four examined blood samples. Reverse transcription-quantitative polymerase chain reaction (RT-qPCR) was used to measure miR- 210 expression in all nine studies; eight of them used the TaqMan kit and one used the SYBR-Green assay. Endogenous reference genes also differed among the studies, with five using U6 and four using miR-16. Quality Assessment of Diagnostic Accuracy Studies (QUADAS-2) guidelines indicated that the selected studies were of high quality (Figure 2).
Table 1: Summary of included studies using miR-210 as a biomarker of lung cancer
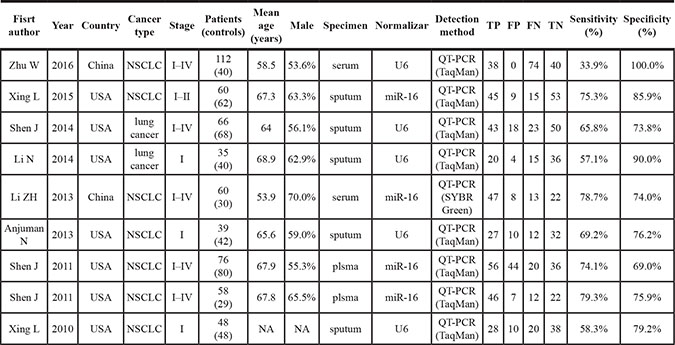
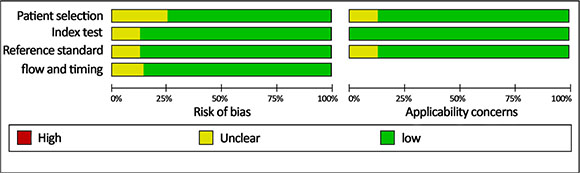
Figure 2: Quality of selected studies according to QUADAS-2 guidelines.
Diagnostic accuracy of microRNA-210 in lung cancer
The combined pooled sensitivity and specificity for all of the studies were 0.66 (95% confidence interval (CI), 0.57 to 0.75) and 0.82 (95% CI, 0.72 to 0.89), respectively (Figure 3). I2 values for sensitivity and specificity were 87.63% (95% CI, 80.87 to 94.38) and 65.44% (95% CI, 40.89 to 89.99), respectively, suggesting significant heterogeneity in sensitivity and specificity. We therefore investigated the source of the heterogeneity. The positive likelihood ratio (PLR) and negative likelihood ratio (NLR) were 3.64 (95% CI, 2.54 to 5.21) and 0.41 (95% CI, 0.34 to 0.51), respectively (Figure 4). The diagnostic odds ratio (DOR) was 8.78 (95% CI, 6.10 to 12.66) (Figure 5). The area under the summary receiver operator characteristic (SROC) curve was 0.80 (95% CI, 0.76 to 0.83) (Figure 6). Figure 7 shows Fagan’s nomogram for likelihood ratios, which was used to determine post-test probabilities resulting from different pre-test probabilities. A likelihood ratio scattergram was used to determine the clinical values of different diagnostic methods and was divided into four quadrants (Figure 8). The left upper quadrant (LRP > 10, LRN < 0.1) indicates confirmation and exclusion diagnostic value, the right upper quadrant (LRP > 10, LRN > 0.1) confirmation diagnostic value, the left lower quadrant (LRP < 10, LRN < 0.1) exclusion diagnostic value, and the right lower quadrant (LRP < 10, LRN > 0.1) neither confirmation nor exclusion diagnostic value [22]. Eight of the nine studies were plotted in the right lower quadrant, and the remaining study was in the right upper quadrant, indicating that miR-210 had a moderate diagnostic value in lung cancer. As shown in Figure 9, a hierarchical summary receiver operating characteristics (HSROC) curve was constructed. The estimated value of β was 0.26 (95% CI, -0.45 to 0.99), the value of z was 0.73, and the p-value was 0.47, implying that the SROC curve was symmetric. The value of Lambda was 2.08 (95% CI, 1.76 to 2.40), which also indicated that miR-210 had moderate accuracy in diagnosing lung cancer.
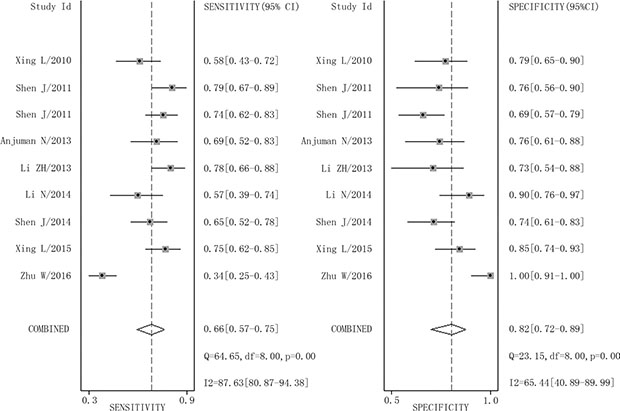
Figure 3: Forest plots of sensitivity and specificity for miR-210 in the diagnosis of lung cancer.
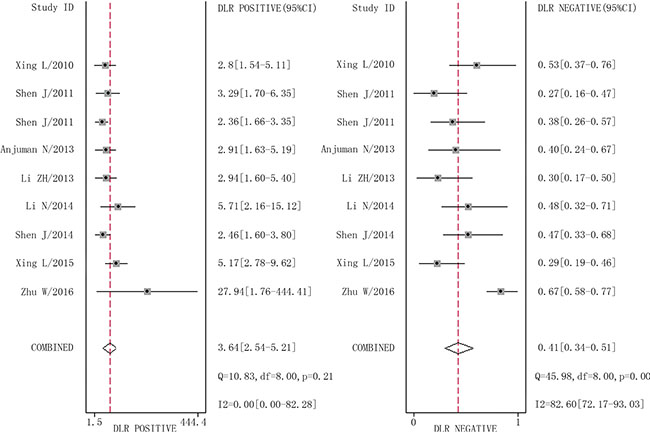
Figure 4: Forest plots of positive likelihood ratio and negative likelihood ratio for miR-210 in the diagnosis of lung cancer.
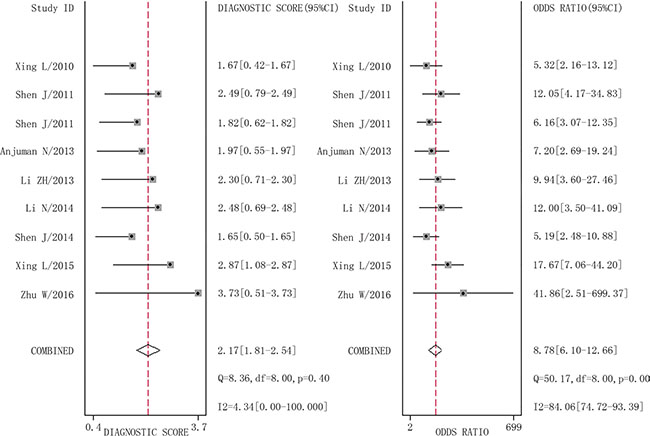
Figure 5: Forest plots of diagnostic odds ratio for miR-210 in the diagnosis of lung cancer.
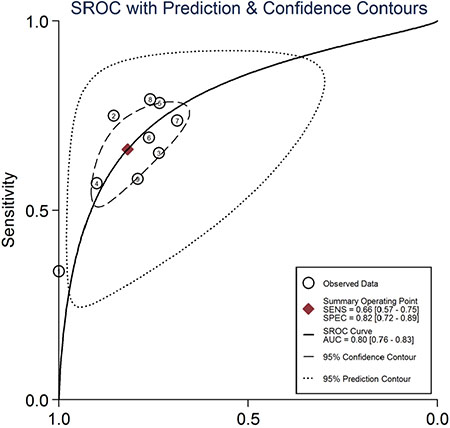
Figure 6: Summary receiver operating characteristic curve for miR-210 in the diagnosis of lung cancer.
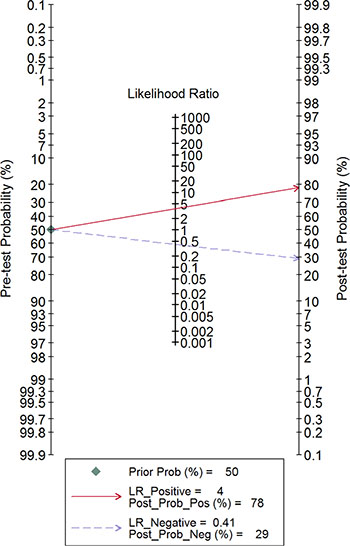
Figure 7: Fagan’s nomogram for likelihood ratios.
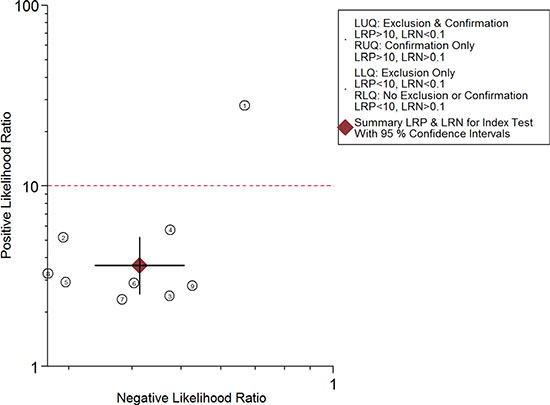
Figure 8: Likelihood ratio scattergram.
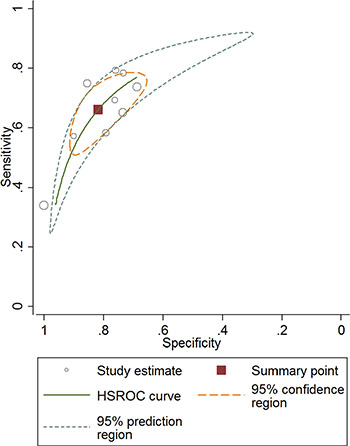
Figure 9: Hierarchical summary receiver operating characteristics curve for miR-210 in the diagnosis of lung cancer.
Meta-regression and subgroup analysis
Potential heterogeneity in sensitivity and specificity was explored with meta-regression analysis and subgroup analysis. Country, tumor stage, cancer type, specimen, and normalizer were used as co-variants in meta-regression. As shown in Table 2, country, tumor stage, cancer type, specimen, and normalizer did not explain the heterogeneity (p > 0.05). Subgroup analysis by country revealed that the pooled sensitivity and specificity in the seven studies conducted in USA were 0.69 and 0.78, respectively; for the two studies conducted in China, these values were 0.49 and 0.89, respectively. Subgroup analysis by cancer type indicated that, in the seven studies of NSCLC patients only, the pooled sensitivity was 0.63 and the specificity was 0.80; in the two studies of both NSCLC and SCLC patients, the pooled sensitivity was 0.62 and the specificity was 0.82. The pooled sensitivity and specificity were 0.66 and 0.83 in the four studies of stage I-II patients 0.62 and 0.77 in the five studies of stage I-IV patients, respectively. Finally, pooled sensitivity, specificity, and area under curve (AUC) for studies in which miR-210 was measured in blood were 0.67, 0.86, and 0.81, and were 0.66, 0.81, and 0.75 for studies in which it was measured in sputum, respectively (Table 3).
Table 2: Relative diagnostic odds ratio (RDOR) of covariants in the meta-regression analysis
Var |
RDOR |
95%CI |
P value |
|---|---|---|---|
Country |
1.39 |
(0.11,17.81) |
0.63 |
Stage |
1.25 |
(0.03,50.45) |
0.82 |
Type |
0.84 |
(0.03,22,81) |
0.84 |
Specimen |
0.79 |
(0.01,49.35) |
0.83 |
Normalizar |
0.36 |
(0.03,4.30) |
0.22 |
Table 3: Summary results of subgroup analysis for miRNA-210 in the diagnosis of lung cancer
Country |
Number of studies |
Sensitivity (95%CI) |
Specificity (95%CI) |
PLR (95%CI) |
NLR (95%CI) |
DOR (95%CI) |
|---|---|---|---|---|---|---|
Country |
||||||
USA |
7 |
0.69(0.64–0.74) |
0.78(0.73–0.82) |
3.05(2.49–3.73) |
0.40(0.34–0.47) |
7.72(5.64–10.57) |
China |
2 |
0.49(0.42–0.57) |
0.89(0.79–0.95) |
6.84(0.50–93.50) |
0.46(0.17–1.24) |
12.90(3.63–45.79) |
Type |
||||||
NSCLC |
7 |
0.63(0.59–0.68) |
0.79(0.74–0.83) |
3.07(2.34–4.02) |
0.40(0.26–0.59) |
8.68(5.96–12.63) |
Lung cancer |
2 |
0.62(0.52–0.72) |
0.80(0.71–0.87) |
3.53(1.49–7.57) |
0.47(0.36–0.62) |
6.79(3.15–14.63) |
Stage |
||||||
Early (I–II) |
4 |
0.66(0.59–0.73) |
0.83(0.77–0.88) |
3.82(2.76–5.30) |
0.41(0.33–0.51) |
9.30(5.82–14.87) |
All (I–IV) |
5 |
0.62(0.57–0.67) |
0.77(0.71–0.82) |
2.92(2.29–3.73) |
0.41(0.25–0.66) |
7.97(5.40–11.77) |
Specimen |
||||||
Blood |
4 |
0.67(0.47–0.82) |
0.86(0.54–0.97) |
2.87(1.90–4.33) |
0.39(0.20–0.75) |
8.49(5.17–13.96) |
sputum |
5 |
0.66(0.60–0.72) |
0.81(0.75–0.85) |
3.26(2.37–4.46) |
0.44(0.36–0.53) |
7.92(4.89–12.85) |
normalizar |
||||||
U6 |
5 |
0.52(0.46–0.58) |
0.82(0.77–0.87) |
3.09(2.10–4.55) |
0.52(0.40–0.68) |
7.47(4.86–11.49) |
miR-16 |
4 |
0.76(0.71–0.81) |
0.76(0.69–0.81) |
3.10(2.40–4.01) |
0.32(0.25–0.40) |
9.70(6.40–14.71) |
Publication bias evaluation
Deeks’ funnel plot asymmetry test was used to assess publication bias (Figure 10). The p-value for the linear regression was 0.86, suggesting that there was no publication bias. The ROC plane generated by meta-disc software, which is shown in Figure 11, did not show a “shoulder-arm” shape. A Spearman rank correlation was then performed to test the threshold effect. The Spearman correlation coefficient was 0.633 (p = 0.067), suggesting that there was no threshold effect.
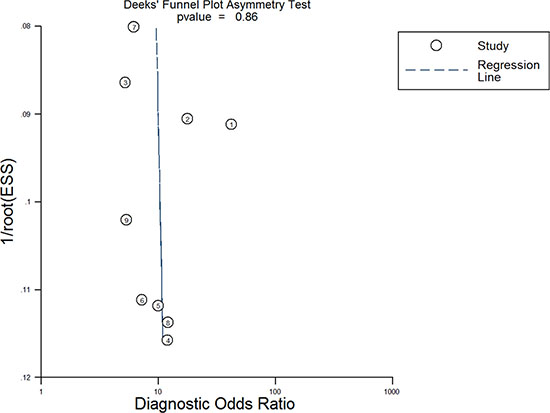
Figure 10: Deeks’ funnel plot asymmetry test for assessing publication bias.
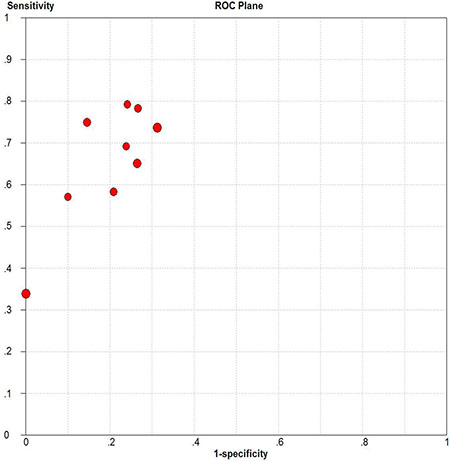
Figure 11: Receiver operating characteristics plane for assessing threshold effects.
DISCUSSION
Due to the high incidence of lung cancer and low survival rates, lung cancer screening is particularly important [1]. However, affordable, repeatable, and precise detection methods are lacking. Although miRNAs might have particularly high diagnostic values [23–25], the clinical utility of miR-210 expression for diagnosing lung cancer remains controversial [12–20]. This study is the first meta-analysis to evaluate the accuracy of miR-210 in diagnosing lung cancer.
Nine studies conducted between 2010 and 2016 involving a total of 993 patients (554 lung cancer patients and 439 non-cancer patients) were included in this meta-analysis. AUC is widely recognized as a useful index for evaluating the accuracy of diagnostic tests; AUCs between 0.5 and 0.7, 0.7 and 0.9, and greater than 0.9 indicate low, moderate, and high diagnostic value, respectively. Here, we found that the area under the SROC curve was 0.80, suggesting that miR-210 has a moderate diagnostic value for lung cancer. The pooled sensitivity and specificity values for all of the studies combined were 0.66 and 0.82, respectively. As shown in Figure 7, assuming a pre-test probability of 78% and a PLR of 4.0, measuring miR-210 expression to diagnose lung cancer would raise the post-test probability to 78%. DOR, a comprehensive evaluation index in diagnostic tests, was used to investigate multiple relationships between chances of obtaining positive and negative results. The pooled DOR was 8.78, indicating that MiR-210 might be a useful diagnostic biomarker for lung cancer. The HSROC model, which was used to further confirm these findings, yielded similar sensitivity (0.66) and specificity (0.82) values. When considered together, these analyses indicate that miR-210 had a moderate accuracy for diagnosing lung cancer.
Although there was significant heterogeneity in sensitivity and specificity in this study, meta-regression did not reveal any factors that accounted for this heterogeneity. We then performed subgroup analyses by country, tumor stage, cancer type, specimen, and normalizer. Although specimen type did not contribute to heterogeneity in meta-regression analysis, in subgroup analysis, blood-based tests yielded a sensitivity and specificity of 0.67 and 0.86, respectively, while sensitivity and specificity of sputum-based tests were 0.66 and 0.81, respectively. This suggests that the diagnostic value of miRNA-210 in blood samples was slightly higher than in sputum samples, which is consistent with previous results [26]. In addition, the diagnostic value of miR-210 might differ depending on cancer stage. In early stages (I–II), the sensitivity, specificity, and DOR were 0.66, 0.83, 9.30, but when stages III-IV were included, the sensitivity, specificity and DOR were 0.62, 0.77, 7.97, respectively (Table 3), suggesting that miR-210 expression might assist in lung cancer diagnosis particularly in early-stage patients. In contrast, previous studies found that miR-210 was a poor prognostic biomarker for lung cancer and was more highly expressed in later stages [21, 27]. However, another study suggested that miR-210 had a positive prognostic impact in lung cancer [28]. Additionally, miR-210 may act as both an oncogene and a tumor suppressor by affecting hypoxia, which in turn influences both cell death and survival [29]. More studies are needed to confirm the prognostic value of miR-210 and its mechanism of action in lung cancer.
Although the diagnostic value of individual miRNAs in lung cancer is limited, many studies have shown that panels of miRNAs or other tumor biomarkers improve diagnostic efficiency. For instance, Xing et al. found that a combination of three miRNAs (sputum miR-21, 31, and 210) yielded an AUC of 0.92, 82.93% sensitivity, and 87.84% specificity, while an miR-210 assay alone resulted in an AUC of 0.85, 75.27% sensitivity, and 85.88% specificity. Similarly, Zhu et al. found that examining a combination of four miRNAs (serum miR-182, miR-183, miR-210, and miR-126) with carcinoembryonic antigen (CEA) levels increased diagnostic value, with an AUC of 0.975, 88.5% sensitivity, and 92.5% specificity. In contrast, the AUC was 0.65, sensitivity was 33.9%, and specificity was 100.0% for miR-210 alone. Thus, examining several biomarkers in a single test might increase the efficiency of lung cancer diagnoses.
The mechanism by which miR-210 up-regulation occurs in lung cancer is not fully understood. Hypoxia might partially explain the association between increased miR-210 expression and lung cancer [29]. The expression of some miRNAs, called hypoxia-regulated miRNAs (HRMs), is related to hypoxia, which is an independent prognostic factor for various tumors. Hypoxia-inducible factor-1 alpha (HIF-1α) and HIF-2α induce the expression of miR- 210, which is an HRM, in both normal and low oxygen-transformed cells [30–31]. miR-210 expression also affects cell cycle progression, cell survival, differentiation, DNA repair, and angiogenesis [29]. The mechanisms through which miR-210 affects tumors require further investigation.
Some important limitations of this meta-analysis should be considered when interpreting the results. First, the number of studies examined was small, and five of the studies were performed in the same institute, perhaps resulting in some duplication of cases. In addition, although all control groups were composed of cancer-free patients, inclusion criteria and baseline data for these groups varied from study to study. Second, any relevant articles that have not yet been published online might have been missed. Finally, due to significant heterogeneity, we could only roughly estimate the value of miR-210 in lung cancer diagnosis in this meta-analysis. In order to fully understand its potential clinical value, more studies are needed to further assess the diagnostic accuracy of miR-210 in different specimens, types, and stages of lung cancer.
In conclusion, we found that miR-210 had a moderate diagnostic value for lung cancer. Although miR- 210 expression alone may not be reliable enough for the clinical detection of lung cancer, panels that incorporate miR-210 along with other miRNAs or biomarkers could improve diagnostic efficiency.
MATERIALS AND METHODS
Search strategy
We systematically searched for articles published prior to April 20, 2016 in the Pubmed, Embase, Web of Knowledge, Cochrane Library, Chinese National Knowledge Infrastructure (CNKI), Chongqing VIP Information, and Wan Fang databases. Search terms were as follows: (“microRNA-210” or “miRNA-210” or “miR-210” or “miR210” or “hsa-mir-210”) and (“lung” or “pulmonary”) and (“neoplasm” or “neoplasms” or “neoplasia” or “cancer” or “cancers” or “carcinoma” or “tumor”). After relevant articles were identified, we examined their cited references to select other relevant articles. Articles were selected without regard to language. Two reviewers (Huqin Yang, Huijuan Wang) independently searched and evaluated the quality of the articles. Any disagreements between the two reviewers were resolved by a third person.
Study selection
Inclusion criteria were as follows: 1) patients with any type of lung cancer; 2) inclusion of data on the diagnostic accuracy of miR-210 for lung cancer; 3) 2 × 2 contingency tables that could be directly extracted or calculated from the articles.
Exclusion criteria were as follows: 1, reviews, meta-analyses, letters, or expert opinions; 2, not related to miR- 210 or lung cancer; 3, not related to diagnostic value; 4) insufficient data.
Data extraction and quality assessment
The following data were extracted from the eligible studies: first author, publication year, country, lung cancer type, stage, sample size, mean age, gender ratio, detection method, normalizer, specimen, sensitivity, specificity, true positive (TP), false negative (FP), false negative (FN), and true negative (TN). If any of these data were not mentioned in the articles, we obtained the missing information by contacting the corresponding authors. Study quality was evaluated according to QUADAS-2 guidelines [32].
Statistical analysis
Statistical analyses were conducted using Stata (Stata Corporation, College Station, TX, USA, version 12.0) and Meta-disc (version 1.4) software. A bivariate random effects regression model was applied to calculate the pooled sensitivity, specificity, DOR, PLR, and NLR [33]. We also established a SROC curve and calculated AUCs and 95% confidence intervals [34]. An HSROC model was then used to confirm those data. Heterogeneity inspection was conducted using Cochran’s Q test and Higgin’s I-squared statistic [35]; an I2 greater than 50% indicated obvious heterogeneity between the studies. To explore heterogeneity, Spearman correlation coefficients and SROC analyses were conducted to determine whether there was a threshold effect. Meta-regression and subgroup analysis were used to explore sources of heterogeneity. Fagan’s nomogram was employed to identify relationships between prior-test probability, likelihood ratio, and post-test probability [36]. Deeks’ funnel plot asymmetry test was used to assess publication bias. In the linear regression test, a p value less than 0.1 indicated potential publication bias in our study [37].
CONFLICTS OF INTEREST
The authors declare no conflicts of interest.
REFERENCES
1. Siegel RL, Miller KD, Jemal A. Cancer statistics, 2016. CA Cancer J Clin. 2016; 66:7–30.
2. McKee BJ, Hashim JA, French RJ, McKee AB, Hesketh PJ, Lamb CR, Williamson C, Flacke S, Wald C. Experience With a CT Screening Program for Individuals at High Risk for Developing Lung Cancer. J Am Coll Radiol. 2016; 13:R8-R13.
3. de Hoop B, Schaefer-Prokop C, Gietema HA, de Jong PA, van Ginneken B, van Klaveren RJ, Prokop M. Screening for lung cancer with digital chest radiography: sensitivity and number of secondary work-up CT examinations. Radiology. 2010; 255:629–637.
4. Reddy KB. MicroRNA (miRNA) in cancer. Cancer Cell Int. 2015; 15:38.
5. Lagos-Quintana M, Rauhut R, Lendeckel W, Tuschl T. Identification of novel genes coding for small expressed RNAs. Science. 2001; 294:853–858.
6. Mraz M, Malinova K, Mayer J, Pospisilova S. MicroRNA isolation and stability in stored RNA samples. Biochem Bioph Res Co. 2009; 390:1–4.
7. Mitchell PS, Parkin RK, Kroh EM, Fritz BR, Wyman SK, Pogosova-Agadjanyan EL, Peterson A, Noteboom J, O’Briant KC, Allen A, Lin DW, Urban N, Drescher CW, et al. Circulating microRNAs as stable blood-based markers for cancer detection. Proc Natl Acad Sci U S A. 2008; 105:10513–10518.
8. Kim JO, Gazala S, Razzak R, Guo L, Ghosh S, Roa WH, Bedard EL. Non-small cell lung cancer detection using microRNA expression profiling of bronchoalveolar lavage fluid and sputum. Anticancer Res. 2015; 35:1873–1880.
9. Hu L, Ai J, Long H, Liu W, Wang X, Zuo Y, Li Y, Wu Q, Deng Y. Integrative microRNA and gene profiling data analysis reveals novel biomarkers and mechanisms for lung cancer. Oncotarget. 2016; 7:8441–8454. doi: 10.18632/oncotarget.7264.
10. Inamura K, Ishikawa Y. MicroRNA In Lung Cancer: Novel Biomarkers and Potential Tools for Treatment. J Clin Med. 2016; 5.
11. Munagala R, Aqil F, Gupta RC. Exosomal miRNAs as biomarkers of recurrent lung cancer. Tumour Biol. 2016.
12. Xing L, Todd NW, Yu L, Fang H, Jiang F. Early detection of squamous cell lung cancer in sputum by a panel of microRNA markers. Mod Pathol. 2010; 23:1157–1164.
13. Zhu W, Zhou K, Zha Y, Chen D, He J, Ma H, Liu X, Le H, Zhang Y. Diagnostic Value of Serum miR-182, miR-183, miR-210, and miR-126 Levels in Patients with Early-Stage Non-Small Cell Lung Cancer. Plos One. 2016; 11:e153046.
14. Xing L, Su J, Guarnera MA, Zhang H, Cai L, Zhou R, Stass SA, Jiang F. Sputum microRNA biomarkers for identifying lung cancer in indeterminate solitary pulmonary nodules. Clin Cancer Res. 2015; 21:484–489.
15. Shen J, Liao J, Guarnera MA, Fang H, Cai L, Stass SA, Jiang F. Analysis of MicroRNAs in sputum to improve computed tomography for lung cancer diagnosis. J Thorac Oncol. 2014; 9:33–40.
16. Li N, Ma J, Guarnera MA, Fang H, Cai L, Jiang F. Digital PCR quantification of miRNAs in sputum for diagnosis of lung cancer. J Cancer Res Clin Oncol. 2014; 140:145–150.
17. Anjuman N, Li N, Guarnera M, Stass SA, Jiang F. Evaluation of lung flute in sputum samples for molecular analysis of lung cancer. Clin Transl Med. 2013; 2:15.
18. Li ZH, Zhang H, Yang ZG, Wen GQ, Cui YB, Shao GG. Prognostic significance of serum microRNA-210 levels in nonsmall-cell lung cancer. J Int Med Res. 2013; 41:1437–1444.
19. Shen J, Liu Z, Todd NW, Zhang H, Liao J, Yu L, Guarnera MA, Li R, Cai L, Zhan M, Jiang F. Diagnosis of lung cancer in individuals with solitary pulmonary nodules by plasma microRNA biomarkers. Bmc Cancer. 2011; 11:374.
20. Shen J, Todd NW, Zhang H, Yu L, Lingxiao X, Mei Y, Guarnera M, Liao J, Chou A, Lu CL, Jiang Z, Fang H, Katz RL, et al. Plasma microRNAs as potential biomarkers for non-small-cell lung cancer. Lab Invest. 2011; 91:579–587.
21. Osugi J, Kimura Y, Owada Y, Inoue T, Watanabe Y, Yamaura T, Fukuhara M, Muto S, Okabe N, Matsumura Y, Hasegawa T, Yonechi A, Hoshino M, et al. Prognostic Impact of Hypoxia-Inducible miRNA-210 in Patients with Lung Adenocarcinoma. J Oncol. 2015; 2015:316745.
22. Stengel D, Bauwens K, Sehouli J, Ekkernkamp A, Porzsolt F. A likelihood ratio approach to meta-analysis of diagnostic studies. J Med Screen. 2003; 10:47–51.
23. Tekcham DS, Tiwari PK. Non-coding RNAs as emerging molecular targets in gallbladder cancer. Gene. 2016.
24. Bertoli G, Cava C, Castiglioni I. MicroRNAs as Biomarkers for Diagnosis, Prognosis and Theranostics in Prostate Cancer. Int J Mol Sci. 2016; 17.
25. Zhao C, Lu F, Chen H, Zhao F, Zhu Z, Zhao X, Chen H. Clinical significance of circulating miRNA detection in lung cancer. Med Oncol. 2016; 33:41.
26. Chen L, Jin H. MicroRNAs as novel biomarkers in the diagnosis of non-small cell lung cancer: a meta-analysis based on 20 studies. Tumour Biol. 2014; 35:9119–9129.
27. Puissegur MP, Mazure NM, Bertero T, Pradelli L, Grosso S, Robbe-Sermesant K, Maurin T, Lebrigand K, Cardinaud B, Hofman V, Fourre S, Magnone V, Ricci JE, et al. miR-210 is overexpressed in late stages of lung cancer and mediates mitochondrial alterations associated with modulation of HIF-1 activity. Cell Death Differ. 2011; 18:465–78.
28. Eilertsen M, Andersen S, Al-Saad S, Richardsen E, Stenvold H, Hald SM, Al-Shibli K, Donnem T, Busund LT, Bremnes RM. Positive prognostic impact of miR-210 in non-small cell lung cancer. Lung Cancer. 2014; 83:272–8.
29. Qin Q, Furong W, Baosheng L. Multiple functions of hypoxia-regulated miR-210 in cancer. J Exp Clin Cancer Res. 2014; 33:50.
30. Devlin C, Greco S, Martelli F, Ivan M: miR-210: More than a silent player in hypoxia. IUBMB life 2011; 63:94–100.
31. Ivan M, Huang X: miR-210: Fine-Tuning the Hypoxic Response. Adv Exp Med Biol. 2014; 772:205–227.
32. Whiting PF, Rutjes AW, Westwood ME, Mallett S, Deeks JJ, Reitsma JB, Leeflang MM, Sterne JA, Bossuyt PM. QUADAS-2: a revised tool for the quality assessment of diagnostic accuracy studies. Ann Intern Med. 2011; 155:529–536.
33. Reitsma JB, Glas AS, Rutjes AW, Scholten RJ, Bossuyt PM, Zwinderman AH. Bivariate analysis of sensitivity and specificity produces informative summary measures in diagnostic reviews. J Clin Epidemiol. 2005; 58:982–990.
34. Hamza TH, Arends LR, van Houwelingen HC, Stijnen T. Multivariate random effects meta-analysis of diagnostic tests with multiple thresholds. Bmc Med Res Methodol. 2009; 9:73.
35. Higgins JP, Thompson SG, Deeks JJ, Altman DG. Measuring inconsistency in meta-analyses. BMJ. 2003; 327:557–560.
36. Fagan TJ. Letter: Nomogram for Bayes theorem. N Engl J Med. 1975; 293:257.
37. Deeks JJ, Macaskill P, Irwig L. The performance of tests of publication bias and other sample size effects in systematic reviews of diagnostic test accuracy was assessed. J Clin Epidemiol. 2005; 58:882–893.