
Introduction
Multiple myeloma (MM) is a malignant plasma cell tumor that is often complicated by bone destruction in clinical practice. Typically, radiological examinations that can identify bone lesions are required by clinicians for further diagnosis, disease staging and response evaluation of MM [1-2]. In the era of new drugs and hemopoietic stem cell transplantation, clinicians are also seeking improved methods for radiological examination of MM [3]. Substantial effort has therefore gone into identifying safe, sensitive, and specific radiological imaging modalities for MM patients.
In recent years, PET/CT, using 18F-FDG as the tracer, has been extensively used in the diagnosis and treatment of various solid tumors and lymphoma. The new 18F-FDG tracer both specifically accumulates within tumors and overcomes the disadvantage of hepatic and renal toxicity that is inherent to conventional tracers, thus supports its extensive use in various patients [4-6]. Therefore, 18F-FDG PET/CT potentially has great diagnostic and prognostic value in the treatment of MM. Compared with conventional X-rays, systemic CT scans are more sensitive at identifying bone lesions and at reducing the misdiagnosis rate of MM; moreover, 18F-FDG uptake in bone lesions appears to be closely related with disease-free survival (DFS) and overall survival (OS) in MM patients [3, 7-10].
There are, however, several issues regarding the use of 18F-FDG PET/CT in the diagnosis and treatment of MM that require further investigation: Firstly, tumor-specific uptake of 18F-FDG allows clear demarcation of MM bone lesions, with the maximum standardized uptake value (SUVmax) being the main index for measuring 18F-FDG uptake in bone lesions [11-12]. However, the validity of using SUVmax appears to be not so tumor-specific, with nervous system tumors for example showing significant inter-individual variation in the SUVmax of 18F-FDG PET/CT [13-14]. It is currently unclear whether there is a better parameter to accurately determine 18F-FDG uptake in MM patients. In order to overcome this dilemma, we added a new index “T/Mmax”, which alleviate the influence of background “noise” by collecting the 18F-FDG uptake by the uptake of mediastinal [13-14]. Secondly while poor molecular karyotype and high LDH in MM patients have previously been associated with high uptake of 18F-FDG [15]—whether such an association with other clinical characteristics exists remains unknown. Thirdly, although 18F-FDG uptake in lesions has been examined in relation to progression-free survival (PFS) and overall survival (OS) after treatment [3, 7-10], the relationship between post-treatment 18F-FDG uptake in lesions and clinical response and disease recurrence remains unknown. Here, in an attempt to determine the relationship between the radiological profile of bone lesions and clinical parameters in MM patients, we prospectively performed 18F-FDG PET/CT scans on 98 newly-diagnosed MM patients and followed their images changes during treatment. Up to now, 34 patients have finished their observation and we observed some interesting results through these cases, by presenting our cases , we hoped we will clarify the value of PET/CT in predicting disease recurrence.
materials and Methods
Subjects
Ninety-eight newly-diagnosed MM patients who were given standardized treatment at the First Affiliated Hospital of Sun Yat-sen University between January 2010 to June 2014 prospectively received PET/CT scans and systemic bone X-rays at the onset of disease and during treatment (Figure 1). were enrolled in this study. Staging criteria for MM were based on IMWG international diagnostic criteria for multiple myeloma [16]. PET/CT scans were also performed on age- and gender-matched healthy volunteers (5 male and 10 female subjects, median age 48, age range 36-72) (Table 1). The baseline uptake range of 18F-FDG in normal bones was established from these 15 volunteers and the average uptake of bone marrow is 1.65 without lesions or fractures. Disease onset data of the 98 MM patients as well as the healthy volunteer are provided in Table 1. This study was approved by the Ethics Committee at the First Affiliated Hospital of Sun Yat-sen University, and all subjects provided written informed consent for this study.
Table 1: Baseline information of the 98 NDMM patients at the onset of disease.
Factor |
N/n, (%) |
Male in healthy volunteer |
10/15(66.67) |
Median age at PET/CT scan in healthy volunteer(yrs) |
48 (36-72) |
Male in MM |
52/98 (53.06) |
Median age at diagnosis (range) (yrs) |
55 (31–72) |
M protein type in MM |
|
IgG |
51/98 (52.04) |
IgA |
13/98 (13.27) |
IgD |
5/98 (5.10) |
Light chain |
29/98 (32.58) |
Durie Salmon stage at diagnosis in MM |
|
Stage 2 |
9/98 (9.18) |
Stage 3 |
89/98 (90.81) |
International Staging System at diagnosis in MM |
|
Stage 1 |
40/98(40.82) |
Stage 2 |
43/98 (43.88) |
Stage 3 |
15/8 ( 15.30) |
Serum Creatinie > 2 mg/dl at diagnosis in MM |
28/98 (28.57) |
FISH at diagnosis in MM |
|
Del 17p |
11/72 (15.28) |
T(14:16) |
0/72 (0) |
T(4:14) |
9/72 (12.50 ) |
T(11:14) |
11/72 (15.28) |
1q21 |
30/72 (41.67) |
Complex karyotype or hypokaryotype in MM |
21/72 (29.17) |
Abbreviations: n, number of total cases; N, number of cases; %, percentage; PET/CT, positron emission tomography/Computed tomography; MM, multiple myeloma; FISH, fluorescence in situ hybridization; mSMART, Mayo Stratification for Myeloma And Risk-adapted Therapy.
Therapeutic regimen, treatment response evaluation and follow-up
34 patients in observation completed chemotherapies of bortezomib and dexamethasone combined with PEGylated liposomal doxorubicin (PAD regimen). The detailed chemotherapeutic regimen was as follows: 1.3 mg/m2 bortezomib i.v. bolus over 3 seconds on days 1, 4, 8 and 11; 20 mg/d dexamethasone, i.v. drip on days 1-4; and 40 mg/m2 PAD, i.v. drip on day 4. MM patients without renal insufficiency were treated with cyclophosphamide +granulocyte colony stimulating factor for mobilization of peripheral blood hematopoietic stem cells, and collection of stem cells were performed after achieving best response, after which patients received autologous hematopoietic stem cell transplantation (ASCT). The pretreatment regimen for ASCT was 200 mg/m2 i.v. drip melphalan. For patients with renal insufficiency, hematopoietic stem cells were collected directly from bone marrow, and the pretreatment regimen was adjusted to 100-140 mg/m2 melphalan i.v. drip according to patients’ glomerular filtration rate. Maintenance therapy was initiated soon after hematopoietic recovery, which consisted of thalidomide, lenalidomide, interferon-α alone or thalidomide combined with interferon-α. MM patient responses were evaluated according to EBMT response evaluation criteria (Table 3) [17].
Table 2: Comparison of the lesion detection rate in different bone areas
PET/CT |
Systemic bone X-ray |
P |
|
Skull |
68.37% |
54.08% |
0.020 |
Vertebral body |
86.73% |
51.02% |
<0.001 |
Thorax |
79.59% |
52.04% |
<0.001 |
Pelvic |
80.61% |
44.90% |
<0.001 |
Extremities |
63.27% |
54.08% |
0.096 |
PET/CT
The research strictly followed the process of Figure 1. 18F-FDG was prepared using a GE PETtracer cyclotron and automatic synthesis system, and the radiochemical purity was > 95%. Systemic PET scans were performed with a PET/CT scanner (Gemini GXL, Philips). CT scans were used for anatomical location and decay correction. After fasting for at least 6 hours, patients were injected with 18F-FDG (259-444 MBq) i.v. through a three-limb tube after which patients were instructed to lie still for 60 minutes in a dark room, which was followed by a PET/CT scan after urination. PET scans included an emission and projection scan, at a rate of 4-5 minutes/bed and 3-4 minutes/bed, respectively. CT scans were performed at a voltage of 140 kV, current 200 mA, thread pitch 0.75 and the rotation time of each cycle was 0.8 s. The PET and CT images were processed using eNTEGRA workstation (Siemens, Germany).
Table 3: EBMT for response
Complete response |
No M-protein detected in serum or urine by immunofixation for a minimum of 6 weeks and fewer than 5% plasma cells in bone marrow |
Partial response |
>50% reduction in serum M-protein level and/or 90% reduction in urine free light chain excretion or reduction to <200 mg/24 h for 6 weeks |
Minimal response |
25–49% reduction in serum M-protein level and/or 50–89% reduction in urine free light chain excretion which still exceeds 200 mg/24 h for 6 weeks |
No change |
Not meeting the criteria of either minimal response or progressive disease |
Plateau |
No evidence of continuing myeloma-related organ or tissue damage <25% change M-protein levels and light chain excretion for 3 months |
Progressive disease |
Myeloma-related organ or tissue damage continuing despite therapy or its re-appearance in plateau phase >25% increase in serum M-protein level (>5 g/l) and/or >25% increase in urine M-protein level (>200 mg/24 h and/or >25% increase in bone marrow plasma cells (at least 10% in absolute terms) |
Relapse |
Reappearance of disease in patients previously in CR, including detection of paraprotein by immunofixation |
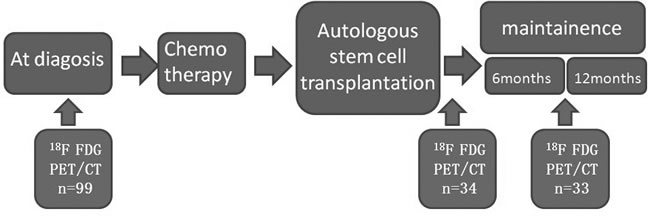
Figure 1: The process of the prospective design.
All radioactive concentrated lesions on PET images were independently reviewed by 2 experienced nuclear medicine physicians, who were blinded to patient clinical data. If the 2 physicians disagreed on the evaluation of an image, the 18F-FDG PET/CT image scan was reviewed again, discussed, and analyzed until consensus was reached.
Destructive bone lesions were assessed using IMWG criteria [18], and once diagnosed, the lesions were anayalyzed by eNTEGRA workstation of its maximum 18F-FDG uptake. If no pathologically concentrated lesions occurred after treatment, lesions displaying concentrated 18F-FDG uptake prior to treatment were selected for SUVmax measurements. None of the patients had mediastinal disease or mediastinal tumor infiltration, and the SUVmax of the mediastinum was therefore measured at the same time as 18F-FDG uptake in normal tissues for this 18F-FDG PET/CT scan. T/Mmax was defined as the ratio of SUVmax in lesions to SUVmax in the mediastinum (T/Mmax = SUVmax in bone or tissue lesions / SUVmax in mediastinum).
Statistical analysis
Receiver operating characteristic (ROC) curves were used to determine the accuracy, sensitivity and specificity of T/Mmax for the detection of lesions in MM patients. Wilcoxon rank-sum test was used to analyze the difference in SUVmax and T/Mmax between MM patients with different clinical characteristics, and Pearson’s chi-square test was used to compare the incidence of extramedullary lesions in MM patients with different clinical characteristics. Survival analysis was performed based on PFS, OS, SUVmax and T/Mmax of lesions in MM patients. PFS was defined as the time from the start of consolidation or maintenance treatment to disease progression or recurrence. OS was defined as the time from the onset of disease to the time of death from any cause. The Kaplan-Meier method was used for survival analysis. SPSS 19.0 software (SPSS Inc.; Tokyo, Japan) was used for all the statistical analyses. Results of P < 0.05 were deemed statistically significant.
Results
PET/CTPET/CT characteristics in newly-diagnosed MM patients
Patients with newly diagnosed MM have higher 18F-FDG uptake in bone destructive lesions than healthy controls, with higher uptake in extramedullary lesions than intramedullary lesions
No statistical difference was found in age or gender composition between the 15 healthy volunteers and the 98 patients with newly diagnosed MM (P > 0.05). Bone SUVmax in the healthy volunteers was 1.70 ± 0.42 (95%CI 1.47-1.93) and bone T/Mmax was 1.29 ± 0.27 (95%CI 1.14-1.44).
The sensitivity and specificity of SUVmax and T/Mmax in evaluating bone lesions in MM were compared using ROC curves, and both methods showed good differentiation ability between normal and pathological bone marrow (P < 0.001) (Figure 2). For the detection of intramedullary lesions, SUVmax had an accuracy of measuring bone lesions of 87.3% with a cutoff of 1.95, sensitivity of 80.6% and specificity of 86.7%; meanwhile, T/Mmax had an accuracy, cutoff, sensitivity and specificity of 82.0%, 1.69, 65.3% and 100.0%, respectively.
Both SUVmax and T/Mmax were higher in bone destructive lesions in MM patients than in healthy controls (SUVmax: 3.20 vs. 1.65, P < 0.001; T/Mmax: 2.11 vs. 1.19, P < 0.001). 29 of 98 patients with newly diagnosed MM had extramedullary lesions (identified from PET/CT scans), and plasmacytoma was confirmed by biopsy at pathological lesions. In the 29 patients, the median SUVmax and median T/Mmax was higher in extramedullary lesions than in bone destructive lesions (SUVmax: 4.60 vs. 3.50, P = 0.024; T/Mmax: 3.21 vs. 2.60, P = 0.023).
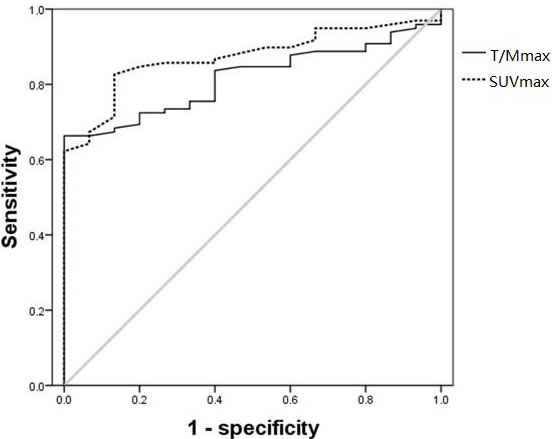
Figure 2: ROC curves of SUVmax and T/Mmax in lesions in 98 MM patients with 15 healthy volunteers as control. The accuracy, cutoff, sensitivity and specificity were 87.3%, 1.95, 80.6% and 86.7% for SUVmax, respectively; and 82.0%, 1.69, 65.3% and 100.0% for T/Mmax, respectively.
Increased detection of bone lesions and extramedullary lesions by PET/CT compared with systemic bone X-rays in newly diagnosed MM patients
Various bone lesions were identified in all 98 MM patients through PET/CT scans, including osteolytic changes or pathological bone fractures in 96 patients and extensive osteoporosis in 2 patients. However, when using systemic bone X-rays, only 82 patients were identified as having bone lesions, including osteolytic changes or pathological bone fractures in 77 patients and extensive osteoporosis in 5 patients. The bone lesion detection rate by PET/CT was significantly higher than by systemic bone X-ray in newly diagnosed MM patients (100.00% vs. 83.67%, P < 0.001); in particular the detection rate of osteolytic changes or pathological bone fractures (97.96% vs. 78.57%, P < 0.001).
Bone lesions in MM patients were classified as belonging to 1 of 5 areas: skull, vertebral body, thoracic bone, pelvis or 4 limbs. The cumulative range of bone lesion involvement was evaluated based on these 5 areas. The median range of bone lesion involvement was 4 areas/case by PET/CT, compared with 3 areas/case by systemic bone X-ray, and this difference was significant (P < 0.001). Further analysis demonstrated a higher rate of bone lesion detection in the skull, vertebral body, thoracic bone and pelvis by PET/CT compared with systemic bone X-ray (Table 2, P < 0.05). There was however no significant difference in the detection rate of lesions in the 4 limbs between the 2 radiological methods (Table 2, P = 0.096).
Twenty-nine of 98 patients with newly diagnosed MM had extramedullary lesions (identified from PET/CT scans), however, using systemic bone X-rays, the extramedullary lesions were identified only in 6 patients, which demonstrates the significantly higher detection rate of extramedullary lesions by PET/CT than X-rays (29.59% vs. 6.12%, P < 0.001). The detection of parabone soft tissue masses in these 29 patients was also significantly higher by PET/CT where 24 parabone soft tissue masses were detected compared with only 6 by systemic bone X-rays (24.49% vs. 6.12%, P < 0.001); further, the 5 extramedullary lesions that were non-parabone masses (3 abdominal masses, 1 muscle tissue mass in 4 limbs, 1 joint soft tissue mass), could not be detected by systemic bone X-ray (5.10% vs. 0.00%, P = 0.012).
Correlation between 18F-FDG uptake and clinical parameters in patients with newly diagnosed MM
Subgroup analysis was performed to evaluate 18F-FDG uptake in bone destructive lesions in relation to prognostic and clinical parameters at the onset of disease in the 98 patients with newly diagnosed MM (Table 3). Our analysis revealed that at the onset of disease, patients < 50 years of age, patients have free immunoglobulin light chains circulating in serum, patients with extramedullary infiltration, patients with hemoglobuliln (Hb) ≥ 120 g/L, and patients with increased LDH had higher SUVmax and T/Mmax scores than the relative groups (P < 0.05). On the other hand, The SUVmax and T/Mmax has no statistically significant differences between different M protein level and β2-MG levels groups, though M protein level and β2-MG levels were believed closely connected with tumor burden.
Patients with lower hemoglobin levels had lower SUVmax and T/Mmax scores (P < 0.01). Patients with Hb ≤ 60 g/L had higher levels of M protein, β2-MG, and LDH than those with Hb > 60 g/L (P < 0.01), indicating increased tumor burden in MM patients with severe anemia. Based on the previously reported impact of hemoglobin levels on the SUV of lesions detected by 15O oxyhemoglobin PET/CT [19], our findings suggested that hemoglobin levels might influence 18F-FDG uptake and present false positive results in PET/CT-based evaluation in MM patients. Thus patients were grouped based on their hemoglobin levels at the onset of disease, while excluding patients with Hb ≤ 60 g/L. Each clinical parameter indicative of prognosis at the onset of disease was then assessed in relation to 18F-FDG uptake in bone destructive lesions in the 92 patients with Hb > 60 g/L (Table 4). At the onset of disease, patients < 50 years of age, patients have free immunoglobulin light chains circulating in serum, patients have extramedullary infiltration, patients have higher M protein levels, patients have > 20% plasma cells in the bone marrow smear, β2-MG > 3.5 mg/L, hypercalcemia and increased LDH had higher SUVmax and T/Mmax scores (P < 0.05). Therefore, after excluding the influence of severe anemia, SUVmax and T/Mmax in bone lesions by PET/CT were correlated with multiple parameters indicative of tumor burden in patients with newly diagnosed MM.
Table 4:The relationship between clinical characteristics and 18F-FDG uptake in lesions in 92 cases of newly-diagnosed MM patients with Hb>60g/L
Factor |
Bone lesion area (Median, Quartile) |
SUVmax (Median, Quartile) |
T/Mmax (Median, Quartile) |
Extramedually rate(%) |
Sex |
||||
Male (n=49) |
4.00(3.00-5.00) |
3.30(2.35-5.00) |
2.27(1.47-3.23) |
30.61 |
Female (n=43) |
4.00(2.00-5.00) |
3.20(2.00-4.50) |
2.11(1.62-2.69) |
32.56 |
Age |
||||
<50yrs (n=35) |
4.00(3.00-5.00) |
4.30(2.50-5.90)* |
2.53(1.82-4.25)* |
31.43 |
≥50yrs (n=57) |
5.00(3.00-5.00) |
2.70(2.15-4.00) |
2.08(1.42-2.61) |
31.58 |
DS stage |
||||
Stage 2 (n=9) |
1.00(1.00-2.00)** |
2.00(1.65-4.10)* |
1.70(1.39-2.40) |
11.11 |
Stage 3 (n=83) |
5.00(3.00-5.00) |
3.30(2.20-5.00) |
2.21(1.58-3.05) |
33.73 |
ISS stage |
||||
Stage 1 (n=40) |
5.00(3.25-5.00) |
3.30(1.92-5.14) |
2.56(1.53-4.10) |
45.00 |
Stage 2 (n=41) |
4.00(3.00-5.00) |
2.90(2.35-4.50) |
2.10(1.47-2.83) |
24.39 |
Stage 3 (n=11) |
4.00(2.00-5.00) |
3.90(3.20-4.80) |
2.28(1.73-2.91) |
9.09** |
M protein type |
||||
IgG (n=48) |
4.00(3.00-5.00) |
2.68(2.13-4.18) |
1.78(1.37-2.59) |
33.33 |
IgA (n=11) |
4.00(3.00-5.00) |
2.70(2.00-3.20) |
2.20(1.68-2.50) |
18.18 |
Light chain (n=29) |
5.00(3.00-5.00) |
5.00(2.95-6.15)** |
2.60(2.02-3.99)** |
37.93 |
IgD (n=4) |
3.50(1.50-4.75) |
3.43(3.01-6.43) |
2.83(2.23-3.88) |
0.00 |
Amylodosis |
||||
Yes (n=5) |
3.00(1.50-4.50) |
2.60(1.95-3.58) |
1.73(1.06-3.28) |
0.00** |
No (n=87) |
4.00(3.00-5.00) |
3.20(2.20-5.00) |
2.20(1.58-3.03) |
33.33 |
Extramedual lesion |
||||
Yes (n=29) |
5.00(3.50-5.00)** |
3.50(2.55-5.75)* |
2.60(1.93-4.60)** |
100.00** |
No (n=69) |
4.00(3.00-5.00) |
3.20(2.10-4.50) |
2.08(1.37-2.63) |
0.00 |
M protein |
||||
high level (n=24) |
4.00(3.00-5.00) |
3.80(2.55-5.49)* |
2.59(2.10-4.23)* |
37.50 |
low level (n=68) |
5.00(3.00-5.00) |
2.90(2.00-4.45) |
2.08(1.48-2.68) |
29.41 |
Plasma cell percentage |
||||
>20% (n=46) |
5.00(3.00-5.00) |
3.75(2.15-5.98)** |
2.42(1.53-4.20)** |
36.96 |
≤20%(n=46) |
4.00(3.00-5.00) |
2.70(2.20-4.23) |
2.08(1.57-2.65) |
26.09 |
β2-MG |
||||
<3.5mg/L (n=57) |
4.00(3.00-5.00) |
2.85(1.99-4.50)* |
2.12(1.37-3.35)* |
35.09 |
≥3.5mg/L (n=35) |
5.00(3.00-5.00) |
4.50(2.50-7.20) |
2.92(1.67-5.25) |
25.71 |
Renal impairment |
||||
Yes (n=22) |
4.00(3.00-5.00) |
3.85(2.70-4.85) |
2.33(1.90-2.75) |
22.73 |
No (n=70) |
4.00(3.00-5.00) |
2.90(2.08-5.03) |
2.11(1.47-3.15) |
34.29 |
Hypercalcemia |
||||
Yes (n=14) |
5.00(3.75-5.00) |
4.15(3.23-5.95)* |
2.65(2.11-2.98)* |
35.71 |
No (n=78) |
4.00(3.00-5.00) |
3.05(2.08-4.58) |
2.09(1.45-3.04) |
30.77 |
Hypoalbuminemia |
||||
Yes (n=36) |
4.00(2.25-5.00) |
3.20(2.28-4.43) |
2.08(1.47-2.88) |
19.44* |
No (n=56) |
5.00(3.00-5.00) |
3.40(2.00-5.14) |
2.29(1.61-3.05) |
39.29 |
LDH |
||||
High (n=23) |
5.00(3.00-5.00) |
4.20(2.70-6.30)* |
2.50(1.67-5.25)* |
43.48 |
Normal (n=69) |
4.00(3.00-5.00) |
2.90(2.10-4.50) |
2.08(1.42-2.83) |
27.54 |
Footnote: *: P<0.05 between groups, **: P<0.01 between groups.
Correlation between 18F-FDG uptake and molecular biological and cytogenetic profiles in patients with newly-diagnosed MM
We performed CD138 magnetic bead sorting, FISH, and chromosome karyotype analysis on bone marrow cells at the onset of disease for 72 patients to determine their molecular and cytogenetic profiles. A subgroup analysis was performed comparing the molecular biological profiles in relation to 18F-FDG uptake in bone destructive lesions at the onset of disease (Table 5). Patients with p53 mutations, hypoploid, or complicated karyotypes had higher T/Mmax scores in bone lesions (P = 0.002, P = 0.031, respectively), and patients with p53 gene mutations had a higher incidence of extramedullary lesions than patients with normal p53 status (P < 0.001). Moreover, patients with t(11;14) chromosomal translocation gene mutations had lower SUVmax scores in bone lesions (P = 0.017), and none of these patients had extramedullary lesions. Overall, high-risk MM patients—defined by specific molecular (p53 mutations) and cytogenetic (hypoploid or complicated karyotypes) risk markers—had higher T/Mmax (P < 0.01, Figure 3), and a higher incidence of extramedullary lesions (75.00% vs. 18.33%, P < 0.01).
Table 5: The relationship between molecular biology and cytogenetic changes and the 18F-FDG uptake in lesions in 72 cases of newly diagnosed MM patients
Factor |
Bone lesion area (Median, Quartile) |
SUVmax (Median, Quartile) |
T/Mmax (Median, Quartile) |
Extramedually rate(%) |
P53 |
||||
Positive (n=11) |
5.00(3.00-5.00) |
3.40(2.70-6.30) |
2.62(2.08-5.25)** |
72.73** |
Negative (n=61) |
4.00(2.00-5.00) |
2.70(2.00-4.35) |
1.73(1.37-2.40) |
19.67 |
T(4:14) |
||||
Positive (n=9) |
5.00(3.00-5.00) |
2.90(2.45-4.15) |
1.71(1.64-2.24) |
33.33 |
Negative (n=63) |
4.00(3.00-5.00) |
2.90(2.00-4.50) |
2.07(1.47-2.63) |
26.98 |
T(11:14) |
||||
Positive (n=11) |
3.00(2.00-4.00)* |
2.50(1.60-3.90) |
1.67(1.06-2.63) |
0.00** |
Negative (n=61) |
5.00(3.00-5.00) |
2.90(2.20-4.50) |
2.08(1.57-2.56) |
32.79 |
1q21 |
||||
Positive (n=30) |
5.00(3.00-5.00) |
2.70(1.90-4.28) |
1.98(1.59-2.32) |
26.67 |
Negative (n=42) |
4.00(2.75-5.00) |
3.20(2.15-4.63) |
2.07(1.45-2.94) |
28.57 |
karyotype |
||||
Complex karyotype or hypodiploidy (n=21) |
3.00(3.00-5.00) |
3.80(2.63-5.00) |
2.28(1.84-2.98)* |
28.57 |
Normal (n=50) |
5.00(3.00-5.00) |
2.70(1.90-4.23) |
1.76(1.36-2.47) |
26.00 |
Trisomies (n=1) |
3.00 |
1.90 |
1.58 |
100.00 |
Footnote: *: P<0.05 between groups, **: P<0.01 between groups.
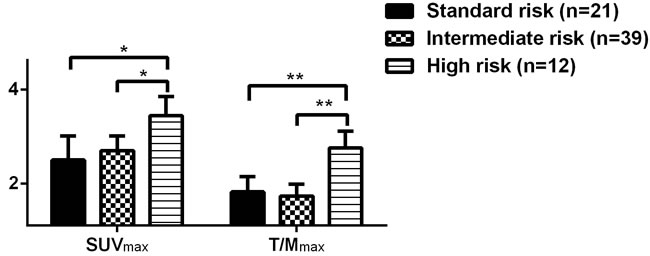
Figure 3: Comparison of 18F-FDG uptake in patients with newly-diagnosed MM at different molecular biological risks
The value of PET/CT in MM treatment response evaluation
Decreased uptake of 18F-FDG in lesions of MM patients with continued treatment
Changes in 18F-FDG uptake on PET/CT was dynamically analyzed prior to, after PAD regimen treatment, and within 6 and 12 months after ASCT in 34 MM patients. With continued treatment 18F-FDG uptake tended to decrease (Figure 4), even in certain MM patients who had achieved CR in the early part of their treatment (Figure 5).
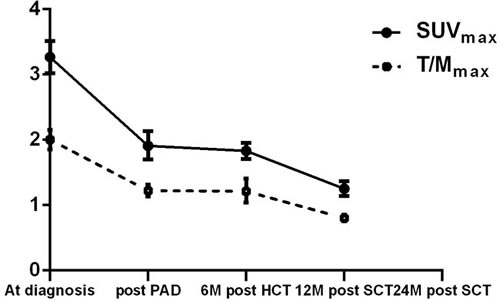
Figure 4: Dynamic changes in the uptake of 18F-FDG in lesions during treatment in the 34 MM patients
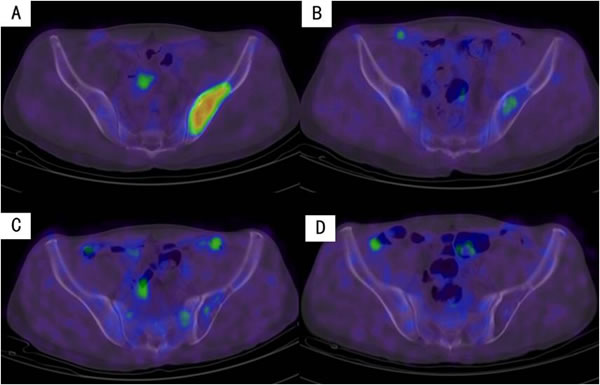
Figure 5: Decreased uptake of 18F-FDG in the iliac bone with continued treatment in an MM patient. A. On diagnosis. B. After PAD regimen. C. Six months after transplantation. D. Twelve months after transplantation.
Correlation between 18F-FDG uptake in lesions and clinical response in MM patients
Of the 34 patients receiving the PAD regimen, 15 achieved CR after chemotherapy, 14 achieved near complete remission (nCR) and 5 achieved partial remission (PR). The decrease in 18F-FDG uptake was more pronounced in MM patients with CR after chemotherapy compared with the rest of the patients, but this difference was not statistically significant (P > 0.05, Figure 6).
A subgroup analysis was performed based on the decrease in 18F-FDG uptake after chemotherapy in MM patients, and there was no significant difference in 18F-FDG uptake in patients with different responses (Table 3).
In 5 of the 15 MM patients with CR after chemotherapy, 18F-FDG uptake in lesions was still not reduced to normal levels, and in 4 of these 5 patients it was reduced to normal half a year after ASCT; the remaining patient had IgD-κ MM and a p53 gene mutation detected at the onset of disease and this patient was therefore given thalidomide and interferon for maintenance therapy after transplantation, and 18F-FDG uptake was reduced to normal one year after ASCT.
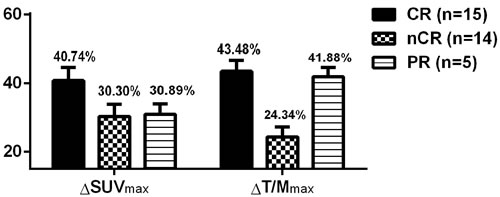
Figure 6: Comparison of the decrease in 18F-FDG uptake after chemotherapy in MM patients with different responses.
Correlation between 18F-FDG uptake, OS and PFS in MM patients after chemotherapy
The median follow-up time for the 34 patients receiving the PAD regimen was 16.63 months (4.97-33.33 months), during which one patient had disease progression approximately 5.73 months after chemotherapy, and this patient died after 7.92 months. No disease progression or deaths were recorded for any of the other patients during the follow-up period. A subgroup analysis indicated that the expected median PFS and OS was longer in MM patients in whom 18F-FDG uptake was reduced to normal after chemotherapy (P < 0.05) (Figure 7).
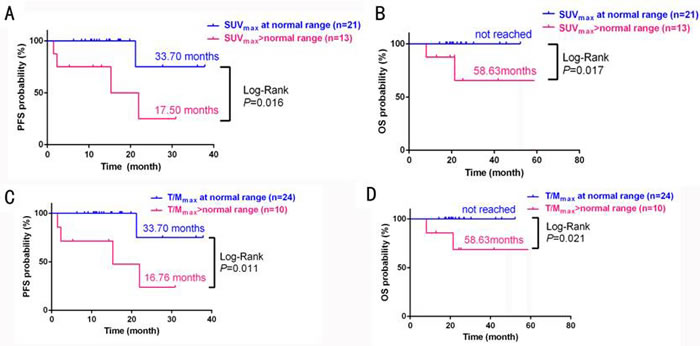
Figure 7: Survival analysis in MM patients who had normal or above-normal SUVmax (A: PFS, B: OS); or T/Mmax (C: PFS, D: OS) at end of PAD chemotherapy treatment.
The value of PET/CT in MM recurrence prediction
Of the 34 MM patients receiving the PAD regimen, 18F-FDG uptake increased in the bone lesions of 4 patients during treatment (Table 6). Only 1 of these 4 patients had disease progression during the follow-up period.
Patient 1 had Hb of 54 g/L and a 1q21 gene mutation at disease onset. This patient achieved CR after 4 rounds of chemotherapy, and Hb increased to 120 g/L. Six months after transplantation, his Hb rise to 124 g/L and the patient was still in CR at the last follow-up date.
Patient 2 had MM recurrence and an IgH/FGFR gene mutation at disease onset. After 2 rounds of chemotherapy this patient achieved nCR, and the repeated 18F-FDG PET/CT indicated that although SUVmax had decreased compared with before treatment, T/Mmax was significantly increased; no myeloma-related chemotherapy was administered after re-examination. Two weeks later, multiple subcutaneous soft tissue masses were detected and a repeated 18F-FDG PET/CT indicated that SUVmax had increased from 6.6 to 8.4 and T/Mmax to increased from 5.5 to 7, respectively. Plasmacytoma was confirmed by biopsy. The patient was subsequently treated with the PAD chemotherapeutic regimen but did not respond well, and died 7.92 months after the onset of disease.
Patient 3 achieved nCR after chemotherapy and CR upon reexamination 1 month after ASCT. This patient had a mass sized 3 cm × 3 cm × 1.5 cm in the right elbow with surface ulceration 11 months after transplantation. The biopsy indicated inflammation, and the mass was reduced after anti-inflammatory therapy. Re-examination 12 months after ASCT showed a clinical response of CR despite increased uptake of 18F-FDG.
Patient 4 achieved nCR after chemotherapy and CR upon reexamination 1 month after ASCT. However, the patient discontinued treatment 5 months after transplantation due to intolerable side effects and reexamination 6 months after ASCT showed a clinical response of CR despite increased uptake of 18F-FDG.
Table 6: Clinical data in MM patients with increased uptake of 18F-FDG in lesions after treatment
No. |
Age (yrs) |
Sex |
Immunological pattern |
DS |
ISS |
Efficacy |
Onset lesions SUVmax T/Mmax |
Post-chemotherapy lesions SUVmax T/Mmax |
Lesions half a year after transplantation SUVmax T/Mmax |
Lesions one year after transplantation SUVmax T/Mmax |
Post-transplantation Visit time (months) |
Status |
1 |
66 |
M |
IgA-κ |
3 |
2 |
CR |
SUVmax 1.9 T/Mmax 1.1 |
SUVmax 2.1 T/Mmax1.8 |
SUVmax 2.5 T/Mmax 1.4 |
/ |
8.3 |
CR |
2 |
57 |
F |
IgG-κ |
3 |
3 |
nCR |
SUVmax 4.2 T/Mmax 1.6 |
SUVmax 3.3 T/Mmax 3.7 |
/ |
/ |
/ |
Died |
3 |
48 |
F |
IgA-κ |
2 |
1 |
nCR |
SUVmax 2.0 T/Mmax 2.5 |
SUVmax 1.7 T/Mmax 0.9 |
SUVmax 1.1 T/Mmax 0.7 |
SUVmax 2.3 T/Mmax 1.3 |
18.3 |
CR |
4 |
46 |
M |
IgG-κ |
3 |
2 |
CR: |
SUVmax 4.5 T/Mmax 2.1 |
SUVmax 0.8 T/Mmax 0.8 |
SUVmax 2.3 T/MVmax 1.0 |
/ |
11.8 |
CR |
Discussion
In this study, we used both SUVmax and T/Mmax to assess 18F-FDG uptake in lesions from 98 newly diagnosed MM patients with 18F-FDG PET/CT scans. Both indexes performed well at differentiating MM bone lesions from healthy controls. Although T/Mmax had a low sensitivity of 65.3% in finding out lesions, its specificity was 100%, indicating that T/Mmax is also better than SUVmax for judging treatment response. Subsequent studies by our group also confirmed that T/Mmax had a similar role to SUVmax in assessing treatment response, PFS and OS; however, as the cases in the study in limited, more case studies are required to confirm this conclusion.
Our study demonstrated that 18F-FDG PET/CT has greater sensitivity in detecting bone lesions (in patients with newly diagnosed MM) compared with systemic bone X-rays, in identifying extramedullary infiltration lesions, and that it is a valuable tool for the diagnosis of MM; these results are in agreement with previous studies[1-3, 7-11].
In addition to demonstrating the increased sensitivity of 18F-FDG PET/CT in detecting bone lesions, 18F-FDG PET/CT could also be used to evaluate prognosis. One study found that if patients had lesion with SUVmax> 4.2 at the onset of the disease, he or she had shorter DFS and OS. The result indicates that the metabolic profile in bone lesions is closely related to prognosis [22]. From a clinicopathological perspective, 18F-FDG uptake in lesions was associated with tumor burden and tumor cell mutations of P53. Clinically, M protein levels, the proportion of tumor cells, β2-MG, and LDH are commonly used to assess disease burden in MM patients. Our research find that high M protein levels, a proportion of plasma cells > 20% in bone marrow smear, β2-MG > 3.5mg/L, hypercalcemia at the onset of disease, and increased LDH were associated with increased 18F-FDG uptake in MM patients. This interesting finding indicates 18F-FDG uptake in bone lesions is related to tumor burden, and it may have more appliances than just diagnosis. Moreover, younger age at diseases onset, patients have free immunoglobulin light chains circulating in serum, patients with extramedullary infiltration, patients with high-risk molecular features and poor karyotype were indicators of poor prognosis independent of tumor burden in MM patients.
Another discovery in surprise is that we found several influence factors of PET/CT scan which were not mentioned by others before. A series of studies indicated a correlation between high 18F-FDG uptake and the severity of MM [21]. Opposite to our expectation, we found patients with lower hemoglobin levels had lower 18F-FDG uptake in lesions. Anemia is a common complication of MM, which means greater tumor burden and poor prognosis in patients. However, our study showed low hemoglobin levels and red blood cell counts were associated with low 18F-FDG uptake in MM patients. The metabolism of lesions is reportedly affected by hemoglobin levels and red blood cell counts on PET/CT scans using 15O-deoxyhemoglobin as the tracer [21]. Similarly, 18F-FDG PET/CT uses glucose metabolism as the tracing target, and red blood cells are one of the most important sites of glucose metabolism; we therefore speculate that hemoglobin levels and red blood cell counts could affect 18F-FDG uptake in lesions, in which case 18F-FDG uptake might be underestimated in patients with severe anemia. Physicians should therefore take into account hemoglobin levels and red blood cell counts when interpreting 18F-FDG uptake in lesions of MM patients in clinical practice.
With regards to MM treatment response evaluation, PET/CT also has practical value: 34 MM patients with similar M protein levels showed no differences in the dynamic radiological examination, 18F-FDG uptake showed its priority in detecting minimal tumor residual changes in continued treatment. We even detected metabolically active bone lesions in certain MM patients who had achieved CR by 18F-FDG PET/CT, and found that 18F-FDG uptake could be further decreased in these lesions with continued treatment. This demonstrates the value of using 18F-FDG PET/CT for treatment response evaluation, even beyond CR. We also demonstrated that MM patients with 18F-FDG uptake that reduced to normal after chemotherapy had longer PFS and OS and that PET/CT has certain value in evaluating short- and long-term therapeutic response. Tumor burden might be underestimated if treatment response was estimated based on the maximum 18F-FDG uptake of a single lesion. And in these patients, the appliance of Whole body MRI may show its priority[22].
We attempted to seek early parameters indicative of clinical recurrence based on the change in 18F-FDG uptake in MM patients. However, the increased 18F-FDG uptake after treatment was not necessarily associated with recurrence based on the current data. Only 1 of 4 MM patients who had increased 18F-FDG uptake after treatment had clinical recurrence, and the remaining 3 patients were still in CR at last follow-up. This result indicates that increased 18F-FDG uptake in lesions in MM patients might be related to hemoglobin levels and infection, and cannot simply be used for predicting disease progression or recurrence.
In summary, the new parameter T/Mmax should be applied to interpret lesions in MM patients and the impact of hemoglobin levels should be taken into consideration when interpreting the results from 18F-FDG PET/CT. Accurate interpretation of 18F-FDG results may greatly aid MM diagnosis, and evaluation of prognosis and treatment response. However, further study is required to establish the significance of this test for predicting disease recurrence.
ConflictS of Interest
There is no conflict of interest.
GRANT Support
This study is supported by Program of National Key Clinical Specialties, Natural Science Foundation of Guangdong Province, China (S2013010016838) and a grant from the Sci-Tech Program Foundation Guangdong Province (No.2013B021800118).
References
1. Kyle RA, Rajkumar SV. Criteria for diagnosis, staging, risk stratification and response assessment of multiple myeloma. Leukemia. 2009; 23:3-9.
2. Sirohi B, Powles R. Multiple myeloma. Lancet 2004; 363:875-87.
3. Durie BG. The role of anatomic and functional staging in myeloma:description of Durie/Salmon plus staging system. Eur J Cancer. 2006; 42:1539-1543.
4. Berkowitz A, Basu S, Srinivas S, Sankaran S, Schuster S, Alavi A. Determination of whole-body metabolic burden as a quantitative measure of disease activity in lymphoma: a novel approach with fluorodeoxyglucose-PET. Nucl Med Commun. 2008; 29:521-526.
5. Cazaentre T, Morschhauser F, Vermandel M, Betrouni N, Prangère T, Steinling M, Huglo D. Pre-therapy 18F-FDG PET quantitative parameters help in predicting the response to radioimmunotherapy in non-Hodgkin lymphoma. Eur J Nucl Med Mol Imaging. 2010; 37:494-504.
6. Benz MR, Allen-Auerbach MS, Eilber FC, Chen HJ, Dry S, Phelps ME, Czernin J, Weber WA. Combined assessment of metabolic and volumetric changes for assessment of tumor response in patients with soft-tissue sarcomas. J Nucl Med. 2008; 49:1579-1584.
7. Zamagni E, Nanni C, Castellucci P, Geatti O, Tosi P, Tacchetti P, Cangini D, Perrone G, Ceccolini M, Brioli A, Buttignol S, Fanin R, Salizzoni E, et al. A prospective comparison of 18F-fluorodeoxyglucose positron emission tomography-computed tomography, magnetic resonance imaging and whole-body planar radiographs in the assessment of bone disease in newly diagnosed multiple myeloma. Haematologica. 2007; 92:50-55.
8. Fonti R, Larobina M, Del Vecchio S, De Luca S, Fabbricini R, Catalano L, Pane F, Salvatore M, Pace L. Metabolic tumor volume assessed by 18F-FDG PET/CT for the prediction of outcome in patients with multiple myeloma. J Nucl Med. 2012; 53:1829-1835.
9. Philippe Moreau. PET-CT in MM:a new definition of CR. Blood. 2011; 118:5984 -5985.
10. Derlin T, Weber C, Habermann CR, Herrmann J, Wisotzki C, Ayuk F, Wolschke C, Klutmann S, Kröger N. 18F-FDG PET/CT for detection and localization of residual or recurrent disease in patients with multiple myeloma after stem cell transplantation. Eur J Nucl Med Mol Imaging. 2012; 39:493-500.
11. Agarwal A, Chirindel A, Shah BA, Subramaniam RM. Evolving role of FDG PET/CT in multiple myeloma imaging and management. AJR Am J Roentgenol. 2013 Apr;200:884-90.
12. Makino K, Hirai T, Nakamura H, Murakami R, Kitajima M, Shigematsu Y, Nakashima R, Shiraishi S, Uetani H, Iwashita K, Akter M, Yamashita Y, Kuratsu J. Does adding FDG-PET to MRI improve the differentiation between primary cerebral lymphoma and glioblastoma? Observer performance study. Ann Nucl Med. 2011; 25:432-8.
13. Mohile NA, Deangelis LM, Abrey LE. Utility of brain FDG-PET in primary CNS lymphoma. Clin Adv Hematol Oncol. 2008; 6:818-20.
14. Hustinx R, Smith RJ, Benard F, Bhatnagar A, Alavi A. Can the standardized uptake value characterize primary brain tumors on FDG-PET? Eur J Nucl Med. 1999; 26:1501-9.
15. Rosenfeld SS, Hoffman JM, Coleman RE, Glantz MJ, Hanson MW, Schold SC. Studies of primary central nervous system lymphoma with fluorine-18-fluorodeoxyglucose positron emission tomography. J Nucl Med. 1992; 33:532-6.
16. Waheed S, Mitchell A, Usmani S, Epstein J, Yaccoby S, Nair B, van Hemert R, Angtuaco E, Brown T, Bartel T, McDonald J, Anaissie E, van Rhee F, et al. Standard and novel imaging methods for multiple myeloma: correlates with prognostic laboratory variables including gene expression profiling data. Haematologica. 2013; 98:71-8
17. Dimopoulos M, Kyle R, Fermand JP, Rajkumar SV, San Miguel J, Chanan-Khan A, Ludwig H, Joshua D, Mehta J, Gertz M, Avet-Loiseau H, Beksaç M, Anderson KC, et al. Consensus recommendations for standard investigative workup: report of the International Myeloma Workshop Consensus Panel 3. Blood. 2011; 117:4701-4705.
18. Bladé J, Samson D, Reece D, Apperley J, Björkstrand B, Gahrton G, Gertz M, Giralt S, Jagannath S, Vesole D. Criteria for evaluating disease response and progression in patients with multiple myeloma treated by high-dose therapy and haemopoietic stem cell transplantation. Myeloma Subcommittee of the EBMT. European Group for Blood and Marrow Transplant. Br J Haematol. 1998; 102:1115-1123.
19. Durie BG. Use of bisphosphonates in multiple myeloma:IMWG response to Mayo Clinic consensus statement. Mayo Clin Proc. 2007; 82:516-517.
20. Iida H, Iguchi S, Teramoto N, Koshino K, Zeniya T, Yamamoto A, Kudomi N, Moriguchi T, Hori Y, Enmi J, Kawashima H, Joni Shah N, Nakagawara J. Adequacy of a compartment model for CMRO2 quantitation using 15O-labeled oxygen and PET: a clearance measurement of 15O-radioactivity following intracarotid bolus injection of 15O-labeled oxyhemoglobin on Macaca fascicularis. Journal of Cerebral Blood Flow & Metabolism. 2014; 34:1434-1439.
21. Zamagni E, Patriarca F, Nanni C, Zannetti B, Englaro E, Pezzi A, Tacchetti P, Buttignol S, Perrone G, Brioli A, Pantani L, Terragna C, Carobolante F, et al. Prognostic relevance of 18-F FDG PET/CT in newly diagnosed multiple myeloma patients treated with up-front autologous transplantation. Blood. 2011; 118:5989-5995.
22. Terpos E, Dimopoulos MA, Moulopoulos LA. The Role of Imaging in the Treatment of Patients With Multiple Myeloma in 2016. Am Soc Clin Oncol Educ Book. 2016;35:e407-417.