
Introduction
LIN28A is a microRNA-regulating protein linked to a variety of cancers, including breast, prostate, and gastic carcinoma [1-4]. LIN28A and its homolog LIN28B are expressed in human tumors that are poorly differentiated and carry the worst prognosis [5, 6]. The primary known targets of LIN28A and the related protein LIN28B are the let-7 family of tumor suppressing microRNAs.
These microRNAs suppress the translation of critical mediators of stemness, proliferation, and invasion such as KRAS, c-MYC, and HMGA2 [7-10]. Over-activation of LIN28A or LIN28B is one mechanism by which cancer cells can eliminate let-7 microRNAs and allow for increased expression of pro-oncogenic signals [5]. HMGA2 is a stem cell factor that promotes the invasiveness of cancer cells [11, 12]. HMGA2 directly binds to the promoter and regulates the pro-invasion transcription factor SNAI1 (SNAIL) as well as other pro-invasion targets [13, 14].
LIN28A expression is high during the early stages of neural tube development and decreases over time [15]. Recent papers have described increased expression of LIN28A in primitive neuro-ectodermal tumors and atypical teratoid rhaboid tumors, which are aggressive pediatric brain tumors [16, 17]. However, the functional role of LIN28A in brain neoplasms has not been explored. The established role of LIN28A in neural development and the importance of NF1/RAS/MEK/ERK and MYC signaling in GBM led us to hypothesize that LIN28A would promote GBM tumorigenesis. In this study we use human primary tumor samples, GBM-derived human cell lines and human neural stem cells to investigate the role of LIN28A in malignant gliomas in vitro and in vivo.
Results
LIN28A and LIN28B are expressed in human glioma samples
To investigate the potential role of LIN28A in gliomas, we examined LIN28A protein by immunohistochemistry in tissue microarrays (TMA) containing human glioma and GBM samples, including 20 astrocytomas (WHO grade II), 20 anaplastic astrocytomas (WHO grade III, AA), 35 pediatric glioblastoma (WHO grade IV, pGBM) and 64 adult glioblastoma (WHO grade IV, aGBM). We confirmed the specificity of the antibody by showing that LIN28A was present only in mouse testis spermatagonia and not more mature germ cells, as previously reported [30] (Figure 1A). We did not detect LIN28A expression in normal human brain (Figure 1B). All grades of glioma expressed LIN28A with varying intensity of immunostaining (Figure 1C-F). Positive reactivity was observed in 15% of grade II astrocytoma, 25% of grade III anaplastic astroctyoma, 23% of pediatric GBM and 44% of adult GBM. Most of the LIN28A-positive tissue samples showed moderate intensity staining, but approximately 5% of cases showed strong reactivity. Analysis of primary pediatric and adult GBM by qPCR showed that a subset (42%) expressed mRNA levels of LIN28A or the related gene LIN28B in excess of normal brain (Figure 1G). Only one tumor expressed both LIN28A and LIN28B at levels greater than normal brain.
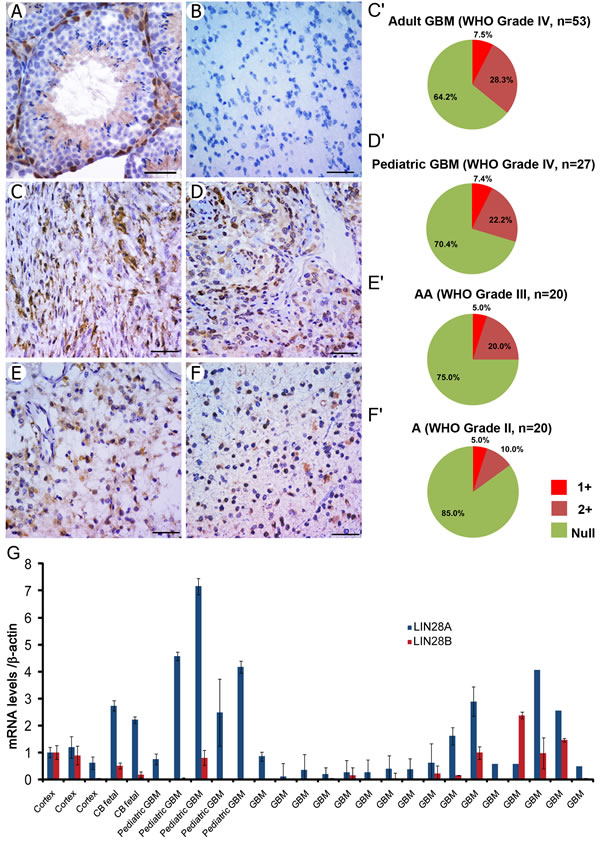
Figure 1: LIN28A protein is expressed in human primary glioma samples, with highest expression in GBM and anaplastic astrocytoma. LIN28A expression in glioma tissue microarrays was determined by immunohistochemistry. A. Positive control for LIN28A expression in mouse testis (400X magnification). The basal spermatogonia are positive, but more mature cells and supporting cells in the testis are negative. B. LIN28A protein is not detected in normal human adult brain tissue (400X). C-F. LIN28A protein is expressed at strong or moderate levels in approximately 40 percent of adult GBM (400X, C and pie chart C’), 25 percent of pediatric GBM (400X, D, pie chart D’), 25 percent of WHO grade III anaplastic astrocytoma (400X, E, pie chart E’) and 15 percent of WHO grade II astrocytoma (400X, F;F’). Bar= 50 µm. G. LIN28A and LIN28B mRNA levels in primary GBM samples detected by qPCR, showing that a subset of adult and pediatric GBM express LIN28A or LIN28B.Normal adult human cortex and fetal human cerebellum (CB) samples are included at left for comparison.
LIN28A expression positively correlates in GBM with the stem cell and pro-invasion factors HMGA2 and SNAI1 and the stem cell factor OCT4
To further quantify LIN28A and LIN28B expression in high-grade gliomas, we expanded our evaluation of GBM to include The Cancer Genome Atlas (TCGA) dataset containing more than 500 GBM samples. In TCGA data, similar to our mRNA analysis of local samples, a subset of GBM express LIN28A or LIN28B. However, neither LIN28A nor LIN28B expression segregated within any of the TCGA GBM subgroupings (Figure 2A). Although both LIN28A and LIN28B were correlated at the mRNA level with the stem cell factor OCT4, only LIN28A positively correlated with expression of the neural stem cell factor SOX2 (Figure 2B). When we stained our 80 tumor tissue microarray for SOX2 and LIN28A, we determined that there was no correlation between positivity for LIN28A and SOX2 at the protein level (p=0.58, Pearson correlation) (Figure 2C). We also did not observe any positive correlation between LIN28A and LIN28B and MYC at the mRNA level in TCGA dataset or by IHC between LIN28A and MYC on our 80 GBM tumor tissue microarray (Figure 2B, 2C).
In contrast, we did observe statistically significant positive correlations in TCGA dataset between LIN28A or LIN28B and the stem cell and pro-invasion factors HMGA2 and SNAI1 (Figure 2D). There was a negative correlation between LIN28B and the HMGA2 suppressing microRNA let-7b (Figure 2E). In total, 18 percent of GBM in TCGA dataset show increased expression of LIN28A, LIN28B or the LIN28A/LIN28B regulated gene HMGA2.
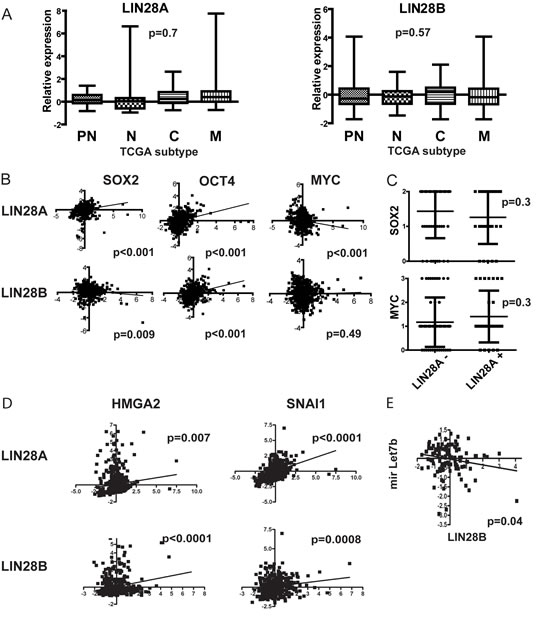
Figure 2: Interrogation of The Cancer Genome Atlas (TCGA) dataset of more than 500 GBM tumors shows that LIN28A and LIN28B are associated with a pro-invasive program and also with some cancer stem cell genes. A. Box-and-whisker plots of TCGA subsets shows that LIN28A and LIN28B expression is highly variable across GBM and is not associated with any particular GBM subtype. P values are as determined by ANOVA with multiple comparisons correction. PN= proneural, N= neural, C= classical, M = mesenchymal. B. At the mRNA level, within the TCGA dataset, there is a positive correlation between LIN28A expression (x-axis) and the expression of the neural stem cell markers SOX2 and OCT4 (y-axis). Although there is a similar positive correlation between LIN28B and OCT4, there is a negative correlation between LIN28B and SOX2. There is a negative correlation between LIN28A expression and MYC and no significant correlation between LIN28B and MYC. The correlation of expression values was determined using Pearson’s correlation coefficient. C. Vertical dot plot analysis of a tissue microarray of 80 pediatric and adult GBM for LIN28A, MYC and SOX2 protein expression by immunohistochemistry shows no significant clustering of SOX2 or MYC expression in tumors expressing LIN28A. D. Analysis of TCGA data shows correlation of LIN28A and LIN28B (x-axis)with the stem cell and pro-invasion factors HMGA2 and SNAI1 (y-axis). E. There is an inverse correlation between LIN28B and let7b expression.
Knockdown of LIN28A in GBM cell lines decreases invasion, proliferation and clonogenicity
To investigate the importance of LIN28A in GBM, we performed LIN28A knockdown with LIN28A-shRNA lentivirus in lines derived from pediatric (SF188) and adult GBM (HSR-GBM1 and JHH-GBM14). LIN28A-shRNA effectively decreased expression of LIN28A as measured by western blot in SF188 (Figure 3A). LIN28A knockdown in SF188 cells led to a more than 40% decrease in invasion as measured by transwell invasion assay (Figure 3B, C).
In adult GBM, LIN28A-shRNA decreased LIN28A mRNA by approximately 85% in HSR-GBM1, and 93% in JHH-GBM14 compared to empty vector and non-targeting scramble shRNA as determined by qPCR (Figure 3D). The growth of HSR-GBM1 and JHH-GBM14 was significantly inhibited after LIN28A knockdown as demonstrated by MTS assays (Figure 3E-G). Soft agarose assay was performed to examine the clonogenic potential of HSR-GBM1 after LIN28A knockdown. HSR-GBM1 LIN28A-shRNA transduced cells formed significantly fewer colonies in soft agarose compared to control GBM1 pLKO empty-vector and GBM1-scramble transduced cells. (Figure 3H, I; p<0.05 by ANOVA).
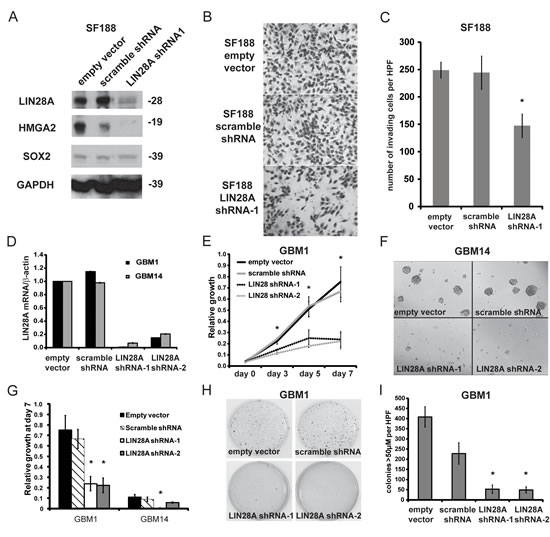
Figure 3: Knockdown of LIN28A in GBM neurosphere cell lines inhibits their invasion, growth and colony formation. A. Short-term infection of the SF188 pediatric GBM cell line with lentiviral LIN28A-shRNA leads to efficient knockdown of LIN28A protein expression compared to control pLKO (empty vector) and scramble-shRNA constructs. The let-7 regulated, pro-invasion factor HMGA2 is also downregulated, but the neural stem cell factor SOX2 is not affected by suppression of LIN28A knockdown. B. Photomicrographs of Matrigel Boyden chamber invasion assay showing that lentiviral LIN28A-shRNA suppresses the invasion of SF188 cells compared to control pLKO or scramble-shRNA constructs. Power = 200X. C. Quantification of a representative experiment. Student’s t-test * = p<0.005, pLKO or scramble shRNA versus LIN28A-shRNA. Results were repeated twice more with similar findings. D. LIN28A-shRNA leads to decreased LIN28A mRNA levels in HSR-GBM1 and JHH-GBM14 compared to empty vector or scramble shRNA. E. MTS assay showing that LIN28A knockdown by shRNA infection in HSR-GBM1 leads to decreased growth. Asterisks indicate p< 0.05 by one way ANOVA compared to control pLKO and scramble. F. Representative images of neurospheres from the MTS assay at day 7 showing that LIN28A knockdown in JHH-GBM14 leads to decreased neurosphere size. G. Quantification of MTS assay at day 7 showing that LIN28A knockdown in both HSR-GBM1 and JHH-GBM14 decreases the growth of these cell lines. ANOVA, *p<0.05 compared to empty vector and scramble. H. Representative wells of soft agarose assay comparing HSR-GBM1 empty vector and scramble shRNA to two LIN28A-specific shRNAs, showing decreased colony formation in LIN28A-shRNA transduced cells. I. Quantification of colony numbers shown in H, demonstrating that LIN28A knockdown in HSR-GBM1 significantly inhibits colony formation in soft agarose. ANOVA, *p<0.05 compared to HSR-GBM1-empty vector and GBM1-scramble.
Expression of LIN28A in GBM neurosphere cell lines promotes tumor formation in vivo
Next we tested if expression of LIN28A would promote xenograft tumor formation in GBM neurosphere cell lines. We chose two human GBM cell lines, 040622 [19] and JHH-GBM14 [20], which are poorly tumorigenic after orthotopic injection into immunodeficient mice, and infected them with LIN28A lentivirus or GFP control. Expression of LIN28A was confirmed by western blotting (Figure 4A, Supplemental Figure 1A).
These cells were injected into the brains of nude mice to test their tumorigenicity. Within one month of injection of 040622-LIN28A, large tumors formed in all mice (n= 5), while 040622-GFP mice (n=5) did not show signs of tumor formation at that time (p= 0.0079, Fisher’s exact test) (Supplemental figure 1B). After 3 months, 040622-GFP injected mice remained asymptomatic. These mice were sacrificed and 100 percent had small, non-invasive tumors.
For JHH-GBM14, both GFP and LIN28A injected groups were sacrificed four months after intracranial injection to examine tumor formation. We identified large, invasive brain tumors in 6/8 (75%) of JHH- GBM-14 LIN28A injected animals, while control JHH-GBM-14-GFP injected animals had small tumors in 2/7 (20%) of injected animals (Figure 4B). The JHH-GBM-14 LIN28A tumors were substantially bigger than control tumors (Figure 4B, C). In addition to forming brain tumors larger than JHH-GBM14-GFP controls, JHH-GBM14-LIN28A tumors significantly invaded into normal tissues including the corpus callosum and the contralateral brain hemisphere (Figure 4B). These tumors expressed LIN28A, were SOX2, Nestin and GFAP positive and Synaptophysin negative, indicating that their immunoprofile remained consistent with GBM phenotype (Supplemental Figure 1C). In an in vitro correlate of the in vivo findings, more JHH-GBM14-LIN28A cells migrated and invaded through Matrigel in a transwell chamber assay than control JHH-GBM14-GFP cells (Figure 4D).
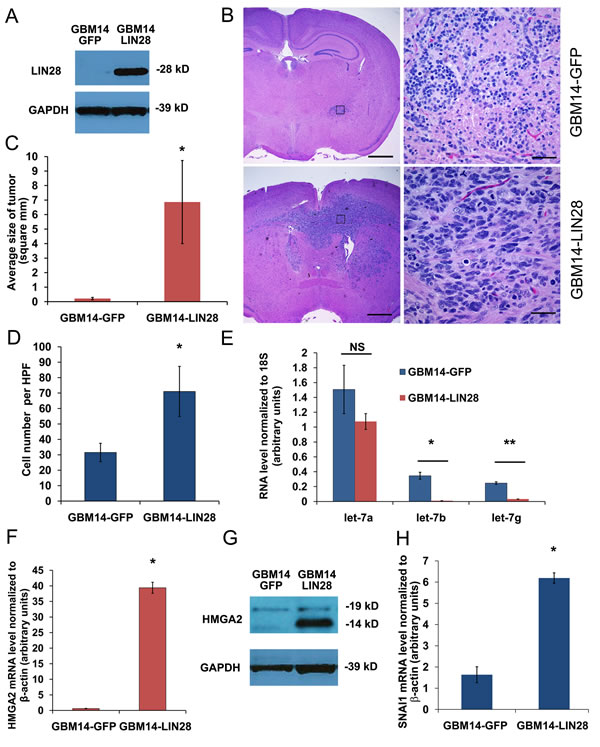
Figure 4: Introduction of LIN28A into the JHH-GBM14 stem cell line activates a pro-invasion program and promotes tumor formation in vivo. A. Western blot showing increased LIN28A expression in GBM14 infected with LIN28A lentivirus. B. Low power (40X) magnification showing increased tumor size of a representative JHH-GBM14-LIN28A xenograft (bottom panels) compared to control JHH-GBM14-GFP xenograft (top panels). C. Quantification of tumor size based on largest diameter in two dimensions. Asterisk p=0.056 Student’s t-test. D. Quantification of Matrigel Boyden chamber invasion assay showing increased invasiveness of JHH-GBM14-LIN28A compared to JHH-GBM14-GFP control. Asterisk = p<0.05 Student’s t-test. E. qPCR showing that let-7b and let-7g, but not let-7a, are downregulated in JHH-GBM14-LIN28A compared to JHH-GBM14-GFP control. F. qPCR showing that HMGA2 mRNA is increased in JHH-GBM14-LIN28A compared to JHH-GBM14-GFP control. G. Western blot showing that HMGA2 protein is increased in JHH-GBM14-LIN28A compared to JHH-GBM14-GFP control. H. qPCR showing increased mRNA expression of SNAI1 in JHH-GBM14-LIN28A compared to JHH-GBM14-GFP control.
To investigate the potential mechanisms of LIN28A-induced tumorigenicity, we detected the expression levels of let-7 microRNA and known let-7 targets in JHH-GBM14-LIN28A and JHH-GBM14-GFP. Levels of let-7b and let-7g decreased in LIN28A-transduced cells, compared to GFP controls (Figure 4E), while let-7a levels did not change significantly. HMGA2, a known let-7 target, was upregulated in GBM14-LIN28A (Figure 4F, G) compared to GBM14-GFP. We examined the expression of genes involved in promoting invasion, and we identified increased SNAI1, a zinc finger transcription factor and key regulator of invasion, in JHH-GBM14-LIN28A cells compared to JHH- GBM14-GFP (Figure 4H). Transduction of GBM14-LIN28A cells with mature let-7g led to reversal of the invasive phenotype and a corresponding downregulation of HMGA2 (Figure 5A-D).
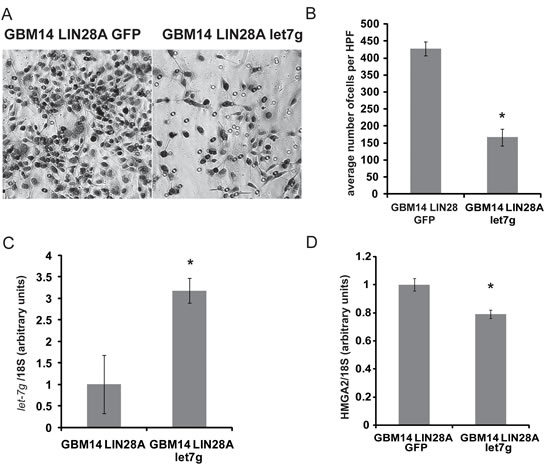
Figure 5: Expression of mature let-7g can reverse the pro-invasive phenotype of LIN28A expressing GBM14 cells. GBM14 LIN28A expressing cells were nucleofected with either GFP or let7g expression plasmids and 48 hours later were placed into a Boyden transwell migration chamber. A. High power view (200X) of migrated cells 48 hours after plating in the upper chamber shows decreased migration in GBM14/LIN28A/let-7g expressing cells (right) compared to GBM14/LIN28A/GFP expressing cells left. B. Graph showing quantification of migration. Asterisk = p<0.0005 Student’s t-test GBM14/LIN28A/let-7g versus GBM14/LIN28A/GFP. C. qPCR showing increased expression of let-7g in let-7g-nucleofected cells compared to GFP-nucleofected cells. Asterisk = p<0.01, Student’s t-test GBM14/LIN28A/let-7g versus GBM14/LIN28A/GFP. D. qPCR showing decreased expression of HMGA2 in let-7g-nucleofected cells compared to GFP-nucleofected cells. Asterisk = p<0.01, Student’s t-test GBM14/LIN28A/let-7g versus GBM14/LIN28A/GFP.
LIN28A facilitates KRAS-mediated transformation of human neural stem cells
We further examined if LIN28A in conjunction with other oncogenes could transform normal cells growing in culture. We infected cortex-derived human neural stem cells (hNSC) with lentiviruses encoding LIN28A together with dominant negative R248WTP53, constitutively active KRAS (CA-KRAS) and hTERT (hereafter referred to as hNSC- LIN28A/DNp53/hTERT/KRAS), all of which are known to be oncogenic elements in GBM [31-33]. As controls, hNSC were also infected with DNp53/hTERT/KRAS, LIN28A/DNp53/hTERT, DNp53/hTERT, or with GFP. Compared to control normal hNSCs, LIN28A/DNp53/hTERT/KRAS transduced hNSCs had increased LIN28A, TP53, and phospho-MAPK expression by western blot (Figure 6A) and increased hTERT and KRAS expression by qPCR (Supplmental figure 2A, B). Lentivirus transduced hNSCs continued to express the stem cell markers CD133, SOX2, Nestin and OLIG2 (Figure 6B). These cells proliferated at an increased rate (7.9 and 9.6% BrdU positive cells examining two separate subclones) compared to control normal cortex-derived hNSCs (Figure 6C, 2.7±1.6% BrdU positive cells, p<0.05 Student’s t-tests comparing separate clones to control hNSC).
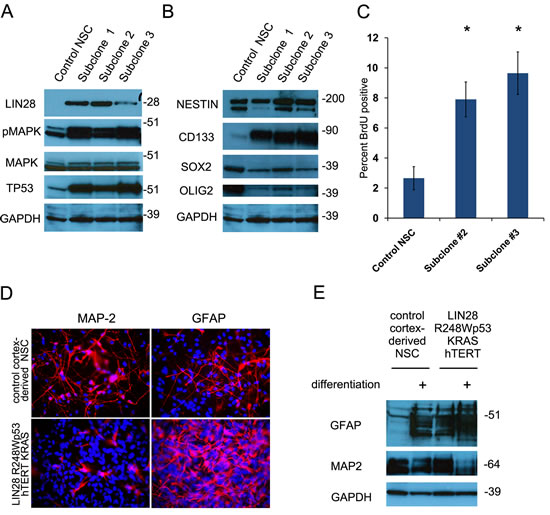
Figure 6: Transduction of human neural stem cells with LIN28A and other oncogenic elements promotes proliferation and disrupts normal differentiation. A. Western blot showing increased expression of LIN28A, TP53 and increased phospho-MAP kinase expression in human neural stem cells transduced with lentiviruses containing R248WTP53, CA-KRAS, hTERT and LIN28A. B. Western blot showing continued expression of neural stem cell markers such as CD133, SOX2, OLIG2, and Nestin by hNSC-DNp53/hTERT/KRAS/LIN28A. C. hNSC-DNp53/hTERT/KRAS/LIN28A show increased proliferation compared to normal hNSC as determined by BrdU incorporation assay (7.9 and 9.6% BrdU positive cells in two separate subclones) compared to normal hNSCs (2.7±1.6% BrdU positive cells, p<0.05 Student’s t-test). D. Immunofluorescence photomicrograph showing that after differentiation in 2% serum medium for 14 days, hNSC DNp53/hTERT/KRAS/LIN28A cells exhibit increased expression of the glial marker GFAP and decreased expression of the neuronal marker MAP2, compared to control cortical hNSC. E. Western blot showing that hNSC-DNp53/hTERT/KRAS/LIN28A cells express more glial marker GFAP at baseline and after differenentiation, compared to control cortical neural stem cells. There is a corresponding decrease in MAP2 expression after differentiation, consistent with the changes observed in the immunofluorescence images in D.
Because a failure to differentiate properly is a hallmark of cancer cells, we compared the differentiation potential of LIN28A/DNp53/hTERT/KRAS hNSC to that of normal cortex-derived hNSC. When differentiated in 2% serum medium, LIN28A/DNp53/hTERT/KRAS hNSCs had increased expression of the glial marker GFAP and decreased expression of the neuronal marker MAP2, as shown by immunofluorescence and western blot (Figure 6 D,E). We also observed a baseline bias toward glial differentiation as evidenced by the first panels on the western blot, which show that even under non-differentiating conditions, that LIN28A/DNp53/hTERT/KRAS hNSC have significant glial differentiation. This is consistent with findings in DNp53/hTERT hNSC, which similarly showed bias toward glial differentiation (Supplemental Figure 2 C, D), compared to control GFP-transduced cortex-derived hNSCs.
To verify the role of LIN28A in the transformation of hNSCs, we tested the tumorigenicity in vivo of the LIN28A/DNp53/hTERT/KRAS expressing hNSCs and the hNSCs controls expressing DNp53/hTERT/KRAS, DNp53/hTERT/LIN28A, DNp53/hTERT, or GFP. Interestingly, DNp53/hTERT/KRAS cultures proliferated very poorly after infection, and we were unable to obtain sufficient cells for further study. Approximately eight weeks after orthotopic xenograft intracranial injection, 66.7% (12 of 18) of the mice injected with hNSC-LIN28A/DNp53/hTERT/ KRAS developed invasive brain tumors with glial phenotype (Figure 7A-F). In contrast, control injections including hNSC-DNp53/hTERT (10 mice), hNSC-LIN28A/DNp53/hTERT (5 mice) and hNSC-GFP (15 mice) did not generate tumors over 6 months (Figure 6G) (p=0.0003, Chi square hNSC-LIN28A/DNp53/hTERT/KRAS versus hNSC-GFP). Immunohistochemistry using human-specific SOX2 antibody identified tumor cells invading far into the normal mouse brain parenchyma (Figure 7A-D). Immunohistochemistry of hNSCs-LIN28A/DNp53/hTERT/KRAS xenografts showed LIN28A expression, activated pMAPK and accumulated TP53 (Supplemental Figure 3). These xenografts were positive for Nestin and GFAP and negative for Synaptophysin and exhibited increased proliferation as revealed by Ki67 staining (Figure 7 E, F and supplemental Figure 3). By qPCR, LIN28A/DNp53/hTERT/KRAS transduced neurospheres expressed more HMGA2 mRNA than control GFP-transduced neurospheres (Figure 7H).
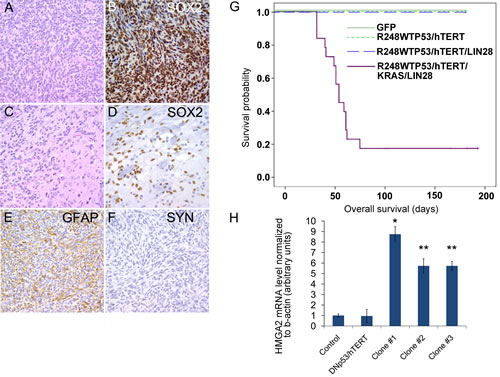
Figure 7: LIN28A promotes the transformation of human neural stem cells by dominant-negative TP53, constitutively active KRAS, and hTERT. A. Hematoxylin and eosin stain of glial tumor formed by hNSC-DNp53/hTERT/KRAS/LIN28. B. Tumor xenografts formed by NSC-DNp53/hTERT/KRAS/LIN28A are positive for human specific SOX2 antibody by immunohistochemistry. C. Hematoxylin and eosin stain showing invasion of tumor (left) into surrounding brain parenchyma (right). D. Human specific SOX2 antibody identifies tumor cells invading deep into normal brain. E. Tumors are positive for GFAP by immunohistochemistry. F. Tumors are negative for Synaptophysin. 400X magnification for all images. G. Lethal glial tumors rapidly form in mice intracranially injected with hNSC-DNp53/hTERT/KRAS/LIN28A, while mice injected with control hNSC-GFP, hNSC-DNp53/hTERT or hNSC-DNp53/hTERT/LIN28A do not form tumors. Survival curve showing the decreased survival of mice injected with NSC-DNp53/hTERT/KRAS/LIN28A compared to controls. H. qPCR showing increased expression of HMGA2 in NSC-DNp53/hTERT/KRAS/LIN28A, compared to control normal cortical neurospheres or NSC-DNp53/hTERT. Asterisk = ** p<0.01 versus control cortex and DNp53/hTERT hNSC, * p<0.05 versus control cortex and DNp53/hTERT hNSC by ANOVA.
The lack of growth of hNSC after infection with DNp53/hTERT/KRAS implies LIN28A may play a facilitative role during the transformation of hNSCs. To further test this hypothesis, we used LIN28A-shRNA lentivirus to knock down LIN28A in hNSCs expressing LIN28A/DNP53/hTERT/KRAS. Strikingly, compared to empty vector or scramble shRNA, the cells infected with LIN28A-shRNA stopped proliferating, and we could not obtain enough cells for further study, consistent with the observation that hNSC- DNp53/hTERT/KRAS are not viable in long -term culture. The addition of LIN28A to DNp53/hTERT/KRAS appears to be a key element permitting in vitro proliferation and in vitro tumor formation in cells with high-level activation of the KRAS/MAP kinase pathway.
Discussion
The identification of pluripotency factors such as SOX2, OCT4, KLF4 and LIN28A in human cancer suggests a close relationship between tumor formation and the process of reprogramming mature cells to a more primitive type [1, 34]. Our findings that LIN28A is expressed in GBM and can facilitate and enhance tumor formation of GBM neurosphere cell lines further support the oncogenic potential of somatic cell reprogramming factors [1, 35]. The LIN28A homologue LIN28B promotes tumorigenicity in liver, ovarian, and colon progenitors and cancer cell lines [5, 36-38]. LIN28A is expressed in other CNS tumors, such as PNET, germ cell tumors and atypical teratoid rhabdoid tumors [6, 16, 17]. Our identification of LIN28A and LIN28B expression in a subset of GBM suggests a role for these reprogramming factors in GBM primary tumors.
In loss-of-function experiments, we demonstrate an on-going requirement of GBM cells for LIN28A to mediate invasion and growth. In gain-of-function experiments, expression of LIN28A in weakly tumorigenic GBM cell lines led to increased tumor formation and tumor size in vivo and increased GBM invasion in vitro. Increased tumorigenicity and invasion with increased LIN28A expression can be explained mechanistically by down-regulation of let-7 microRNAs and up-regulation of let-7 targets such as HMGA2, a chromatin modifying gene that is associated with numerous cancers [11, 12]. Consistent with these results, overexpression of let-7g can inhibit the proliferation of GBM neurosphere cell lines in vitro [39]. In our studies, expression of mature let-7g in LIN28A transduced GBM cells led to a decrease in HMGA2 and reversed the LIN28A-mediated invasive phenotype in vitro.
HMGA2 is expressed in the developing brain and in neural stem cells, where it functions to suppress p16INK4a [40]. The pygmy spontaneous genetic mouse mutant is deficient in HMGA2 [41], and constitutive overexpression of LIN28A leads to mice of increased size (“mighty” mice) [42]. Human tall stature is associated with polymorphisms in HMGA2 [43], suggesting a link between LIN28A, let-7 microRNAs, and HMGA2 and generalized growth. Consistent with this, we observe upregulation of HMGA2 in GBM cell lines and neural stem cells after LIN28A expression.
In diverse cancers, HMGA2 promotes tumor invasiveness through activation of genes that suppress cell adhesion and promote migration [11, 12]. One well-known HMGA2 target is SNAI1, a zinc finger transcription factor which represses cell adhesion genes and promotes invasion [44]. Recently, the closely related transcription factor SNAI2/SLUG was found to be upregulated in a subset of GBM compared to normal brain and to promote invasion of GBM cells [45]. SNAI1 inhibition can decrease invasion and migration of glioblastoma cells in vitro [46]. SNAI1 can also cooperate with Hedgehog (SHH) and MYCN to bring about transformation of cerebellar neural precursor cells [47]. We observed increased SNAI1 expression in GBM cell lines after forced expression of LIN28A. The corresponding decrease in expression of let-7b and let-7g after LIN28A expression suggests that increased LIN28A suppresses let-7 microRNAs and de-represses HMGA2, which is then able to activate a program of increased pro-invasion genes, such as SNAI1. However, it is likely that LIN28A, as a master regulator of multiple microRNAs and downstream genes, can drive GBM tumorigenesis through a variety of mechanisms [15].
Most reports studying the transformation of neural stem cells have used mouse models or mouse-derived NSCs. Given the differences between the mouse and human central nervous system [48], we chose to use human NSCs to model the role of LIN28A in human GBM tumor formation. We introduced LIN28A together with a set of mutations commonly found in human primary GBM, including R248WTP53, CA-KRAS, hTERT into normal hNSC. This combination formed invasive tumors with evidence of glial differentiation, phenocopying GBM. While LIN28A/DNp53 /hTERT/KRAS hNSC rapidly formed aggressive orthotopic xenograft tumors, hNSC-DNP53/hTERT/KRAS did not survive in culture despite multiple attempts, and negative controls including hNSC-DNp53/hTERT, hNSC-LIN28A/DNp53/hTERT and hNSC-GFP did not generate tumors, suggesting that both LIN28A and activated KRAS play key roles in the transformation. The role of LIN28A in transformation is further strengthened by experiments showing that knockdown of LIN28A in hNSC-LIN28A/DNp53/hTERT/KRAS inhibited their growth, consistent with the results of LIN28A knockdown in glioma-derived neurosphere cell lines. LIN28A-related increased expression of HMGA2 may suppress p16INK4a or other tumor suppressors that are induced by high-level activation of the RAS/BRAF/MAP kinase pathway in human neural stem cells. Our laboratory has recently shown that oncogene-induced senescence as evidenced by increased p16INK4a expression is a key mechanism by which neural stem cells resist transformation by constitutive activation of the RAS/BRAF/MAP kinase pathway [49]. Studies of HMGA2-mediated repression of p16INK4a and the oncogene-induced senescence program in human neural stem cells are on-going in our laboratory.
The experiments presented here indicate a role for LIN28A in the transformation of normal cells into aggressive glial tumors and an on-going requirement for LIN28A in GBM. By increasing the expression of multiple oncogenes simultaneously through repression of the let-7 microRNAs, LIN28A can activate oncogenic programs that enhance glioblastoma aggressiveness. Our results show that LIN28A is expressed in GBM but not in normal human brain, and that LIN28A is important for the tumorigenicity of GBM cells and transformation of hNSCs, suggesting LIN28A might be a potential therapeutic target for GBM treatment.
Materials and methods
Cell culture
Human neural stem and progenitor cells were obtained from first trimester human fetal autopsy specimens in concordance with German law and Ethics Board evaluation. The study was also approved by the Johns Hopkins Institutional Review Board. Cells from cerebral cortex were microdissected and processed as described previously[18], then passaged in neurosphere media (30% Ham’s F12 media, 70 % DMEM, 5% B27 regent (Invitrogen), 1% L-glutamine, 1% antibiotic-antimycotic, 5 micrograms/ml heparin, 20 ng/ml FGF, and 20 ng/ml EGF). Cells were split at high density after incubation with Accutase (Sigma-Aldrich) and gentle trituration. Human adult GBM cell lines HSR-GBM1 and 040622 cell lines (also known as HSR-GBM2), JHH-GBM14 have been previously described [19, 20]. The SF188 pediatric GBM cell line has been well characterized [21].
DNA constructs and viral infection
The R248WTP53 plasmid (Addgene plasmid 16437) [22], and KRAS12V (Addgene plasmid 12544) [23] were subcloned separately into the lentiviral vector pWPI (Addgene plasmid 12254). Restriction digest and sequencing confirmed the fidelity of the subcloned sequences. Additional lentiviral constructs were LIN28A (Addgene Plasmid 16580) [24], hTERT (Addgene plasmid 12245) [25], pLKO.1 scramble shRNA (Addgene plasmid 1864) [26], and pLKO.1 empty vector (Addgene plasmid 10878) [27]. Lentivirus vectors containing short hairpins against LIN28A were purchased from Sigma (TRCN0000021800 and TRCN0000021803). Lentiviral particles were produced by transfecting 293T cells with VSVG envelope plasmid, delta 8.9 gag/pol plasmid and the plasmid of interest, as described previously, (20) using Fugene (Roche) per the manufacturer’s instructions. After 24 hours, the media was changed to FGF/EGF neurosphere media, and supernatants were collected at 48 and 72 hours. These supernatants were pooled and passed through a 0.45 micron filter, then frozen at -80 C until needed. Human neural stem and progenitor cells growing as neurospheres were dissociated into single cells with Accutase and gentle trituration, and then incubated with lentiviral supernatants for 24 hours. For infection of human neural stem cells (hNSCs), combinations of lentivirus encoding LIN28A, R248WTP53, CA-KRAS, hTERT or GFP were added simultaneously. After approximately one week in culture, individual spheres were identified, and they were then individually placed into wells of a 24-well plate under selection with puromycin. Individual spheres were visually scored for GFP-positivity. Control cells were infected with pWPI empty vector, which constitutively expresses GFP. For infection of GBM cell lines, neurospheres were dissociated into single cells and lentivirus encoding LIN28A, LIN28A-shRNA empty vector or scramble shRNA was added. After approximately one week in culture, 2 ug/ml puromycin was used to select infected cells. For nucleofection, the Amaxa mouse neural stem cell kit was used (Lonzo).
Immunofluorescence assays
For immunofluorescence assays, cells were either plated on Matrigel-coated Lab-Tek chamber slides (Nunc International) or were cytospun onto positively charged slides. After washing cells once with PBS, they were fixed with 4% paraformaldehyde for 15 minutes, permeabilized with 0.1% Triton/PBS, then blocked with 5% normal goat serum/PBST or 5% BSA/PBST, and incubated with the appropriate primary antibody. Primary antibodies included LIN28A (Cell Signaling Technology 3978, 1:100), GFAP (DAKO Z0334, 1:1000), MAP2 (Santa Cruz SC-20172 1:1000). After washing three times with PBST, cells were incubated for 45 minutes in the dark with the appropriate Cy-2 or Cy-3 conjugated secondary antibody (Jackson Immunoresearch). Cells were counterstained with DAPI and mounted with anti-fade (Vectastain).
Assays of cell proliferation
BrdU assays were performed as described previously [28]. Anti-BrdU antibody was used as per the manufacturer’s directions (Sigma B2531) at 1:100 dilution and visualized as described above.
For relative cell growth assay, cells were seeded in 96-well plates in triplicate at densities of 5000 cells per well. Cell proliferation was monitored at 0, 2, 4 and 7 days using the colorimetric CellTiter 96 MTS assay (Promega, Madison, WI).
Colony formation in soft agarose
A 2X concentration of the neurosphere media was prepared and mixed 1:1 with 1 percent melted agarose (Invitrogen) in water to make bottom agar, which was used to coat each well of a 6-well plate. Cells were incubated in Accutase (Sigma) and triturated by pipetting through a P1000 pipette to single cell density and placed into the top agarose media/soft agarose mixture (0.5 %) and immediately plated into 6-well plates at a density of 5,000 cells/well in 1.5ml of agarose. After the agarose gelled, 2 ml of media was placed into each well. Media was changed every 7 days, and the cultures were incubated for 4 to 6 weeks. Colonies were visualized by staining with nitroblue tetrazolium (NBT) in a tissue culture incubator overnight at 37 C. Colonies greater than 50 microns in diameter were scanned and counted using MCID Elite software (Cambridge, England, UK).
Boyden chamber transwell invasion assay
Boyden chambers (Falcon) were pre-coated with Matrigel (Invitrogen) at 1:100 dilution overnight. Cells were plated in the upper chamber in low growth factor media (1% serum) while the bottom chamber contained 10% serum. After 24 hour incubation, the cells remaining on top chamber were removed with a cotton-tipped applicator, and cells on the bottom of the membrane were fixed with 80% methanol and counterstained with hematoxylin. Cells were photographed at high power (200X) and three separate high power fields were counted.
Quantitative RT-PCR
RNA levels were analyzed by real-time PCR analysis performed in triplicate with SYBR Green reagents (Applied Biosystems, Foster City, CA) according to the manufacturer’s instructions on an I-Cycler IQ5 real-time detection system (Bio-Rad, Hercules, CA). The delta/delta cT method was used to determine expression levels, and all values were normalized to actin or 18S. Primer sequences were as follows: human LIN28A forward: CGGGCATCTGTAAGT, reverse: CAGACCCTTGGCTGA; human TERT forward: TGACACCTCACCTCACCCAC, reverse CACTGTCTTCCGCAAGTTCAC; human HMGA2 forward GCGCCTCAGAAGAGAGGAC, reverse: GGTCTCTTAGGAGAGGGCTCA; human SNAI1 forward: CATCCTTCTCACTGCCATGGA, reverse: AGGCAGAGGACACAGAACCAGA;human β-actin forward: CCCAGCACAATGAAGATCAA, reverse: GATCCACACGGAGTACTTG; human 18S forward: GTAACCCGTTGAACCCCATT, reverse: CCATCCAATCGGTAGTAGCG.
For detection of microRNAs, mature let-7a, b and g were quantified using a predesigned TaqMan MicroRNA Assay (Applied Biosystems) according to the manufacturer’s instructions. An 18S rRNA primer was used as a normalizing control.
TCGA Dataset analysis
Z-normalized mRNA or miRNA expression data from 503 glioblastomas with gene expression data and 426 tumors with miRNA expression data from the TCGA [29] were downloaded from the cBio Cancer Genomics Portal (http://www.cbioportal.org/). To evaluate the relationship between expression of different mRNAs or miRNAs, expression values were graphed as scatter plots and a best fit line derived using linear regression. The correlation of expression values was determined using Pearson’s correlation coefficient. Significance was set at the p≤0.05. To determine pathway activation, a threshold Z-score of 1.5 was chosen and the TCGA dataset was interrogated for LIN28A, LIN28B, and HMGA2.
Western blotting
Western blotting was performed as described [28], Antibodies were used as per the manufacturer’s instructions and were as follows: LIN28A (1:1000; Cell Signal #3978); Nestin (1:2000; Millipore, #MAB5326), SOX-2 (1:500; Santa Cruz #SC17320), OLIG2 (1:2500; Millipore AB9610), CD133 (1:400; Abcam #AB19898), phosphor-MAPK (1:1000; Cell Signal #4376); MAPK (1:1000; Cell Signal #9102); TP53 (1:10,000; Sigma P 5813); MAP2 (1:5000; Santa Cruz #SC-20172); GFAP (1:5000; DAKO #Z0334); HMGA2 (1:1000; BioTek, #59170AP); glyceraldehyde-3-phosphate dehydrogenase (clone 6C5, 1:500,000; Research Diagnostics, Concord, MA).
Intracranial xenograft tumors
For intracranial xenografts, injection guide holes were produced in anesthetized animals by twirling an 18-gauge beveled needle to provide access to the intracranial space. 1x10⁵ viable cells in 5 μl of growth medium were used for intracranial injection into the right striatum by stereotactic injection through a needle connected to a Hamilton syringe. The following coordinates were used: antero-posterior =-3mm; medio-lateral=2 mm; dorso-ventral =3 mm. The skin was sutured following injection. Animals were monitored daily for signs of distress suggestive of intracranial mass lesion (cachexia, neurologic deficits, poor grooming) and were sacrificed at that time. Xenograft tumors were paraffin-embedded and processed for immunohistochemistry by the Johns Hopkins Histopathology Core.
Immunohistochemistry
Glioma tissue microarrays (TMAs) were constructed using tumor samples obtained from 1977 to 2009, and normal control tissue from autopsy specimens retrieved from the archives of the Johns Hopkins Hospital Department of Pathology following appropriate institutional review board approval. Criteria for inclusion included a diagnosis of invasive glioma and the presence of adequate tissue in the original paraffin block. Formalin-fixed, paraffin-embedded tissue was utilized to construct TMAs according to standard procedures at the Johns Hopkins tissue microarray core facility. For each tumor, four cores measuring 0.6 mm in diameter were used per array. Two neuropathologists independently determined tumor classification and cellularity.
Immunohistochemistry was performed on deparaffinized sections of brain xenografts and tissue microarrays containing cores from 135 gliomas. In brief, after antigen retrieval using Antigen Unmasking Solution (Vector Laboratories, Burlingame, CA), sections were incubated overnight at 4°C with primary antibodies. The following primary antibodies were used: LIN28A (1:100; Cell Signaling Technologies #3978); human specific NESTIN (1:500; Millipore, #MAB5326); GFAP (1:1000; DAKO #Z0334); Synaptophysin (1:50; DAKO #A0010); phospho-MAP kinase (1:100; Cell Signaling Technologies #4376); MAPK (1:100; Cell Signaling Technologies #9102); human specific SOX2 (1:50; Cell Signal #3579); MYC (1:200, Epitomics,# 1472-1) was diluted 1:200 in PBS TP53 (1:1000; Sigma P 5813); and Ki67 (1:100; Santa Cruz # SC-15402).
For LIN28A immunohistochemistry, cytoplasmic staining of LIN28A was scored as “strong” (2+) if in 10% or more of tumor cells it was as intense as in positive control spermatogonia, moderate (1+) if it was clearly positive but less intense than in these germ cells, and negative if it had only blush/trace or no immunoreactivity. SOX2 immunohistochemistry was scored as 2+ if 50% or more of tumors had nuclear positivity, 1+ if greater than 5% but less than 50% of cells had nuclear positivity, and negative if there was no immunoreactivity. MYC immunohistochemistry was graded as 0 if there was no reactivity, 1+ if weak nuclear staining in in less than 75% of tumor cells, 2+ if moderate or intense staining in less than 75% of cells, and 3+ if there was weak, moderate or strong staining in more than 75% of cells.
Statistical Analysis
Statistical tests were performed using GraphPad Prism (GraphPad Software, San Diego California USA) or Excel (Microsoft). All tests were two sided unless otherwise indicated, and p values less than 0.05 were considered significant unless otherwise noted. In selected cases ANOVA was performed with Tukey multiple comparison adjustment, as indicated.
Acknowledgements
We thank Donata Maciaczyk for her excellent technical support and Angelo Vescovi for HSR-GBM1 and HSR-GBM2 (040622) cell lines.
References
1. Ben-Porath I, Thomson MW, Carey VJ, Ge R, Bell GW, Regev A and Weinberg RA. An embryonic stem cell-like gene expression signature in poorly differentiated aggressive human tumors. Nat Genet. 2008; 40(5):499-507.
2. Feng C, Neumeister V, Ma W, Xu J, Lu L, Bordeaux J, Maihle NJ, Rimm DL and Huang Y. Lin28 regulates HER2 and promotes malignancy through multiple mechanisms. Cell Cycle. 2012; 11(13):2486-2494.
3. Xu C, Shen J, Xie S, Jiang Z, Huang L and Wang L. Positive expression of Lin28 is correlated with poor survival in gastric carcinoma. Med Oncol. 2013; 30(1):382.
4. Nadiminty N, Tummala R, Lou W, Zhu Y, Shi XB, Zou JX, Chen H, Zhang J, Chen X, Luo J, deVere White RW, Kung HJ, Evans CP and Gao AC. MicroRNA let-7c is downregulated in prostate cancer and suppresses prostate cancer growth. PLoS One. 2012; 7(3):e32832.
5. Viswanathan SR, Powers JT, Einhorn W, Hoshida Y, Ng TL, Toffanin S, O’Sullivan M, Lu J, Phillips LA, Lockhart VL, Shah SP, Tanwar PS, Mermel CH, Beroukhim R, Azam M, Teixeira J, et al. Lin28 promotes transformation and is associated with advanced human malignancies. Nat Genet. 2009; 41(7):843-848.
6. West JA, Viswanathan SR, Yabuuchi A, Cunniff K, Takeuchi A, Park IH, Sero JE, Zhu H, Perez-Atayde A, Frazier AL, Surani MA and Daley GQ. A role for Lin28 in primordial germ-cell development and germ-cell malignancy. Nature. 2009; 460(7257):909-913.
7. Boyerinas B, Park SM, Shomron N, Hedegaard MM, Vinther J, Andersen JS, Feig C, Xu J, Burge CB and Peter ME. Identification of let-7-regulated oncofetal genes. Cancer Res. 2008; 68(8):2587-2591.
8. Kumar MS, Erkeland SJ, Pester RE, Chen CY, Ebert MS, Sharp PA and Jacks T. Suppression of non-small cell lung tumor development by the let-7 microRNA family. Proc Natl Acad Sci U S A. 2008; 105(10):3903-3908.
9. Tzatsos A and Bardeesy N. Ink4a/Arf regulation by let-7b and Hmga2: a genetic pathway governing stem cell aging. Cell Stem Cell. 2008; 3(5):469-470.
10. Yu F, Yao H, Zhu P, Zhang X, Pan Q, Gong C, Huang Y, Hu X, Su F, Lieberman J and Song E. let-7 regulates self renewal and tumorigenicity of breast cancer cells. Cell. 2007; 131(6):1109-1123.
11. Watanabe S, Ueda Y, Akaboshi S, Hino Y, Sekita Y and Nakao M. HMGA2 maintains oncogenic RAS-induced epithelial-mesenchymal transition in human pancreatic cancer cells. Am J Pathol. 2009; 174(3):854-868.
12. Wu J, Liu Z, Shao C, Gong Y, Hernando E, Lee P, Narita M, Muller W, Liu J and Wei JJ. HMGA2 overexpression-induced ovarian surface epithelial transformation is mediated through regulation of EMT genes. Cancer Res. 2011; 71(2):349-359.
13. Thuault S, Tan EJ, Peinado H, Cano A, Heldin CH and Moustakas A. HMGA2 and Smads co-regulate SNAIL1 expression during induction of epithelial-to-mesenchymal transition. J Biol Chem. 2008; 283(48):33437-33446.
14. Tan EJ, Thuault S, Caja L, Carletti T, Heldin CH and Moustakas A. Regulation of transcription factor Twist expression by the DNA architectural protein high mobility group A2 during epithelial-to-mesenchymal transition. J Biol Chem. 2012; 287(10):7134-7145.
15. Balzer E, Heine C, Jiang Q, Lee VM and Moss EG. LIN28 alters cell fate succession and acts independently of the let-7 microRNA during neurogliogenesis in vitro. Development. 2010; 137(6):891-900.
16. Picard D, Miller S, Hawkins CE, Bouffet E, Rogers HA, Chan TS, Kim SK, Ra YS, Fangusaro J, Korshunov A, Toledano H, Nakamura H, Hayden JT, Chan J, Lafay-Cousin L, Hu P, et al. Markers of survival and metastatic potential in childhood CNS primitive neuro-ectodermal brain tumours: an integrative genomic analysis. Lancet Oncol. 2012; 13(8):838-848.
17. Deisch J, Raisanen J and Rakheja D. Immunohistochemical expression of embryonic stem cell markers in malignant rhabdoid tumors. Pediatr Dev Pathol. 2011.
18. Maciaczyk J, Singec I, Maciaczyk D, Klein A and Nikkhah G. Restricted spontaneous in vitro differentiation and region-specific migration of long-term expanded fetal human neural precursor cells after transplantation into the adult rat brain. Stem Cells Dev. 2009; 18(7):1043-1058.
19. Bar EE, Lin A, Mahairaki V, Matsui W and Eberhart CG. Hypoxia increases the expression of stem-cell markers and promotes clonogenicity in glioblastoma neurospheres. Am J Pathol. 2010; 177(3):1491-1502.
20. Schreck KC, Taylor P, Marchionni L, Gopalakrishnan V, Bar EE, Gaiano N and Eberhart CG. The Notch target Hes1 directly modulates Gli1 expression and Hedgehog signaling: a potential mechanism of therapeutic resistance. Clin Cancer Res. 2010; 16(24):6060-6070.
21. Bax DA, Little SE, Gaspar N, Perryman L, Marshall L, Viana-Pereira M, Jones TA, Williams RD, Grigoriadis A, Vassal G, Workman P, Sheer D, Reis RM, Pearson AD, Hargrave D and Jones C. Molecular and phenotypic characterisation of paediatric glioma cell lines as models for preclinical drug development. PLoS One. 2009; 4(4):e5209.
22. Baker SJ, Markowitz S, Fearon ER, Willson JK and Vogelstein B. Suppression of human colorectal carcinoma cell growth by wild-type p53. Science. 1990; 249(4971):912-915.
23. Khosravi-Far R, White MA, Westwick JK, Solski PA, Chrzanowska-Wodnicka M, Van Aelst L, Wigler MH and Der CJ. Oncogenic Ras activation of Raf/mitogen-activated protein kinase-independent pathways is sufficient to cause tumorigenic transformation. Mol Cell Biol. 1996; 16(7):3923-3933.
24. Yu J, Vodyanik MA, Smuga-Otto K, Antosiewicz-Bourget J, Frane JL, Tian S, Nie J, Jonsdottir GA, Ruotti V, Stewart R, Slukvin, II and Thomson JA. Induced pluripotent stem cell lines derived from human somatic cells. Science. 2007; 318(5858):1917-1920.
25. Salmon P, Oberholzer J, Occhiodoro T, Morel P, Lou J and Trono D. Reversible immortalization of human primary cells by lentivector-mediated transfer of specific genes. Mol Ther. 2000; 2(4):404-414.
26. Sarbassov DD, Guertin DA, Ali SM and Sabatini DM. Phosphorylation and regulation of Akt/PKB by the rictor-mTOR complex. Science. 2005; 307(5712):1098-1101.
27. Moffat J, Grueneberg DA, Yang X, Kim SY, Kloepfer AM, Hinkle G, Piqani B, Eisenhaure TM, Luo B, Grenier JK, Carpenter AE, Foo SY, Stewart SA, Stockwell BR, Hacohen N, Hahn WC, et al. A lentiviral RNAi library for human and mouse genes applied to an arrayed viral high-content screen. Cell. 2006; 124(6):1283-1298.
28. Raabe EH, Laudenslager M, Winter C, Wasserman N, Cole K, LaQuaglia M, Maris DJ, Mosse YP and Maris JM. Prevalence and functional consequence of PHOX2B mutations in neuroblastoma. Oncogene. 2008; 27(4):469-476.
29. TCGA. Comprehensive genomic characterization defines human glioblastoma genes and core pathways. Nature. 2008; 455(7216):1061-1068.
30. Zheng K, Wu X, Kaestner KH and Wang PJ. The pluripotency factor LIN28 marks undifferentiated spermatogonia in mouse. BMC Dev Biol. 2009; 9:38.
31. Marian CO, Cho SK, McEllin BM, Maher EA, Hatanpaa KJ, Madden CJ, Mickey BE, Wright WE, Shay JW and Bachoo RM. The telomerase antagonist, imetelstat, efficiently targets glioblastoma tumor-initiating cells leading to decreased proliferation and tumor growth. Clin Cancer Res. 2010; 16(1):154-163.
32. Felix CA, Slavc I, Dunn M, Strauss EA, Phillips PC, Rorke LB, Sutton L, Bunin GR and Biegel JA. p53 gene mutations in pediatric brain tumors. Med Pediatr Oncol. 1995; 25(6):431-436.
33. Uhrbom L, Dai C, Celestino JC, Rosenblum MK, Fuller GN and Holland EC. Ink4a-Arf loss cooperates with KRas activation in astrocytes and neural progenitors to generate glioblastomas of various morphologies depending on activated Akt. Cancer Res. 2002; 62(19):5551-5558.
34. Kim J, Woo AJ, Chu J, Snow JW, Fujiwara Y, Kim CG, Cantor AB and Orkin SH. A Myc network accounts for similarities between embryonic stem and cancer cell transcription programs. Cell. 2010; 143(2):313-324.
35. Li Y, Li A, Glas M, Lal B, Ying M, Sang Y, Xia S, Trageser D, Guerrero-Cazares H, Eberhart CG, Quinones-Hinojosa A, Scheffler B and Laterra J. c-Met signaling induces a reprogramming network and supports the glioblastoma stem-like phenotype. Proc Natl Acad Sci U S A. 2011; 108(24):9951-9956.
36. Helland A, Anglesio MS, George J, Cowin PA, Johnstone CN, House CM, Sheppard KE, Etemadmoghadam D, Melnyk N, Rustgi AK, Phillips WA, Johnsen H, Holm R, Kristensen GB, Birrer MJ, Pearson RB, et al. Deregulation of MYCN, LIN28B and LET7 in a molecular subtype of aggressive high-grade serous ovarian cancers. PLoS One. 2011; 6(4):e18064.
37. Peng S, Maihle NJ and Huang Y. Pluripotency factors Lin28 and Oct4 identify a sub-population of stem cell-like cells in ovarian cancer. Oncogene. 2010.
38. King CE, Cuatrecasas M, Castells A, Sepulveda AR, Lee JS and Rustgi AK. LIN28B Promotes Colon Cancer Progression and Metastasis. Cancer Res. 2011; 71(12):4260-4268.
39. Lee ST, Chu K, Oh HJ, Im WS, Lim JY, Kim SK, Park CK, Jung KH, Lee SK, Kim M and Roh JK. Let-7 microRNA inhibits the proliferation of human glioblastoma cells. J Neurooncol. 2011; 102(1):19-24.
40. Nishino J, Kim I, Chada K and Morrison SJ. Hmga2 promotes neural stem cell self-renewal in young but not old mice by reducing p16Ink4a and p19Arf Expression. Cell. 2008; 135(2):227-239.
41. Zhou X, Benson KF, Ashar HR and Chada K. Mutation responsible for the mouse pygmy phenotype in the developmentally regulated factor HMGI-C. Nature. 1995; 376(6543):771-774.
42. Zhu H, Shah S, Shyh-Chang N, Shinoda G, Einhorn WS, Viswanathan SR, Takeuchi A, Grasemann C, Rinn JL, Lopez MF, Hirschhorn JN, Palmert MR and Daley GQ. Lin28a transgenic mice manifest size and puberty phenotypes identified in human genetic association studies. Nat Genet. 2010; 42(7):626-630.
43. Weedon MN, Lettre G, Freathy RM, Lindgren CM, Voight BF, Perry JR, Elliott KS, Hackett R, Guiducci C, Shields B, Zeggini E, Lango H, Lyssenko V, Timpson NJ, Burtt NP, Rayner NW, et al. A common variant of HMGA2 is associated with adult and childhood height in the general population. Nat Genet. 2007; 39(10):1245-1250.
44. Evdokimova V, Tognon C, Ng T, Ruzanov P, Melnyk N, Fink D, Sorokin A, Ovchinnikov LP, Davicioni E, Triche TJ and Sorensen PH. Translational activation of snail1 and other developmentally regulated transcription factors by YB-1 promotes an epithelial-mesenchymal transition. Cancer Cell. 2009; 15(5):402-415.
45. Yang HW, Menon LG, Black PM, Carroll RS and Johnson MD. SNAI2/Slug promotes growth and invasion in human gliomas. BMC Cancer. 2010; 10:301.
46. Han SP, Kim JH, Han ME, Sim HE, Kim KS, Yoon S, Baek SY, Kim BS and Oh SO. SNAI1 is involved in the proliferation and migration of glioblastoma cells. Cell Mol Neurobiol. 2011; 31(3):489-496.
47. Wanshura LE, Galvin KE, Ye H, Fernandez-Zapico ME and Wetmore C. Sequential activation of snail1 and N-myc modulates sonic hedgehog-induced transformation of neural cells. Cancer Res. 2011; 71(15):5336-5345.
48. Sanai N, Tramontin AD, Quinones-Hinojosa A, Barbaro NM, Gupta N, Kunwar S, Lawton MT, McDermott MW, Parsa AT, Manuel-Garcia Verdugo J, Berger MS and Alvarez-Buylla A. Unique astrocyte ribbon in adult human brain contains neural stem cells but lacks chain migration. Nature. 2004; 427(6976):740-744.
49. Raabe EH, Lim KS, Kim JM, Meeker A, Mao XG, Nikkhah G, Maciaczyk J, Kahlert U, Jain D, Bar E, Cohen KJ and Eberhart CG. BRAF activation induces transformation and then senescence in human neural stem cells: a pilocytic astrocytoma model. Clin Cancer Res. 2011; 17(11):3590-3599.