
INTRODUCTION
Bmi1 (B cell-specific Mo-MLV integration site 1) was identified as a gene cooperating with Myc in the generation of B-lymphoid tumors [1, 2]. BMI-1 protein is a component of multiprotein complexes that mediate gene silencing via chromatin modifications [3].
Bmi1 knockout (Bmi1−/−) mice are smaller than their wild-type littermates and display neurological, hematopoietic and skeletal abnormalities [4]. Bmi1 mutant cerebellum is strongly decreased in size and shows a reduced thickness and cellularity of the molecular and granular layer. Thymus, spleen and bone marrow of Bmi1−/− mice have profoundly reduced cell counts and posterior transformation defects along the vertebral column are present. At the cellular level, it has been demonstrated that Bmi1 maintains somatic stem cells: Bmi1 deficiency leads to impaired self-renewal of hematopoietic, neural, bronchioalveolar and intestinal stem cells and reduced numbers of incisor stem cells [5–10]. Loss of Bmi1 also results in premature lineage specification of hematopoietic stem cells (HSCs) thereby decreasing their number [11]. The opposite effect, increased self-renewal of hematopoietic and neural stem cells is observed upon Bmi1 overexpression [12–15]. High BMI-1 levels are present in many hematopoietic and solid tumors and a critical role of Bmi1 for tumor development and maintenance has been reported [16, 17].
How does Bmi1 exert its cellular functions? BMI-1 is involved in transcription regulation and is part of repressor complexes PRC1 (Polycomb Repressive Complex 1) and BCOR [3]. Each canonical and non-canonical PRC1 complex contains a distinct type of Polycomb group RING finger protein (such as BMI-1 = PCGF4), a RING1A/B ubiquitin ligase and additional proteins [18]. KDM2B (=FBXL10) recruits non-canonical PRC1 to unmethylated CpG islands and the RING1B component of this complex monoubiquitylates histone H2A on lysine 119 (H2A119ube1) [19–21]. This enzymatic activity is stimulated by BMI-1 [22]. H2A119ube1 deposition leads to the recruitment of Polycomb Repressive Complex 2 (PRC2) which in turn places the repressive H3K27me3 histone mark (trimethylated histone H3 at lysine 27) [23, 24]. Upon binding to H3K27me3, canonical PRC1 can be recruited by CBX proteins.
Although several cell context-dependent BMI-1 effects can be attributed to a number of identified target genes (e.g. Ink4a/Arf, [25, 26]; Cdkn1a [9], Cdkn1c [27], Hoxc13 [22], imprinted gene loci [27]; genes involved in TGF-β/BMP and ER stress response pathways [28]) and protein interaction partners (e.g. E4F1 [29], p53 [30]), these do not explain the full spectrum of BMI-1-mediated cell functions.
In this study, we identified the tumor suppressor gene EphA7 as a novel direct BMI-1 target.
Bmi1−/− knockout mice have a reduced number of proliferating cells in a postnatal neural stem cell niche, the LVW. Here we demonstrate that BMI-1 represses EphA7 in mouse neural stem/progenitor cells and that EphA7 deletion partially rescues the proliferative defect in the Bmi1−/− lateral ventricle wall (LVW). Moreover, we show that elevated BMI-1 levels lead to an increased amount of H3K27me3 and a delayed increase in DNA methylation at the EphA7 locus. EPHA7 is inactivated by DNA hypermethylation in several tumor types, and our data suggest that elevated BMI1 levels contribute to this alteration.
RESULTS
Identification of novel BMI-1 target genes in neural stem/progenitor cells overexpressing Bmi1
We sought to identify novel BMI-1 target genes in neural stem/progenitor cells which were isolated from the LVW of postnatal mice and grown as neurospheres (NSPs). Test cells were transduced with bicistronic retroviral constructs to overexpress Bmi1 or FLAG-tagged Bmi1 (Bmi1-FLAG) together with eGFP, and control cells were transduced with an empty vector construct expressing eGFP only. Overexpression of both, flagged and unflagged Bmi1, led to the same cellular changes in comparison to empty vector control samples: Increased in vitro self-renewal (neurosphere initiation frequency, Figure 1A) and neurosphere size (Figure 1B, 1C). In line with these findings, increased cell numbers were measured in Bmi1-overexpressing cultures (Figure 1D).
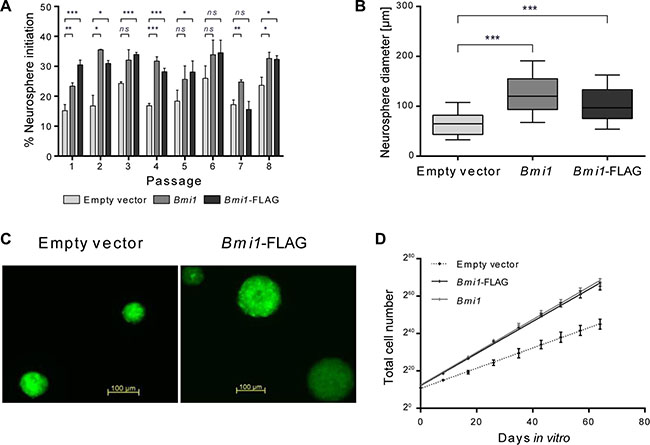
Figure 1: Bmi1 overexpression increases proliferation and self-renewal of postnatal NSP cells in vitro. (A) Frequency of neurosphere initiation of empty vector, pCMMP-Bmi1 and pCMMP-Bmi1-FLAG transduced cells assessed 7 days post plating for 8 passages (n = 3). Error bars represent standard deviations. (B) Box plots representing neurosphere diameters determined for empty vector, pCMMP-Bmi1 and pCMMP-Bmi1-FLAG transduced NSP cells at passage 2 (50 spheres were investigated in 3 independent cultures). Whiskers represent the 10–90th percentiles. Results of unpaired t-tests in (A) and (B) are marked as follows: *p ≤ 0.05, **p ≤ 0.01, ***p ≤ 0.001, ns: not significant (p > 0.05). (C) Fluorescent micrographs of empty vector and Bmi1-FLAG transduced neurospheres. (D) Total cell numbers measured at 7–9 days post plating over 8 passages (n = 3). Mean values with standard deviation and linear regression lines are shown. Linear regression analysis showed a significant difference between empty vector and pCMMP-Bmi1 and pCMMP-Bmi1-FLAG transduced NSP cultures (ANCOVA, p < 0.0001).
To identify genes which are regulated by BMI-1 in neural stem/progenitor cells we compared the gene expression profile of neurosphere cells overexpressing Bmi1-FLAG to control cells using Affymetrix Gene Mouse ST1.0 arrays. Based on the criteria described in Materials and Methods, we obtained 200 differentially expressed sequences which showed a downregulation in Bmi1-overexpressing cells, and 100 that were upregulated (Supplementary Information File S1). To identify direct target genes of the transcriptional repressor BMI-1, binding to genomic regions of selected genes that had reduced transcript levels in response to Bmi1 overexpression was analyzed by chromatin immunoprecipitation (ChIP). Genes with a known or suspected tumor suppressor function were selected. Neurosphere cells overexpressing Bmi1-FLAG and an anti-FLAG antibody were used since available BMI-1 antibodies were not suitable for ChIP experiments. Primer pairs spanning the BMI-1-bound Ink4a promoter region [26, 31] were used as positive control. A binding of BMI-1 to genomic regions of four novel target genes was detected (Figure 2): Ndn, EphA7, Rps6ka6, and Trp53bp2.
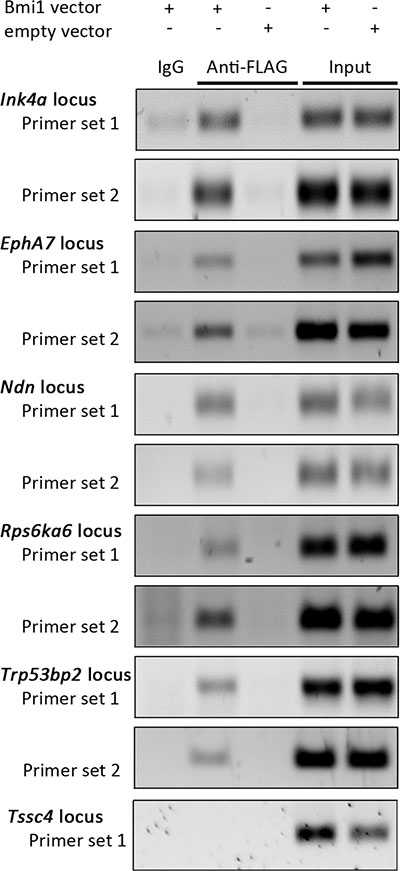
Figure 2: Identification of direct BMI-1 targets by ChIP. Representative agarose gel electrophoresis images of PCR-amplified Ink4a, EphA7, Ndn, Rps6ka6, Trp53bp2 and Tssc4 genomic regions using material from ChIP samples and input controls as template (n = 3). ChIP was performed with empty vector (empty) and pCMMP-Bmi1-FLAG-transduced NSP cells, applying the anti-FLAG antibody M2. A matched IgG1 isotype antibody was used as negative control and post-sonication cell lysate served as input control. Tssc4 PCR results are shown as negative example.
EphA7 variant transcripts are decreased in Bmi1-overexpressing and increased in Bmi1−/− cells
We next wanted to know if these novel BMI-1 target genes, which were downregulated upon Bmi1 overexpression, are conversely derepressed in the absence of Bmi1. The expression of the four genes was therefore analyzed by quantitative RT-PCR (qRT-PCR) in neural stem/progenitor cells isolated from Bmi1−/− and Bmi1+/+ (wild-type) mice. Bmi1−/− mice frequently die shortly after birth [4] and the growth of adult Bmi1−/− neurospheres is strongly impaired, thus tissue from embryonic stage (E)14.5 wild-type and mutant animals was used for these experiments. Only EphA7 was significantly upregulated in Bmi1−/− embryonic neurospheres while expression of other candidate genes was not affected by loss of Bmi1 (Figure 3A). In addition to studying full length (FL) EphA7 transcripts, we investigated alternatively spliced truncated EphA7 variants (Figure 3A, 3B) since they function differently from FL EphA7 (see discussion below). EphA7 T1 and T2 represent truncated EphA7 mRNAs which lack the intracellular domain [32], and the S variant lacks both the intracellular and transmembrane domain [33], producing a secreted EphA7 protein.
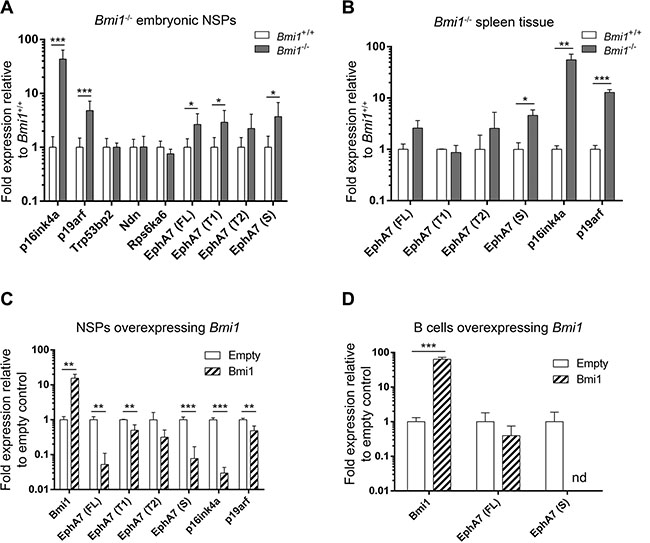
Figure 3: Derepression of EphA7 isoforms in Bmi1−/− cells and downregulation in Bmi1-overexpressing cells. Gene expression levels determined by qPCR analyses are shown. p16ink4a and p19arf served as positive controls. (A) Upregulation of candidate BMI-1 target genes in embryonic day E14.5 neurosphere (NSP) cells isolated from Bmi1−/− animals in comparison to cells isolated from Bmi1+/+ animals (n = 8). Note the increased transcript levels of the full length (FL), truncated (T1) and secreted (S) EphA7 isoforms (B) Upregulation of EphA7 secreted isoform in postnatal spleen tissue from adult Bmi1−/− animals in comparison to tissue from Bmi1+/+ mice (n = 3). Downregulation of EphA7 isoform transcripts in postnatal neurosphere cells (C) and in postnatal spleen B cells (D) in Bmi1-overexpressing cells in comparison to empty vector control cells (n = 3). Note that upon Bmi1 overexpression in spleen B cells, transcripts of the secreted EphA7 isoform were not detectable (nd) anymore. Significant results of unpaired t-tests are marked as follows: *p ≤ 0.05, **p ≤ 0.01, ***p ≤ 0.001. Mean values with standard deviation are shown.
In addition to abnormalities of the nervous system, Bmi1−/− mice have a hypoplastic bone marrow and severely reduced thymus and spleen [4]. Since EphA/ephrin-A family members are expressed and function in hematopoietic cells and EphA7-S acts as a tumor suppressor in B cells [33, 34], we investigated if EphA7 is also upregulated in Bmi1-deficient cells of mouse spleen. Increased transcript levels of the secreted EphA7 variant were detected in Bmi1−/− spleen tissue (Figure 3B).
Our microarray data on Bmi1-overexpressing neurospheres did not allow to distinguish the expression of different EphA7 variants and we therefore analyzed the transcript levels of these variants by qRT-PCR. Bmi1-FLAG was overexpressed in postnatal neurospheres and spleen B cells. In neurosphere cells harvested two weeks after transduction with Bmi1-overexpressing constructs, FL, T1 and S EphA7 variants were downregulated (Figure 3C); in spleen B cells transcript levels of secreted EphA7 were lowered below detectable levels in Bmi1-overexpressing cells compared to empty vector control cells (Figure 3D). Due to the scarcity of material and the fact that the truncated variants were not significantly upregulated in spleen tissue, we did not investigate the T1 and T2 variants in spleen B cells.
Deletion of EphA7 partially rescues the proliferation deficiency in the LVW of Bmi1−/− mice
Two prominent neural abnormalities in Bmi1−/− mice are neural stem cell dysfunction and morphological alterations of the cerebellum. Postnatal Bmi1−/− neural stem cells are severely impaired in their in vitro self-renewal capacity determined by neurosphere cultures, and the diameter of neurospheres is significantly smaller compared to neurospheres derived from wild-type animals [5]. The cerebellum of Bmi1−/− mice is strongly decreased in size and has a reduced thickness and cellularity of the molecular and granular layer [4].
To determine if derepression of EphA7 contributes to the cerebellar and neural stem cell phenotypes in Bmi1−/− mice, double knockout (Bmi1−/−EphA7−/−) mice were generated by crossing heterozygous (Bmi1+/−) animals with EphA7−/− mice. The latter carry a null mutation in the EphA7 gene which results in a complete absence of EphA7 expression [35]. Neurospheres isolated from both 6 week-old Bmi1−/−EphA7−/− and from Bmi1−/− single knockout animals were much smaller than those from wild-type and single knockout EphA7−/− mice (Figure 4A, 4B) and we did not succeed in passaging the Bmi1−/−EphA7−/− and Bmi1−/− neurospheres more than once. As in Bmi1−/− mice, the cerebelli from 6 week-old Bmi1−/−EphA7−/− animals were smaller compared to wild-type mice and had a reduced granular and molecular layer thickness (Figure 4C, 4D). In terms of these parameters, no significant difference between Bmi1−/−EphA7−/− and Bmi1−/− mice was detected. From these findings we conclude that the defects of the in vitro potential of postnatal neural stem/progenitor cells lacking Bmi1 and the cerebellar abnormalities in postnatal Bmi1−/− mice cannot be rescued by the deletion of EphA7.
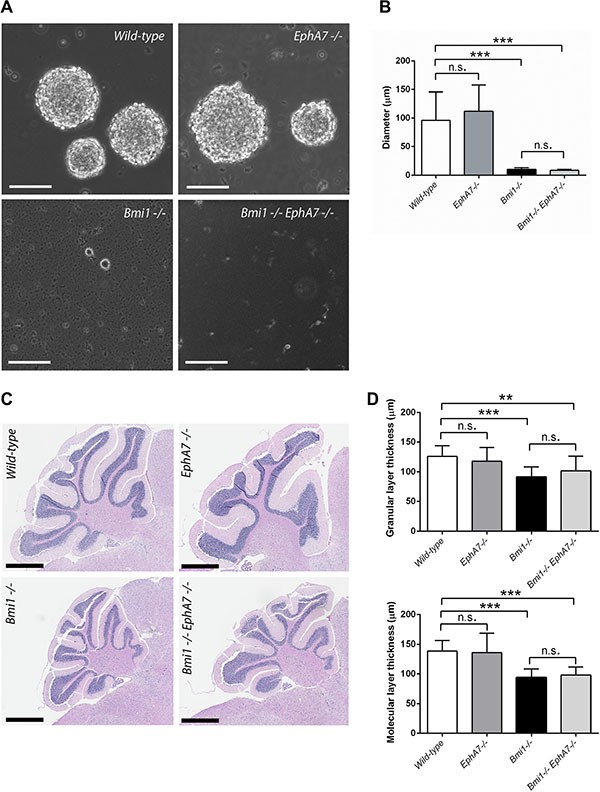
Figure 4: EphA7 deletion does not rescue postnatal neurosphere and cerebellar defects in Bmi1−/− mice. (A) Neural stem/progenitor cells grown as neurospheres (passage 1). Scale bars 100 μm. (B) Comparison of sphere diameters (n = 10–13). Mean values with standard deviation are shown. In Bmi1−/− and Bmi1−/−/EphA7−/− cultures, most of the cells were single cells and did not form aggregates. (C) Sagittal sections of paraffin-embedded cerebelli stained with hematoxylin-eosin. Scale bars 800 μm. Cells and tissue were isolated from six week-old mice. (D) Granular and molecular layer thickness, mean values with standard deviation. 3 mice per genotype, 3–6 measurements per mouse. Significant results of unpaired t-tests are marked as follows: n.s. not significant (p > 0.05), **p ≤ 0.01, ***p ≤ 0.001.
EphA7 is an ephrin receptor and forward and reverse signaling through these receptors depends on the cellular context and the presence of different ligands [36, 37]. Since the microenvironment present in the neural stem/progenitor cell niche of the LVW is not preserved under neurosphere culture conditions, we also analyzed tissue sections of wild-type, Bmi1−/−, EphA7−/−, and Bmi1−/−EphA7−/− mice. A lower number of proliferating neural stem/progenitor cells has previously been reported in the dorsolateral corner of the LVW in Bmi1−/− mice [38]. We counted the number of all (DAPI-positive) and of proliferating (Ki67-positive) cells in the dorsolateral corner of the LVW in anterior and posterior tissue sections and calculated the percentage of Ki67-positive cells (Figure 5A, 5B). A significantly lower percentage of proliferating cells was found in anterior and posterior sections when comparing Bmi1−/− with wild-type animals (Figure 5B). Moreover, in anterior sections, the percentage of proliferating cells in the dorsolateral corner was significantly higher in Bmi1−/−EphA7−/− compared with Bmi1−/− animals (Figure 5B). The majority of Ki67-positive proliferating cells in mouse brains of all four genotypes were Dcx-positive neuroblasts; very few Ki67-positive cells were co-stained with the neural progenitor cell marker Mash1 (see Figure 5C and data not shown). From these data we conclude that the absence of EphA7 in Bmi1−/− mice increases the percentage of proliferating neuroblasts and neural progenitor cells in the dorsolateral corner of the anterior LVW of in vivo, albeit not to the level present in wild-type animals.
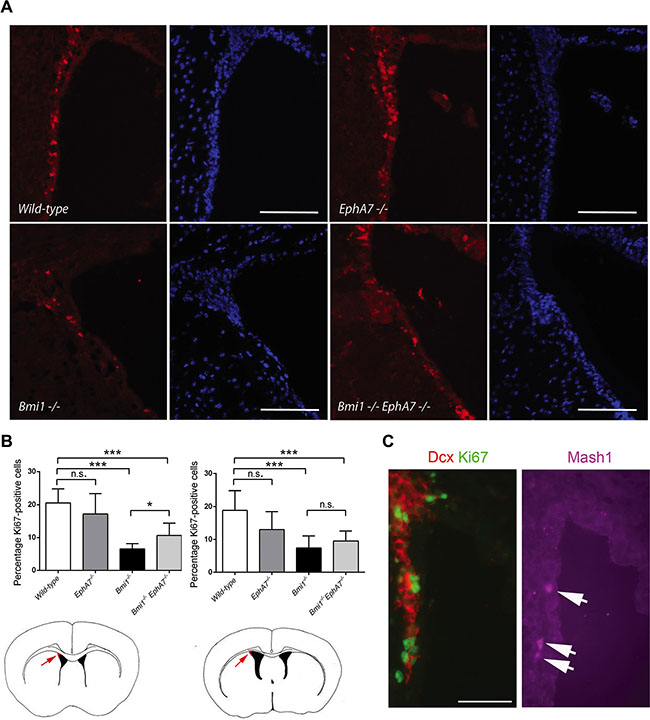
Figure 5: Deletion of EphA7 increases the number of proliferating cells in the LVW dorsolateral corner of Bmi1−/− mice. (A) Coronal anterior brain sections of 6–7 week-old mice stained with an antibody against Ki67 (red) and DAPI (blue). Scale bars: 100 μm. (B) Number of Ki67-positive nuclei per DAPI-positive nuclei shown as percentages (Wild-type: n = 10 ventricles, EphA7−/− n = 10, Bmi1−/− n = 8, double knockout n = 6). Results of unpaired t-tests are marked as follows: *p ≤ 0.05, ***p ≤ 0.001, ns: not significant (p > 0.05). Mean values with standard deviation are shown. Cartoons depict anterior (left hand side) and posterior (right hand side) forebrain sections. Arrows point to the dorsolateral corner (red). (C) Coronal anterior brain section of a 6 week-old wildtype animal stained with antibodies against Ki67 (green), the neuroblast marker Dcx (red), and the neural progenitor cell marker Mash1 (purple). Arrows point to Mash1-positive cells. Scale bar: 50 μm.
Deletion of EphA7 does not rescue gross hematopoietic abnormalities in Bmi1−/− mice
Bmi1−/− animals are characterized by a diminished spleen and thymus size and reduced cellularity of the spleen, thymus, and bone marrow [4]. We found a lower spleen and thymus weight and reduced cellularity of spleen, thymus, and bone marrow in Bmi1−/− compared with wild-type animals. These deficiencies were not significantly improved in Bmi1−/−EphA7−/− animals (Supplementary Information Figure S1) arguing that the BMI-1-EphA7 axis does not contribute to the consequences of Bmi1 loss of function in these organs.
Bmi1 overexpression increases the DNA methylation of an EphA7 promoter-associated CpG island
EPHA7 expression is low to absent in a large fraction of certain human hematological malignancies: germinal center B-cell Non-Hodgkin lymphomas [33], follicular lymphomas [34], and T cell lymphomas [39]. Moreover, reduced to absent EPHA7 expression has also been found in human colorectal cancer [40]. The reduction of EPHA7 gene expression in these tumor types can be explained by increased genomic methylation and genomic deletion of this locus with the former being a frequent event. Hypermethylation of EPHA7 without a corresponding analysis of gene expression levels has also been reported for human prostate cancer tissues and many human acute lymphoblastic leukemia lines and primary samples [41, 42]. Oricchio et al. showed that the secreted form of EPHA7 can act as a tumor suppressor in human follicular lymphoma [34]. Its tumor suppressor function is mediated by dominant-negative inhibition of EPHA2 dimerization and activation, thus blocking oncogenic EPHA2 signaling. The cause of EPHA7 silencing by DNA methylation in tumors has not been determined to date. We hypothesized that BMI-1 overexpression leads to a downregulation of EPHA7 expression in human tumors and that this event might then contribute to DNA methylation of the EPHA7 gene. To test this, the DNA methylation of three regions around the EphA7 transcriptional start site was analyzed by bisulfite-sequencing in Bmi1-overexpressing and empty control neurospheres (Figure 6).
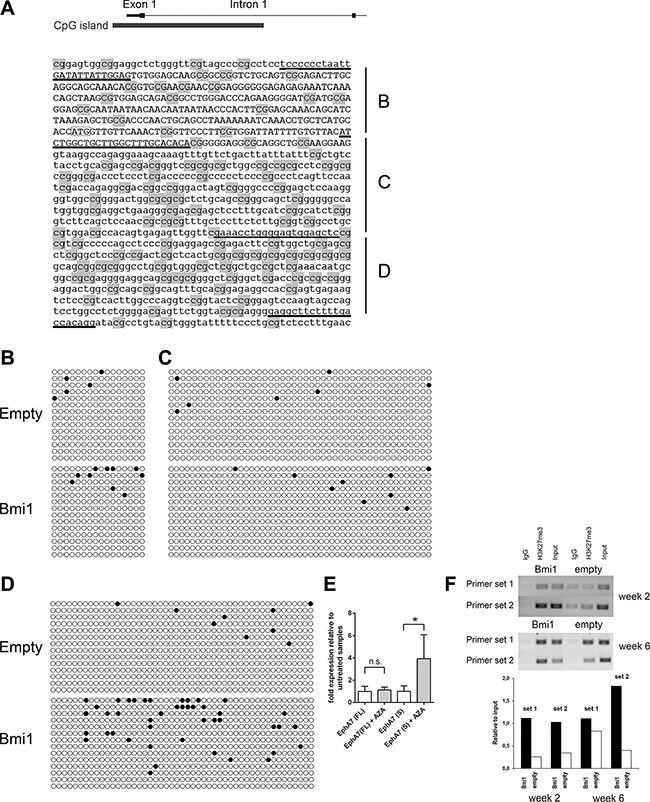
Figure 6: Overexpression of Bmi1 leads to increased DNA methylation of a genomic sequence within intron 1 of the EphA7 locus. (A) Mouse EphA7 genomic sequence including exon 1 (upper case) and the beginning of intron 1 (lower case). The start codon is marked by a box. Relative position of the CpG island is depicted on top. Underlined sequences indicate primers used to amplify three regions (B–D). CpGs are highlighted in grey. (B–D) Bisulfite sequence analysis of the three regions. Each row represents the sequence of an individual sequenced clone (open circle: unmethylated CpG site, filled circle: methylated CpG site). Clones from three independent biological samples of Bmi1- overexpressing and of empty control neurospheres cultured for 6 weeks after transduction were analyzed. The frequency of methylated CpGs was calculated for each clone and compared between Bmi1-overexpressing and empty control samples for each of the three regions. p-values of unpaired t-tests: region B p = 0.3351, region C p = 0.5611, region D p = 0.0029. (E) qRT-PCR of Bmi1-overexpressing NSPs cultured for 6 weeks after transduction shows an up-regulation of EphA7 secreted isoform upon AZA treatment. Results of unpaired t-tests (n = 3) are marked as follows: *p ≤ 0.05, ns: not significant (p > 0.05). (F) Agarose gel electrophoresis images of PCR-amplified EphA7 genomic regions (primer sets 1 and 2) using material from ChIP and input control samples as template . ChIP was performed with empty vector (empty) and pCMMP-Bmi1-FLAG-transduced NSP cells 2 and 6 weeks after transduction, applying an anti-H3K27me3 antibody. A matched IgG1 isotype antibody was used as negative control. Post-sonication cell lysate served as input control. Note the higher relative levels of bound H3K27me3 (H3K27me3 relative to input control) in Bmi1-overexpressing cells compared with empty control cells. The primer set 1 region is located 925 bp upstream of the EphA7 translation start site, the primer set 2 region is 341 bp upstream of this site.
Two weeks after the transduction of neurosphere cells, both empty control and Bmi1-overexpressing cells- the latter downregulating EphA7 (Figure 3C) - contained extremely few methylated cytosines within a promoter-associated CpG island (data not shown). However, in cells analyzed at a later time point - 6 weeks after viral transduction - DNA methylation levels within intron 1 of the EphA7 promoter-associated CpG island were higher in Bmi1-overexpressing cells and significantly different in comparison to empty control cells (Figure 6D, referring to segment “D” in Figure 6A). Addition of the demethylating agent AZA to cells 6 weeks after viral transduction led to an up-regulation of the secreted EphA7 variant (Figure 6E), indicating that the DNA methylation level present at this time point reduces EphA7 gene expression.
Interestingly, ChIP experiments revealed increased H3K27me3 levels at the EphA7 locus at 2 weeks and 6 weeks after transduction, indicating that this repressive mark which is known to be added by the PRC2 complex is present already before the onset of increased DNA methylation (Figure 6F).
Since we found BMI-1 to repress EphA7 in neural cells and lymphocytes and given that high BMI1 expression levels have been reported in two brain tumor types (medulloblastoma and glioblastoma, [43, 44]) and that the secreted form of EPHA7 functions as tumor suppressor in human follicular lymphoma [34], we asked if high BMI-1 levels might be a cause for the silencing of EPHA7 in these tumor types. To address this question, the correlation between BMI1 and EPHA7 expression levels in human follicular lymphoma, medulloblastoma and glioblastoma samples was calculated (see Materials and Methods for the Affymetrix gene expression datasets used). Spearman’s rank correlation coefficients were calculated for gene expression levels of EPHA7 in comparison to 20 human genes encoding components of mammalian PRC1 and PRC2. These analyses revealed a negative correlation between BMI1 and EPHA7 expression levels for the human follicular lymphoma and medulloblastoma datasets, but not for the glioblastoma datasets (Supplementary Information File S2, and data not shown). Taken together, our results support the idea that silencing of EPHA7 in human follicular lymphoma and medulloblastoma might occur upon BMI1 overexpression.
DISCUSSION
In this study we have established EphA7 as a direct BMI-1 target, which is downregulated upon Bmi1 overexpression and derepressed in the absence of BMI-1. Eph tyrosine kinase receptors mediate positive and negative effects on cell survival, adhesion, migration, and cell growth depending on the presence of membrane-bound ephrin ligands and co-receptors. Signaling of ephrin ligands/Eph receptors can occur bidirectionally – forward signaling by Eph receptors into the receptor-carrying cell and reverse signaling into the ligand-presenting cell. Truncated EphA7 T1, which lacks the intracellular domain, but retains the transmembrane domain [32], and the secreted variant S, which is devoid of both the intracellular and transmembrane domain [33], block signaling activities of full length EphA receptors [34, 45]. Our qRT-PCR data of Bmi1-overexpressing and knockout cells show that BMI-1 can in principle inhibit the expression of full length EphA7, the truncated variant T1 and the secreted variant S. Thus, consequences of BMI-1 repressive effects depend on the repertoire of expressed EphA7 variants in specific cell types. In normal B cells, EphA7 S acts as a tumor suppressor by dominant-negative inhibition of dimerization and activation of oncogenic EPHA2 and our data suggest that BMI1 overexpression may contribute to the development of tumors such as B-cell derived follicular lymphomas by repressing EPHA7 S. Despite the upregulation of EphA7 variants in Bmi1−/− cells and tissues, no attenuation of the altered spleen, thymus and bone marrow parameters and the abnormal cerebellar anatomy was observed in Bmi1−/−/EphA7−/− mice. These results indicate that BMI-1 acts through other target genes in these organs. We did however find that deletion of EphA7 leads to a partial rescue of the reduced cell proliferation in the dorsolateral corner of the LVW in Bmi1−/− mice. In the postnatal mouse brain, a large number of neural stem cells, specialized types of glia cells, reside in the wall of the lateral ventricles [46]. These cells self-renew and turn into neural progenitor cells, also called transit amplifying C cells, which generate neuroblasts that leave the LVW and migrate along the rostral migratory stream to the olfactory bulb where they differentiate into interneurons. Besides neural stem cells and their progeny, other cell types such as ependymal cells make up the specialized stem cell niche at the LVW. The dorsolateral corner of this region contains the highest number of proliferating cells [47]. Holmberg et al. found that ependymal cells and neural stem cells in the adult murine LVW express EphA7 and that the progeny of neural stem cells in this region, Mash1-positive neural progenitor cells and PSA-NCAM-positive neuroblasts, express the ligand ephrin-A2 [48]. They furthermore showed that this ligand/receptor system acts to negatively regulate neural progenitor proliferation by ephrin-A2 reverse signaling. Our experiments revealed that BMI-1 serves to maintain proliferation in this region and that part of this effect is due to EphA7 repression. Considering the findings by Holmberg et al., this BMI-1-mediated effect could be explained by reduced EphA7 levels leading to an attenuation of the anti-proliferative EphA7/ephrin-A2 reverse signaling in neural progenitor cells. The expression of different EphA7 variants in adult neural stem/progenitor cells cultured as neurospheres, two of which (T1 and S) have been shown to block full length EphA7 signaling activity, may implicate that multiple mechanisms are present to fine tune the activity of this neural stem cell/progenitor signaling system. Since we did not detect a complete rescue of proliferating cell numbers in Bmi1−/−/EphA7−/− animals, we conclude that other BMI-1 target genes also contribute to this defect. Noticeable differences have been found between in vivo and in vitro obtained results on BMI-1 functions in neural stem/progenitor cells. The positive effect on neural stem/progenitor self-renewal in cell culture can largely be attributed to the repression of p16Ink4a and p19Arf, genes which are upregulated in cultured cells [49, 50], but are not expressed in the fetal and young adult brain in vivo ([14] and references therein). The fact that in our study, deletion of both EphA7 and Bmi1 did not lead to an increased cell number (neurosphere diameter) or neurosphere self-renewal compared to single Bmi1 knockout in vitro, is very likely due to the large effect increased Ink4a/Arf levels have on these cultured cells. In addition, loss of the LVW stem cell niche architecture under cell culture conditions may contribute to the different in vitro and in vivo results.
Hypermethylation of the EphA7 gene in human and murine tumors has been detected at CpG islands around the transcriptional start site [33, 34, 39–42] and is associated with a downregulation of EphA7 transcripts. Our bisulfite sequencing and AZA treatment data suggest that a delayed DNA methylation process at an EphA7 promoter-associated CpG island can be triggered by Bmi1 overexpression and that this has an impact on EphA7 gene expression levels. This late effect occurs after the acute EphA7 repression that is immediately detectable upon Bmi1 overexpression and that is accompanied by the presence of the repressive histone modification H3K27me3. CpG islands are associated with approximately 70% of annotated vertebrate gene promoters and are generally DNA methylation-free. In tumor cells however, many promoter CpG islands are hypermethylated and this is associated with chromatin compaction and stable long-term silencing of gene expression [51, 52]. DNA methylation is mediated by DNA methyltransferases (DNMTs), however it remains unclear how this activity is targeted to specific genomic sites [53].
How could elevated levels of the PRC1 component BMI-1 initiate DNA methylation? Several studies provide evidence for a connection between PRC binding/activity and DNA methylation. A positive correlation has been reported between genes hypermethylated in cancer cells and genes bound by PRC2 subunits and the PRC2 histone mark H3K27me3 in embryonic stem (ES) and other cells [54–56]. Moreover, a large overlap between DNMT3B target genes in B cells and PRC1 and PRC2 target genes in ES cells or embryonic fibroblasts has been found in different cell types [57]. Studies with ES cells point to a transition from a PRC-bound state of certain genes in undifferentiated cells to a DNA methylated state in their differentiated progeny. Promoters which are occupied by H3K27me3 in ES cells are more likely to gain DNA methylation during differentiation [58]. Furthermore, loss of Fbxl10 leads to a de novo methylation of CpG islands that are bound by PRC1 and PRC2 components, and this does not occur at CpG islands that are PRC-free [59], indicating that the presence of PRC might represent a prerequisite for this de novo DNA methylation. Interestingly, mixed states of PRC occupancy and DNA methylation have been found in somatic and cancer cells: loci with overlapping H3K27me3 and methylated DNA have been described [54, 60, 61] and genes that are enriched for H3K27me3 in normal cells can display H3K27me3 and DNA methylation or DNA methylation only in cancer cell lines of the same tissue [54, 62].
A possible explanation for these data is that silencing at certain loci might be induced by PRCs, followed by DNA methylation and subsequent loss of PRC binding at DNA-methylated regions. The circumstances and molecular mechanisms of such a scenario remain to be established. Potential hints at how PcG proteins are involved in DNA methylation are provided by studies showing that the PRC2 component EZH2, which catalyzes H3K27me3, can recruit DNMTs [63] and that BMI-1 forms a complex with DNMT1, DNMT1A and RING1B, and cooperates with DNMT1A [64]. In this context it is important to note that recent investigations have reported considerable de novo methylation activity of DNMT1 ([53] and references therein).
In the context of our study, both PRC1 and PRC2 components seem to be involved in the repression of EphA7. BMI-1 is part of both canonical and non-canonical PRC1, which can be found in the vicinity of the same gene [18] and the presence of H3K37me3- a histone mark known to be deposited by PRC2- preceded DNA methylation at the EphA7 locus. An alternative explanation to a direct involvement of BMI-1 in mediating DNA methylation at this locus is that a decreased gene expression state per se may render the EphA7 locus more prone to become DNA methylated and thus explains the late increase in DNA methylation upon Bmi1 overexpression. In any case, slow increases in DNA methylation of BMI-1 target genes including EphA7might in turn make them more amenable to further silencing events, finally leading to a highly methylated state as found in tumor cells. Although our data suggest that a delayed DNA methylation process is initiated upon Bmi1 overexpression, investigation of different stages of tumor development in vivo will be required to better understand the dynamics and mechanisms of de novo DNA methylation at the EphA7 locus. Collectively, our study has revealed EphA7 repression as a new mechanism by which BMI-1 controls cell proliferation in the postnatal LVW and provides novel molecular support for a connection between Polycomb group proteins and tumor suppressor gene silencing.
MATERIALS AND METHODS
Animals
Bmi1 knockout mice (C57BL/6 background) were kindly provided by Maarten van Lohuizen [4]. EphA7 knockout mice [35] were from Charles River/The Jackson Laboratory (Epha7
Statistical analyses
Statistical analyses were performed with GraphPad Prism 6 (GraphPad Software, San Diego, USA) if not stated otherwise.
Neurosphere culture and transduction
Neurospheres from postnatal and embryonic day E14.5 were isolated, cultured and transduced according to [65]. The pCMMP-IRES2-eGFP retroviral vector with mouse Bmi1 cDNA , Bmi1-FLAG cDNA (C-terminal FLAG-tag) or without an insert (empty control) upstream of the IRES site was used [65]. GFP-positive cells were sorted using a FACSAriaIII (BD Biosciences, San Jose, USA).
In vitro neurosphere assays
Neurosphere cells (NSPs) from 4 week-old CD1 mice were transduced with pCMMP-Bmi1, pCMMP-Bmi1-FLAG and empty vectors and plated in triplicates at clonal density (2,000 cells per well, i.e. 1 cell/μL or 1–2 cells/cm2) in standard 6-well plates (TPP, Trasadingen, Switzerland). At each passage (7–10 days after plating), NSPs were counted microscopically. After dissociation with Accutase and resuspension in NSP medium, viable cell numbers (identified by trypan blue dye exclusion; Sigma-Aldrich, St. Louis, USA) for each well were determined with a hemocytometer (Neubauer chamber; Roth, Karlsruhe, Germany).
Microarray analysis
Microarray hybridizations were done as described in [65]. The data can be retrieved from the GEO database (accession number GSE70451). Normalized data were further analyzed with MaxDView (http://www.bioinf.manchester.ac.uk/microarray/maxd/maxdView/). A t-test was applied to compare Bmi1-overexpressing and empty vector control samples (n = 3 of each). Differential expression of genes was considered relevant in case of a p2value below 0.001 and a mean log difference of at least 1.
ChIP
NSP cells from 4–6 week old CD1 mice transduced with pCMMP-Bmi1-FLAG and empty vectors were sorted by flow cytometry based on GFP and used for ChIP with an anti-FLAG antibody. For H3K27me ChIP, the same cellular material as for the DNA methylation analyses was used (transduced and sorted NSPs from 2–3 week old C57BL/6 mice). For details, see Supplementary Information Materials and Methods.
Isolation, culture and transduction of B cells from mouse spleen
Spleen tissue from 6 week-old mice was homogenized in cell buffer (5% FBS and 2.5 mM EDTA in PBS), red blood cells were removed using NH4Cl and the resulting cell suspension was filtered (30 μm filter, BD Bioscience) and CD19-positive cells were isolated. Additional details, cell culture and transduction are described in Supplementary Information Materials and Methods.
Cellularity of hematopoietic organs
Isolated thymus, spleen and bone marrow cells were counted with a hemocytometer (Neubauer chamber; Roth) (see also Supplementary Information Materials and Methods).
qRT-PCR
Total RNA was isolated with the all prep RNA/DNA mini kit (Qiagen, Valencia, USA). RNA was converted to cDNA using M-MLV Reverse Transcriptase (Promega, Madison, USA) and random hexamers (Thermo Scientific, Waltham, USA). qPCR was performed with the Power SYBR green PCR master mix using a Step one Plus thermocycler (Applied Biosystems, Waltham, USA) with the following reaction conditions: 95°C for 10 min, 95°C for 30 s and 60°C for 1 min (except for EphA7-FL and EphA7-S, 63°C for 1:45 minute), steps 2–3 were repeated 45 times. Data were normalized to Tbp. Primer sequences are listed in Supplementary Information Materials and Methods.
Immunostaining of tissue sections
Cryosections of brains from 6–7 week old mice were stained with rabbit anti-Ki67 (1:500, Novacastra laboratories, Wetzlar, Germany), goat anti-Dcx (1:100, Santa Cruz biotechnologies), mouse anti-Mash1 (BD Pharmingen). Secondary antibodies coupled with Cy3, Cy5 and Alexa488 (1:300, Jackson ImmunoResearch laboratories, West Grove, USA) were used (see also Supplementary Information Materials and Methods).
Quantification of Ki67-positive cells
Coronal sections of anterior and posterior locations of the brain were analyzed. Sections were chosen based on visual hallmarks (anterior sections at around 1.0–0.9 mm from bregma, posterior sections about 0.02 mm from bregma (as defined in [66]).
Ki67-positive nuclei and DAPI-positive nuclei were counted around the dorsolateral corner of the LVW (100 μm medially and 250 μm ventrally). Only cells with a distinct colocalization of DAPI and Ki67 were considered Ki67-positive. For each brain, one representative section was analyzed and nuclei in the dorsolateral corner were counted in the two lateral ventricles present on each tissue section.
DNA methylation analysis
Genomic DNA was isolated from NSPs (derived from 2–3 week old C57BL/6 mice) using the all prep DNA/RNA mini kit (Qiagen). Bisulfite conversion and purification was done with the Epimark Bisulfite Conversion Kit following the instructions of the manufacturer (New England Biolabs, Ipswich, USA). See Supplementary Information Materials and Methods. The frequency of methylated CpGs of each clone was calculated as ratio of the number of methylated CpGs/total number of CpGs.
AZA treatment
NSPs kept in culture for 6 weeks after transduction with Bmi1-FLAG were plated at a density of 100,000 cells per well of a 6 well plate. Three days later, formed spheres were treated with 5 μM 5-Aza-2′-deoxycytidine (AZA, Sigma) for 48 h, with medium and drug renewal every 24 h. Cells were harvested, washed in cold PBS, and processed for RNA extraction.
Calculation of Spearman’s rank correlation coefficients
Raw Affymetrix gene expression data of human follicular lymphoma (Gene Expression Omnibus series GSE37088), human glioblastoma (GSE4290 and GSE4536), and human medulloblastoma GSE37382 and GSE37418) were analyzed using the R LIMMA package [67–69]. Expression estimates were calculated using RMA and normalized using quantile normalization. Spearman’s rank correlation coefficients were calculated between human EPHA7 and 20 genes coding for components of mammalian PCR1 (RING1 [RING1A], RNF2 [RING1B], CBX2, CBX4, CBX6, CBX7, CBX8, PCGF1, PCGF2, PCGF3, BMI1 (PCGF4), PCGF5, PCGF6, PHC1, PHC2, PHC3) and PCR2 (EZH1, EZH2, EED, SUZ12) complexes using the R cor.test function [70, 71].
ACKNOWLEDGMENTS
We thank Maarten van Lohuizen for providing Bmi1 knockout mice. We are grateful to Ann-Charlott Olsson and Ann-Sofie Albrekt for microarray hybridizations and normalization.
CONFLICTS OF INTEREST
The authors declare no conflicts of interest.
GRANT SUPPORT
This work was supported by grants from the Swedish Research Council (Vetenskapsrådet, VR521-2010-4508), the Swedish Cancer Society (Cancerfonden, CAN2012/588), the Swedish Childhood Cancer Society (Barncancerfonden, BCF12/2007), AFA insurance (AFA120261), and StemTherapy.
Authors’ contributions
G.P., S.B., F.H., U.A.N.: conception and design G.P.,S.B., F.H., M.W., L.J., S.N., I.L., N.O., K.M., U.A.N. collection and/or assembly of data G.P., S.B., F.H., M.W., S.L., U.A.N.: Data analysis and interpretation G.P., S.B., F.H., M.W., I.A., U.A.N.: manuscript writing.
REFERENCES
1. Haupt Y, Alexander WS, Barri G, Klinken SP, Adams JM. Novel zinc finger gene implicated as myc collaborator by retrovirally accelerated lymphomagenesis in E mu-myc transgenic mice. Cell. 1991; 65:753–763.
2. van Lohuizen M, Verbeek S, Scheijen B, Wientjens E, van der Gulden H, Berns A. Identification of cooperating oncogenes in E mu-myc transgenic mice by provirus tagging. Cell. 1991; 65:737–752.
3. Di Croce L, Helin K. Transcriptional regulation by Polycomb group proteins. Nat Struct Mol Biol. 2013; 20:1147–1155.
4. van der Lugt NM, Domen J, Linders K, van Roon M, Robanus-Maandag E, te Riele H, van der Valk M, Deschamps J, Sofroniew M, van Lohuizen M, et al. Posterior transformation, neurological abnormalities, and severe hematopoietic defects in mice with a targeted deletion of the bmi-1 proto-oncogene. Genes Dev. 1994; 8:757–769.
5. Molofsky AV, Pardal R, Iwashita T, Park IK, Clarke MF, Morrison SJ. Bmi-1 dependence distinguishes neural stem cell self-renewal from progenitor proliferation. Nature. 2003; 425:962–967.
6. Park IK, Qian D, Kiel M, Becker MW, Pihalja M, Weissman IL, Morrison SJ, Clarke MF. Bmi-1 is required for maintenance of adult self-renewing haematopoietic stem cells. Nature. 2003; 423:302–305.
7. Biehs B, Hu JK, Strauli NB, Sangiorgi E, Jung H, Heber RP, Ho S, Goodwin AF, Dasen JS, Capecchi MR, Klein OD. BMI1 represses Ink4a/Arf and Hox genes to regulate stem cells in the rodent incisor. Nat Cell Biol. 2013; 15:846–852.
8. Dovey JS, Zacharek SJ, Kim CF, Lees JA. Bmi1 is critical for lung tumorigenesis and bronchioalveolar stem cell expansion. Proceedings of the National Academy of Sciences of the United States of America. 2008; 105:11857–11862.
9. Fasano CA, Dimos JT, Ivanova NB, Lowry N, Lemischka IR, Temple S. shRNA knockdown of Bmi-1 reveals a critical role for p21-Rb pathway in NSC self-renewal during development. Cell Stem Cell. 2007; 1:87–99.
10. Lopez-Arribillaga E, Rodilla V, Pellegrinet L, Guiu J, Iglesias M, Roman AC, Gutarra S, Gonzalez S, Munoz-Canoves P, Fernandez-Salguero P, Radtke F, Bigas A, Espinosa L. Bmi1 regulates murine intestinal stem cell proliferation and self-renewal downstream of Notch. Development. 2015; 142:41–50.
11. Oguro H, Yuan J, Ichikawa H, Ikawa T, Yamazaki S, Kawamoto H, Nakauchi H, Iwama A. Poised lineage specification in multipotential hematopoietic stem and progenitor cells by the polycomb protein Bmi1. Cell Stem Cell. 2010; 6:279–286.
12. Iwama A, Oguro H, Negishi M, Kato Y, Morita Y, Tsukui H, Ema H, Kamijo T, Katoh-Fukui Y, Koseki H, van Lohuizen M, Nakauchi H. Enhanced self-renewal of hematopoietic stem cells mediated by the polycomb gene product Bmi-1. Immunity. 2004; 21:843–851.
13. Fasano CA, Phoenix TN, Kokovay E, Lowry N, Elkabetz Y, Dimos JT, Lemischka IR, Studer L, Temple S. Bmi-1 cooperates with Foxg1 to maintain neural stem cell self-renewal in the forebrain. Genes Dev. 2009; 23:561–574.
14. He S, Iwashita T, Buchstaller J, Molofsky AV, Thomas D, Morrison SJ. Bmi-1 over-expression in neural stem/progenitor cells increases proliferation and neurogenesis in culture but has little effect on these functions in vivo. Dev Biol. 2009; 328:257–272.
15. Yadirgi G, Leinster VH, Acquati S, Bhagat H, Shakhova O, Marino S. Conditional Activation of Bmi1 Expression Regulates Self Renewal, Apoptosis and Differentiation of Neural Stem/Progenitor Cells in vitro and in vivo. Stem Cells. 2011.
16. Radulovic V, de Haan G, Klauke K. Polycomb-group proteins in hematopoietic stem cell regulation and hematopoietic neoplasms. Leukemia. 2013; 27:523–533.
17. Cao L, Bombard J, Cintron K, Sheedy J, Weetall ML, Davis TW. BMI1 as a novel target for drug discovery in cancer. J Cell Biochem. 2011; 112:2729–2741.
18. Gao Z, Zhang J, Bonasio R, Strino F, Sawai A, Parisi F, Kluger Y, Reinberg D. PCGF homologs, CBX proteins, and RYBP define functionally distinct PRC1 family complexes. Molecular cell. 2012; 45:344–356.
19. Farcas AM, Blackledge NP, Sudbery I, Long HK, McGouran JF, Rose NR, Lee S, Sims D, Cerase A, Sheahan TW, Koseki H, Brockdorff N, Ponting CP, et al. KDM2B links the Polycomb Repressive Complex 1 (PRC1) to recognition of CpG islands. eLife. 2012; 1:e00205.
20. Wu X, Johansen JV, Helin K. Fbxl10/Kdm2b recruits polycomb repressive complex 1 to CpG islands and regulates H2A ubiquitylation. Molecular cell. 2013; 49:1134–1146.
21. He J, Shen L, Wan M, Taranova O, Wu H, Zhang Y. Kdm2b maintains murine embryonic stem cell status by recruiting PRC1 complex to CpG islands of developmental genes. Nature cell biology. 2013; 15:373–384.
22. Cao R, Tsukada Y, Zhang Y. Role of Bmi-1 and Ring1A in H2A ubiquitylation and Hox gene silencing. Molecular cell. 2005; 20:845–854.
23. Blackledge NP, Farcas AM, Kondo T, King HW, McGouran JF, Hanssen LL, Ito S, Cooper S, Kondo K, Koseki Y, Ishikura T, Long HK, Sheahan TW, et al. Variant PRC1 complex-dependent H2A ubiquitylation drives PRC2 recruitment and polycomb domain formation. Cell. 2014; 157:1445–1459.
24. Cooper S, Dienstbier M, Hassan R, Schermelleh L, Sharif J, Blackledge NP, De Marco V, Elderkin S, Koseki H, Klose R, Heger A, Brockdorff N. Targeting polycomb to pericentric heterochromatin in embryonic stem cells reveals a role for H2AK119u1 in PRC2 recruitment. Cell reports. 2014; 7:1456–1470.
25. Jacobs JJ, Kieboom K, Marino S, DePinho RA, van Lohuizen M. The oncogene and Polycomb-group gene bmi-1 regulates cell proliferation and senescence through the ink4a locus. Nature. 1999; 397:164–168.
26. Bracken AP, Kleine-Kohlbrecher D, Dietrich N, Pasini D, Gargiulo G, Beekman C, Theilgaard-Monch K, Minucci S, Porse BT, Marine JC, Hansen KH, Helin K. The Polycomb group proteins bind throughout the INK4A-ARF locus and are disassociated in senescent cells. Genes Dev. 2007; 21:525–530.
27. Zacharek SJ, Fillmore CM, Lau AN, Gludish DW, Chou A, Ho JW, Zamponi R, Gazit R, Bock C, Jager N, Smith ZD, Kim TM, Saunders AH, et al. Lung stem cell self-renewal relies on BMI1-dependent control of expression at imprinted loci. Cell Stem Cell. 2011; 9:272–281.
28. Gargiulo G, Cesaroni M, Serresi M, de Vries N, Hulsman D, Bruggeman SW, Lancini C and van Lohuizen M. In vivo RNAi screen for BMI1 targets identifies TGF-beta/BMP-ER stress pathways as key regulators of neural- and malignant glioma-stem cell homeostasis. Cancer Cell. 2013; 23:660–676.
29. Chagraoui J, Niessen SL, Lessard J, Girard S, Coulombe P, Sauvageau M, Meloche S, Sauvageau G. E4F1: a novel candidate factor for mediating BMI1 function in primitive hematopoietic cells. Genes Dev. 2006; 20:2110–2120.
30. Calao M, Sekyere EO, Cui HJ, Cheung BB, Thomas WD, Keating J, Chen JB, Raif A, Jankowski K, Davies NP, Bekkum MV, Chen B, Tan O, et al. Direct effects of Bmi1 on p53 protein stability inactivates oncoprotein stress responses in embryonal cancer precursor cells at tumor initiation. Oncogene. 2013; 32:3616–3626.
31. Matheu A, Klatt P, Serrano M. Regulation of the INK4a/ARF locus by histone deacetylase inhibitors. J Biol Chem. 2005; 280:42433–42441.
32. Ciossek T, Millauer B, Ullrich A. Identification of alternatively spliced mRNAs encoding variants of MDK1, a novel receptor tyrosine kinase expressed in the murine nervous system. Oncogene. 1995; 10:97–108.
33. Dawson DW, Hong JS, Shen RR, French SW, Troke JJ, Wu YZ, Chen SS, Gui D, Regelson M, Marahrens Y, Morse HC 3rd, Said J, Plass C, et al. Global DNA methylation profiling reveals silencing of a secreted form of Epha7 in mouse and human germinal center B-cell lymphomas. Oncogene. 2007; 26:4243–4252.
34. Oricchio E, Nanjangud G, Wolfe AL, Schatz JH, Mavrakis KJ, Jiang M, Liu X, Bruno J, Heguy A, Olshen AB, Socci ND, Teruya-Feldstein J, Weis-Garcia F, et al. The Eph-receptor A7 is a soluble tumor suppressor for follicular lymphoma. Cell. 2011; 147:554–564.
35. Rashid T, Upton AL, Blentic A, Ciossek T, Knoll B, Thompson ID, Drescher U. Opposing gradients of ephrin-As and EphA7 in the superior colliculus are essential for topographic mapping in the mammalian visual system. Neuron. 2005; 47:57–69.
36. Janes PW, Nievergall E, Lackmann M. Concepts and consequences of Eph receptor clustering. Semin Cell Dev Biol. 2012; 23:43–50.
37. Gucciardo E, Sugiyama N, Lehti K. Eph- and ephrin-dependent mechanisms in tumor and stem cell dynamics. Cell Mol Life Sci. 2014; 71:3685–3710.
38. Zencak D, Lingbeek M, Kostic C, Tekaya M, Tanger E, Hornfeld D, Jaquet M, Munier FL, Schorderet DF, van Lohuizen M, Arsenijevic Y. Bmi1 loss produces an increase in astroglial cells and a decrease in neural stem cell population and proliferation. The Journal of neuroscience. 2005; 25:5774–5783.
39. Lopez-Nieva P, Vaquero C, Fernandez-Navarro P, Gonzalez-Sanchez L, Villa-Morales M, Santos J, Esteller M, Fernandez-Piqueras J. EPHA7, a new target gene for 6q deletion in T-cell lymphoblastic lymphomas. Carcinogenesis. 2012; 33:452–458.
40. Wang J, Kataoka H, Suzuki M, Sato N, Nakamura R, Tao H, Maruyama K, Isogaki J, Kanaoka S, Ihara M, Tanaka M, Kanamori M, Nakamura T, et al. Downregulation of EphA7 by hypermethylation in colorectal cancer. Oncogene. 2005; 24:5637–5647.
41. Guan M, Xu C, Zhang F, Ye C. Aberrant methylation of EphA7 in human prostate cancer and its relation to clinicopathologic features. Int J Cancer. 2009; 124:88–94.
42. Kuang SQ, Bai H, Fang ZH, Lopez G, Yang H, Tong W, Wang ZZ, Garcia-Manero G. Aberrant DNA methylation and epigenetic inactivation of Eph receptor tyrosine kinases and ephrin ligands in acute lymphoblastic leukemia. Blood. 2010; 115:2412–2419.
43. Leung C, Lingbeek M, Shakhova O, Liu J, Tanger E, Saremaslani P, Van Lohuizen M, Marino S. Bmi1 is essential for cerebellar development and is overexpressed in human medulloblastomas. Nature. 2004; 428:337–341.
44. Abdouh M, Facchino S, Chatoo W, Balasingam V, Ferreira J, Bernier G. BMI1 sustains human glioblastoma multiforme stem cell renewal. The Journal of neuroscience. 2009; 29:8884–8896.
45. Holmberg J, Clarke DL, Frisen J. Regulation of repulsion versus adhesion by different splice forms of an Eph receptor. Nature. 2000; 408:203–206.
46. Lim DA, Alvarez-Buylla A. Adult neural stem cells stake their ground. Trends in neurosciences. 2014; 37:563–571.
47. Morshead CM, van der Kooy D. Postmitotic death is the fate of constitutively proliferating cells in the subependymal layer of the adult mouse brain. The Journal of neuroscience. 1992; 12:249–256.
48. Holmberg J, Armulik A, Senti KA, Edoff K, Spalding K, Momma S, Cassidy R, Flanagan JG, Frisen J. Ephrin-A2 reverse signaling negatively regulates neural progenitor proliferation and neurogenesis. Genes Dev. 2005; 19:462–471.
49. Lowe SW, Sherr CJ. Tumor suppression by Ink4a-Arf: progress and puzzles. Curr Opin Genet Dev. 2003; 13:77–83.
50. Sherr CJ, DePinho RA. Cellular senescence: mitotic clock or culture shock? Cell. 2000; 102:407–410.
51. Kulis M, Esteller M. DNA methylation and cancer. Advances in genetics. 2010; 70:27–56.
52. Deaton AM, Bird A. CpG islands and the regulation of transcription. Genes & development. 2011; 25:1010–1022.
53. Jeltsch A, Jurkowska RZ. New concepts in DNA methylation. Trends in biochemical sciences. 2014; 39:310–318.
54. Schlesinger Y, Straussman R, Keshet I, Farkash S, Hecht M, Zimmerman J, Eden E, Yakhini Z, Ben-Shushan E, Reubinoff BE, Bergman Y, Simon I, Cedar H. Polycomb-mediated methylation on Lys27 of histone H3 pre-marks genes for de novo methylation in cancer. Nature genetics. 2007; 39:232–236.
55. Ohm JE, McGarvey KM, Yu X, Cheng L, Schuebel KE, Cope L, Mohammad HP, Chen W, Daniel VC, Yu W, Berman DM, Jenuwein T, Pruitt K, et al. A stem cell-like chromatin pattern may predispose tumor suppressor genes to DNA hypermethylation and heritable silencing. Nature genetics. 2007; 39:237–242.
56. Widschwendter M, Fiegl H, Egle D, Mueller-Holzner E, Spizzo G, Marth C, Weisenberger DJ, Campan M, Young J, Jacobs I, Laird PW. Epigenetic stem cell signature in cancer. Nature genetics. 2007; 39:157–158.
57. Jin B, Yao B, Li JL, Fields CR, Delmas AL, Liu C, Robertson KD. DNMT1 and DNMT3B modulate distinct polycomb-mediated histone modifications in colon cancer. Cancer research. 2009; 69:7412–7421.
58. Mohn F, Weber M, Rebhan M, Roloff TC, Richter J, Stadler MB, Bibel M, Schubeler D. Lineage-specific polycomb targets and de novo DNA methylation define restriction and potential of neuronal progenitors. Molecular cell. 2008; 30:755–766.
59. Boulard M, Edwards JR, Bestor TH. FBXL10 protects Polycomb-bound genes from hypermethylation. Nature genetics. 2015; 47:479–485.
60. Statham AL, Robinson MD, Song JZ, Coolen MW, Stirzaker C, Clark SJ. Bisulfite sequencing of chromatin immunoprecipitated DNA (BisChIP-seq) directly informs methylation status of histone-modified DNA. Genome research. 2012; 22:1120–1127.
61. Moison C, Senamaud-Beaufort C, Fourriere L, Champion C, Ceccaldi A, Lacomme S, Daunay A, Tost J, Arimondo PB, Guieysse-Peugeot AL. DNA methylation associated with polycomb repression in retinoic acid receptor beta silencing. FASEB. 2013; 27:1468–1478.
62. Gal-Yam EN, Egger G, Iniguez L, Holster H, Einarsson S, Zhang X, Lin JC, Liang G, Jones PA, Tanay A. Frequent switching of Polycomb repressive marks and DNA hypermethylation in the PC3 prostate cancer cell line. Proceedings of the National Academy of Sciences of the United States of America. 2008; 105:12979–12984.
63. Vire E, Brenner C, Deplus R, Blanchon L, Fraga M, Didelot C, Morey L, Van Eynde A, Bernard D, Vanderwinden JM, Bollen M, Esteller M, Di Croce L, et al. The Polycomb group protein EZH2 directly controls DNA methylation. Nature. 2006; 439:871–874.
64. Negishi M, Saraya A, Miyagi S, Nagao K, Inagaki Y, Nishikawa M, Tajima S, Koseki H, Tsuda H, Takasaki Y, Nakauchi H, Iwama A. Bmi1 cooperates with Dnmt1-associated protein 1 in gene silencing. Biochemical and biophysical research communications. 2007; 353:992–998.
65. Hertwig F, Meyer K, Braun S, Ek S, Spang R, Pfenninger CV, Artner I, Prost G, Chen X, Biegel JA, Judkins AR, Englund E, Nuber UA. Definition of genetic events directing the development of distinct types of brain tumors from postnatal neural stem/progenitor cells. Cancer research. 2012; 72:3381–3392.
66. Paxinos G, Franklin KBJ. The Mouse brain in Stereotaxic Coordinates. (London: Elsevier Academic Press). 2004.
67. Smyth GK. Linear models and empirical bayes methods for assessing differential expression in microarray experiments. Stat Appl Genet Mol Biol. 2004; 3:1–25.
68. Smyth GK. (2005). Limma: linear models for microarray data. In: Gentleman R, Carey V, Dudoit S, Irizarry R, Huber W, eds. Bioinformatics and Computational Biology Solutions using R and Bioconductor. (New York: Springer). 397–420.
69. Smyth GK, Michaud J, Scott HS. Use of within-array replicate spots for assessing differential expression in microarray experiments. Bioinformatics. 2005; 21:2067–2075.
70. Best DJ, Roberts DE. The Upper Tail Probabilities of Spearman‘s Rho. Journal of the Royal Statistical Society Series C (Applied Statistics). 1975; 24:377–379
71. Hollander MD, Wolfe DA. Kendall and Spearman tests. Nonparametric Statistical Methods. (New York: John Wiley & Sons). 1973; 185–194.