
INTRODUCTION
Glioblastoma is the most frequently occurring primary malignant tumor of the central nervous system [1]. Since the introduction of temozolomide in 2005 [2], clinical studies testing novel agents for glioblastoma have failed to yield new therapeutic options [3, 4]. Given the heterogeneous mechanisms by which these drugs exert their anti-tumor activity, it is likely that only a subset of patients harboring specific molecular aberrations in their tumors would benefit from these agents. Therefore, it is imperative to preclinically identify predictive biomarkers that can be used to enrich clinical trials with patients who are likely to respond [5].
Recent studies have shown that glioblastomas contain aberrations largely in genes involved in Rb, p53 and receptor tyrosine kinase (RTK)/Ras/phosphatidylinositol-3-kinase (PI3K) signaling pathways [6, 7]. In order to discover therapeutic biomarkers that might aid in identifying glioblastoma patients most likely to respond to drugs targeting these pathways, we tested a panel of 11 different small molecule compounds on 25 patient-derived glioblastoma stem-like cell cultures (GSCs). GSCs are known to better preserve the gene expression profile [8], CNVs [8-10] and point mutations [9] of the parental tumor tissue than established cell lines. Furthermore, GSCs are more suitable for high-throughput drug screening compared to neurosphere cultures.
Herein, we present targeted exome sequencing of these 25 glioblastomas and drug sensitivity data of the corresponding patient-derived GSCs.
RESULTS
Exome sequencing data of parental glioblastoma tissue
To identify mutations present within our cohort of glioblastoma samples (N=25), we performed targeted exome sequencing of 1971 manually curated cancer-related genes. 16 patient samples were derived from primary glioblastomas, and the remaining 9 from relapsed glioblastomas. In total, 829 mutations were detected, ranging from 9-68 (average=21.5, SD=13.3) and 11-179 (average=53.9, SD=56.6) mutations in primary and relapsed glioblastomas, respectively. We identified 36 recurrently mutated genes (occurring three or more times) and 9 recurrent copy number variations (CNV) (Supplementary Table S1). TTN, PTEN, EGFR and TP53 were amongst the top 4 most frequently mutated genes (Supplementary Table S1). PTEN, EGFR and TP53 mutations have previously been implicated in gliomagenesis [7], whereas TTN most likely is a passenger mutation [11].
Glioblastoma stem-like cell cultures respond heterogeneously to single compound treatments
To address the functional relevance of the 3 main deregulated pathways (RTK/Ras/PI3K, p53, Rb) in glioblastoma, we assembled a panel of 11 small molecule compounds either inhibiting the RTK/Ras/PI3K and Rb pathway, or reactivating the p53 pathway (Supplementary Table S2). We determined the GI50 (50% growth inhibitory concentration) after 8 days of drug exposure across 25 patient-derived GSCs. GSK2636771, a PI3Kß-selective inhibitor, had a GI50 of >50 μM in several GSCs (data not shown), and was therefore excluded from further experiments due to its failure to inhibit cell proliferation potently.
We observed heterogeneous drug responses across the GSCs for 9 out of the remaining 10 compounds (GI50SD >0.29 μM); only SNS-032 (CDK2/7/9 inhibitor) (GI50average =0.14 μM, GI50SD =0.056 μM) elicited a relatively homogeneous response across the 25 GSCs (Figure 1A). Unsupervised hierarchical clustering of Z-transformed drug sensitivity data did not reveal an obvious clustering pattern of the pathway-classified compounds (Supplementary Figure S1). Supervised clustering according to the pathway-classified compounds revealed a group of GSCs (4/25) which were on average at least 1.7 fold more resistant to 4 out of 5 RTK/Ras/PI3K targeting drugs and at least 1.5 fold more resistant to all (3/3) of the Rb pathway targeting compounds (Figure 1B). In contrast, this group was 5.7 fold more sensitive to the MDM2 inhibitor, Nutlin-3. There were no differences in drug sensitivity between primary and relapsed samples.
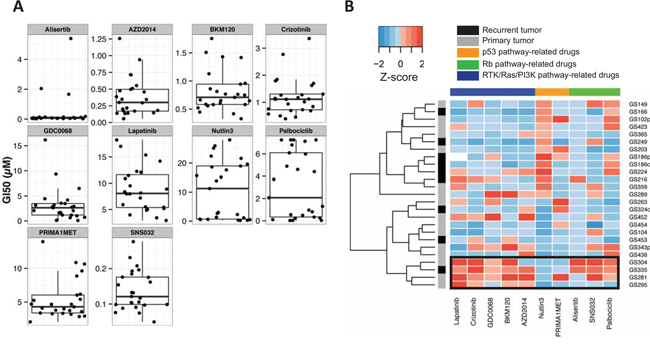
Figure 1: GI50 values of 25 GSCs for a panel of small molecule compounds. A. Boxplot and dotplot in which each dot represents the GI50 value (μM) of a GSC to a specific compound. B. Supervised clustering of Z-transformed GI50 values (μM) was performed across the pathway-classified compounds. Unsupervised clustering was performed across the GSCs by complete linkage using euclidean distance. White, missing value; black rectangle, cluster of GSCs resistant to several compounds targeting the RTK/Ras/PI3K or Rb pathway.
TP53 mutated GSCs are uniformly sensitive to dual mTORC1/2 inhibition but not uniformly sensitive to mTORC1 inhibition
In order to identify mutational biomarkers for the compounds used in this screen, we integrated the targeted exome sequencing data with the drug sensitivity data. To this end, we compared the GI50 values between the mutated and wild type samples for every gene containing a genetic aberration. We identified point mutations that were significantly correlated with GI50 values (unadjusted p<0.05, Wilcoxon rank-sum test) for 8 out of 10 compounds (Table 1). However, we identified CNVs (PRKY and TBL1Y amplifications) that were significantly correlated with GI50 values (unadjusted p<0.05, Wilcoxon rank-sum test) for only one compound (PRIMA-1MET) (Supplementary Table S3).
Table 1: Significant associations between mutated genes and drug response
Pathway |
Compound |
Target |
Mutation |
P (<0.05) |
FDR |
|---|---|---|---|---|---|
RTK/Ras/PI3K |
Lapatinib |
EGFR, ERBB2 |
FBXW11 |
0.043 |
0.55 |
AZD2014 |
mTORC1, mTORC2 |
TP53 |
0.001 |
0.03 |
|
TRRAP |
0.002 |
0.03 |
|||
IGF2R |
0.010 |
0.10 |
|||
MLL5 |
0.011 |
0.10 |
|||
FBXW11 |
0.036 |
0.26 |
|||
GDC-0068 |
AKT1, AKT2, AKT3 |
TRRAP |
0.006 |
0.22 |
|
IGF2R |
0.020 |
0.36 |
|||
BKM120 |
Class I PI3K isoforms |
FBXW11 |
0.006 |
0.11 |
|
(p110α, β, γ and δ) |
MLL5 |
0.008 |
0.11 |
||
TP53BP1 |
0.014 |
0.11 |
|||
RNF213 |
0.015 |
0.11 |
|||
SPEG |
0.015 |
0.11 |
|||
TP53 |
0.043 |
0.26 |
|||
Crizotinib |
MET, ALK |
- |
- |
- |
|
p53 |
Nutlin3 |
MDM2 |
MTOR |
0.010 |
0.13 |
PIKFYVE |
0.014 |
0.13 |
|||
TYRO3 |
0.014 |
0.13 |
|||
FBXW11 |
0.020 |
0.13 |
|||
USP24 |
0.020 |
0.13 |
|||
TP53 |
0.021 |
0.13 |
|||
EGFR |
0.041 |
0.21 |
|||
PRIMA-1MET |
Mutant p53 |
RNF213 |
0.004 |
0.15 |
|
reactivation |
LAMA4 |
0.027 |
0.49 |
||
Alisertib |
AURKA |
- |
- |
- |
|
Rb |
Palbociclib |
CDK4, CDK6 |
HDAC9 |
0.017 |
0.36 |
TRPM6 |
0.036 |
0.36 |
|||
PIK3R1 |
0.040 |
0.36 |
|||
SNS-032 |
CDK2, CDK7, CDK9 |
- |
- |
- |
The compounds are grouped according to the pathway they interact with. The genes indicate that GSCs with and without the specific gene mutations vary significantly in GI50 value in response to the specific drug (unadjusted p<0.05, Wilcoxon rank-sum test). FDR, false discovery rate.
We found that TP53 and TRRAP mutations were significantly associated with dual mTORC1/2 inhibition (FDR=0.026 and FDR=0.031, respectively, Wilcoxon rank-sum test) (Supplementary Figure S2). Sanger sequencing was used to validate the presence of the TP53 mutations in the accompanying GSCs. Of the 6 TP53 mutations identified by next-generation sequencing, all mutations were validated (6/6). GSCs with a TP53 mutation (TP53mut) were more sensitive to the dual mTORC1/2 inhibitor AZD2014 than TP53 wild type (TP53wt) GSCs (GI50average =0.13 vs 0.45 μM, p=0.010, Wilcoxon rank-sum test). In contrast to the homogeneous response of the TP53mut cultures (GI50SD=0.041 μM), TP53wt cultures showed a more heterogeneous response (GI50SD=0.29 μM) (Figure 2A).
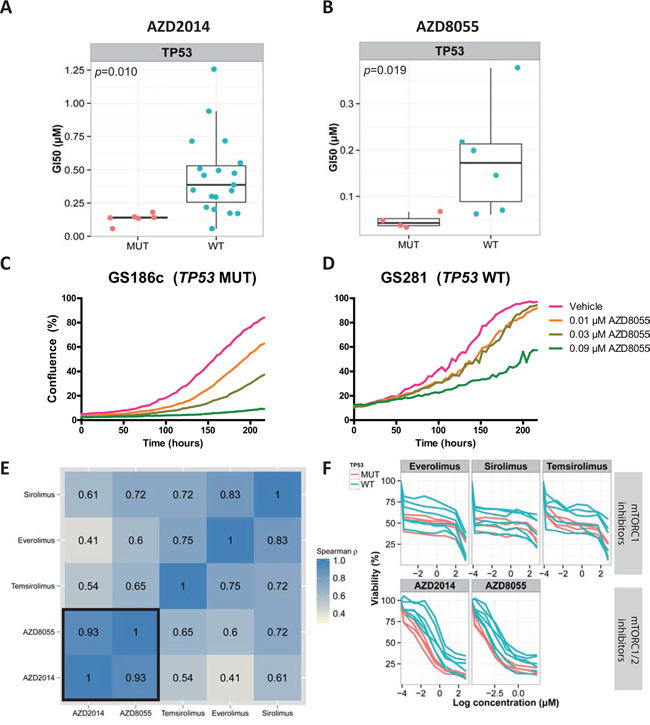
Figure 2: TP53mut GSCs are uniformly sensitive to dual mTORC1/2 inhibition and not to mTORC1 inhibition. A, B. Boxplot and dotplot in which each dot, stratified by their TP53 mutation status, represents the GI50 values (μM) of AZD2014 or AZD8055 (dual mTORC1/2 inhibitors) for GSCs. C, D. Live-image monitoring of proliferation in response to increasing concentrations of AZD8055. E. Spearman correlation of the GI50 values (μM) of different mTORC1 and dual mTORC1/2 inhibitors for 10 GSCs. F. Dose-response curves of the same 10 GSCs. The colors indicate the TP53 mutation status. Pink, TP53mut; blue, TP53wt; MUT, mutated; WT, wild type.
Next, we tested whether TP53mut GSCs are also sensitive to the AZD2014 drug analogue, AZD8055. GI50 values of AZD2014 and AZD8055 were determined for 10 randomly selected GSCs after 5 days of drug exposure, and the results were highly correlated (ρ=0.93, spearman correlation) (Figure 2E). Similar to AZD2014 (GI50average =0.22 versus 0.81 μM, p=0.010, Wilcoxon rank-sum test), TP53mut GSCs were more sensitive to AZD8055 than TP53wt GSCs (GI50average =0.046 versus 0.18 μM, p=0.019, Wilcoxon rank-sum test) (Figure 2B). Live-cell imaging in response to 0.03 μM AZD8055 at t=200 hours confirmed that the TP53mut GSC was inhibited more than the TP53wt GSC (46% vs 7% inhibition) (Figure 2C, 2D).
To investigate whether TP53mut GSCs were uniformly sensitive to classic rapamycin analogues (mTORC1 inhibitors), we tested the previous set of 10 GSCs for their response to sirolimus, temsirolimus and everolimus (Figure 2E). Although there was a moderate correlation between the GI50 values of mTORC1 inhibitors and dual mTORC1/2 inhibitors (ρ = 0.41-0.72, spearman correlation) (Figure 2E), there was no significant difference between TP53mut and TP53wt type GSCs in response to mTORC1 inhibitors (sirolimus, p=0.32; temsirolimus, p=0.26; everolimus, p=0.67, Wilcoxon rank-sum test). While there was an initial response to the rapamycin analogues at low doses, a steady state was reached at approximately 50% cell viability (Figure 2F). For AZD2014 and AZD8055 however, a stronger initial response was observed, and the steady state was reached at around 25% cell viability (Figure 2F).
Phosphoproteome profiling identifies a Bcl-2 inhibitor as a drug combination partner for AZD8055
The phosphoproteome is an important mediator of drug resistance. We investigated the phosphorylation pattern of 180 disease-relevant phosphosites using reverse phase protein arrays (RPPA) to identify possible therapeutic targets that might counter the resistance observed in TP53wt GSCs. A resistant TP53wt GSC (GS281) and 2 sensitive TP53mut GSCs (GS149 and GS186c) were exposed to 0.5 μM AZD8055 or 0.5 μM vehicle (DMSO) for 3 hours (Figure 3A). Ribosomal protein S6(Ser235-236) and Akt(Ser473) phosphorylation (used as a measure of mTORC1 and mTORC2 activity, respectively [12]) decreased in the AZD8055-treated GSCs compared to vehicle-treated GSCs (data not shown), strongly indicating the on-target inhibitory effect of AZD8055 on mTORC1 and mTORC2.
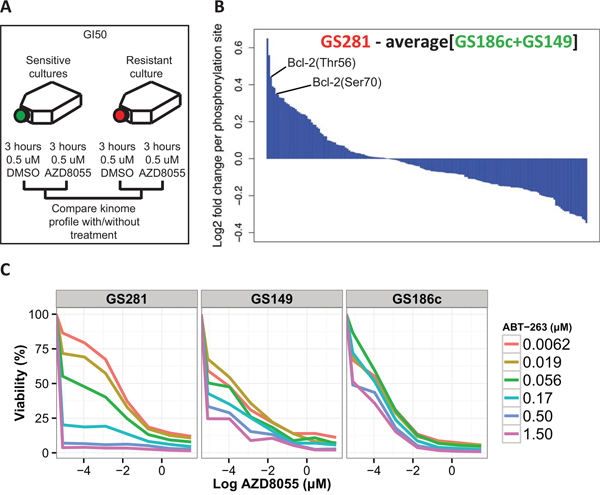
Figure 3: Kinome profiling identifies potential phosphosites implicated in resistance to AZD8055. A. Schematic depiction of the approach for dynamic kinome profiling. B. Waterfall plot of the 180 phosphosites. The values above and below 0 indicate respectively hyper- and hypophosphorylated phosphosites in the resistant TP53wt (red) GSC relative to the sensitive TP53mut (green) GSCs after exposure to AZD8055. C. Increasing doses of ABT-263 and AZD8055 were tested in the AZD8055-resistant TP53wt GSC (GS281) and two AZD8055-sensitive TP53mut GSCs (GS149 and GS186c).
We compared the RPPA profiles of sensitive TP53mut GSCs (GS149 and GS186c) to the resistant TP53wt GSC (GS281). We identified phosphosites that were specifically hyperphosphorylated in the AZD8055-resistant GSC relative to both AZD8055-senstive GSCs (Figure 3B). NDRG1(Thr346), Akt (Ser473), AMPKb1(Ser108), 4E-BP1(Thr70/Thr37.46), Bcl-2 (Thr56/Ser70), HSP27(Ser82), Cofilin(Ser3) were among the top hyperphosphorylated phosphosites in the AZD8055-resistant GSC relative to the AZD8055-sensitive GSCs.
Bcl-2 is a well known pro-survival protein broadly implicated in therapy resistance [13]. We combined the potent Bcl-2 inhibitor, ABT-263 [14], with AZD8055 to test for the reversal of resistance to AZD8055. Indeed, the addition of ABT-263 inhibited the proliferation of AZD8055-resistant GSC (GS281) more potently over a range of doses compared to AZD8055-sensitive GSCs (GS149 and GS186c) (Figure 3C).
DISCUSSION
Targeted therapy has not been proven effective yet for the treatment of glioblastoma [3, 4]. An underlying reason for this failure may be due to the large intertumor heterogeneity of glioblastomas, as observed in sequencing studies [6, 7], rendering only a subset of tumors sensitive to a particular drug. It is therefore necessary to stratify patients or treatments guided by relevant predictive biomarkers [5]. Additionally, intratumor heterogeneity likely plays a major role in resistance to therapy [15]. Recent reports indicate that mutations can occur heterogeneously within a single glioblastoma [16, 17], and different tumor subclones can exhibit varying drug sensitivities [18, 19].
In this study, we focused on intertumor heterogeneity by identifying biomarkers of response using a panel of 25 GSCs derived from different patients. GSCs are known to better preserve the gene expression profile [8], CNVs [8-10] and point mutations [9] of the parental tumor tissue than established cell lines. Furthermore GSCs are more suitable for high-throughput drug screening compared to neurosphere cultures.
Targeted exome sequencing integrated with our compound screen identified that TP53mut GSCs were uniformly sensitive to dual mTORC1/2 inhibition, but not mTORC1 inhibition alone; TP53wt GSCs were more heterogeneous in response to dual mTORC1/2 inhibition.
To the best of our knowledge, this is the first report identifying TP53 mutations as a biomarker for response to dual mTORC1/2 inhibition in glioblastoma. In other cancers, mTORC1 inhibition by rapamycin has previously been linked to selectively induce apoptosis in TP53mut rhabdomyosarcoma cell cultures [20, 21]. After rapamycin exposure, wild type p53 induces p21cip expression, which leads to a G1 phase cell cycle arrest [20, 22]. In contrast, TP53mut or deficient cells undergo cell cycle progression and subsequent apoptosis [20, 22]. In this study however, we could not find any significant difference in sensitivity to mTORC1 inhibition between TP53mut and TP53wt GSCs. mTORC2 is increasingly recognized as an important mediator of gliomagenesis [23] and chemoresistance [24]. Future work is required to investigate whether TP53mut cells cannot survive without mTORC2 activity, and whether mTORC2 specific inhibition would selectively kill TP53mut cells. The future development of mTORC2 specific inhibitors is important, since they may have a large therapeutic window as mTORC2 appears to be redundant in normal tissue [25].
We sought to understand the difference in response between TP53mut AZD8055-sensitive and TP53wt AZD8055-resistant GSCs. Through comparison of their RPPA profiles, we identified Bcl-2 as being implicated in resistance to AZD8055. These findings were supported by the observation that the TP53wt AZD8055-resistant GSC was more sensitive to combined exposure of AZD8055 and ABT-263 than TP53mut GSCs. Although this combination therapy was effective in TP53wt GSCs, it is still unclear whether this is also the case in vivo. There are multiple studies showing that mTORC1/2 inhibitors can cross the blood-brain barrier (BBB) and interfere with glioblastoma growth in preclinical orthotopic in vivo models [26, 27], whereas it is still unknown whether ABT-263 can efficiently penetrate the BBB. Interestingly, in concordance with our findings, another study also found this combination to be synergistic in a subset of GSCs [28]. Collectively, our findings suggest that RPPA can be systematically used to identify phosphoproteins involved in resistance to therapy.
The clinical relevance of dual mTORC1/2 inhibition by AZD8055 or AZD2014 is yet to be fully elucidated. In a recent study, AZD8055 was shown to synergize with temozolomide, leading to a 30% prolonged survival of orthotopic glioma xenografts compared to treatment with either drug alone [26]. TP53 is mutated or deleted in around 30% of glioblastomas [7]; for these patients, TP53 mutations may be used as a biomarker to stratify patients for dual mTORC1/2 inhibitor treatment, thus enhancing the effect of combination therapy employing AZD2014 or AZD8055 with temozolomide.
In conclusion, our data suggest that TP53 mutations are a predictive biomarker of response to dual mTORC1/2 inhibitors, rendering it worthwhile to further explore dual mTORC1/2 inhibitors in TP53mut glioblastomas. Furthermore, TP53wt GSCs are resistant against mTORC1/2 inhibitors via Bcl-2; combined blockade of mTORC1/2 and Bcl-2 is worth exploring further in TP53wt glioblastomas, or in TP53mut tumors to prevent the outgrowth of resistant subclones during mTORC1/2 inhibition.
MATERIALS AND METHODS
Patient-derived glioblastoma cultures
Resected human glioblastoma tumor material was obtained at the departments of neurosurgery of the Erasmus Medical Center (Rotterdam, The Netherlands) and Elisabeth Hospital (Tilburg, The Netherlands). Tumor material, that was safely accessible, was resected and used for research with the patient’s written consent and in accordance with protocols approved by the institutional review board of the Erasmus Medical Center. A portion of the tumor tissue specimens was dissociated and maintained as adherent GSCs under serum-free culture conditions as was described previously [10]. The adjacent portion of the tumor tissue was snap-frozen and used for next-generation sequencing. 25 GSCs were used for the experiments.
Next generation sequencing
We performed targeted exome sequencing of a “cancer mini-genome” consisting of 1971 cancer-related genes based on [29]. DNA was extracted using NorDiag Arrow (Isogen Life Science, De Meern, the Netherlands) and quantified with a Qubit 2.0 fluorometer (Life Technologies, Carlsbad, USA). Barcoded fragment libraries were generated from 600 ng of isolated DNA from tumor samples as previously described [30]. Pools of libraries were enriched for the cancer mini-genome using SureSelect technology. The enriched libraries were sequenced on a SOLiD 5500xl (Applied Biosystems, Foster City, USA) instrument according to the manufacturers’ protocol. Afterwards, the sequenced data were mapped to the reference genome (GRCh37/hg19) using Burrows-Wheeler Aligner [31]. Variant calling was performed using a custom pipeline as previously described [32]. Copy number status of a selected set of genes from the targeted sequencing data was estimated using modified Z-scores as described previously [33]. Copy number data from GS186p, GS289 and GS454 were excluded due to suboptimal quality.
Small molecule compounds
The following small molecule compounds targeting the RTK/Ras/PI3K pathway were diluted in DMSO (Sigma-Aldrich, St. Louis, USA): lapatinib ditosylate was obtained from Santa Cruz Biotechnology (Dallas, USA) (catalog number 202205A). Crizotinib (S1068), NVP-BKM120 (S2247), GDC-0068 (S2808), AZD2014 (S2783), AZD8055 (S1555) and GSK2636771 (S8002) were obtained from Selleck Chemicals (Houston, USA).
The following small molecule compounds targeting the Rb pathway were diluted in DMSO: SNS-032 (S1145) was obtained from Selleck Chemicals. Palbociclib isethionate (PD-0332991) (S1579) was diluted in milliQ water and was obtained from Selleck Chemicals.
The following small molecule compounds targeting the p53 pathway were diluted in DMSO: Nutlin3 (S1061) and Alisertib (MLN8237) (S1133) were obtained from Selleck Chemicals. PRIMA-1MET (SC-361295) was obtained from Santa Cruz Biotechnology.
The following small molecule compound was identified as a potential combination partner of AZD8055 and was diluted in DMSO: ABT-263 (11500) was obtained from Cayman Chemical (Ann Arbor, USA).
Viability assay
All viability assays were performed with GSCs below passage 20 using the CellTiter-Glo assay (Promega, WI, USA). Dose–response assays were performed in three step dilutions at six different concentrations in order to determine the growth inhibitory concentration required to inhibit 50% of cell proliferation (GI50). The 96-well plates were coated with matrigel (1:20, Trevigen, MD, USA) and seeded at 0.8-1.0x10³ cells/well and were left to adhere for 24 hours. After 24 hours the compounds were added to the wells. Cell viability was measured on day five or eight after treatment by using the luminescent CellTiter-Glo assay (Promega, WI, USA) according to the manufacturer’s protocol. Luminescence was measured with a Tecan Infinite Reader (Tecan Group Ltd., Männedorf, Switzerland). The GI50 values were calculated by median effect equation [34].
Live-cell imaging
The cells were seeded at 1.0x10⁴ cells/well in a matrigel coated (1:20) 24-well plate and were left to adhere for 24 hours. Hereafter DMSO (control) and AZD8055 were added at the indicated concentrations in duplicate. The 24-well plates were placed in an IncuCyte (Essen BioScience, MI, USA) at 37°C in a humid 95% air/5% CO2 chamber. Three phase contrast images/well were collected with a 10× objective every 4 hours for up to 9 days after addition of AZD8055. The percentage of the area of the well occupied by cells (confluence) was calculated using software of the IncuCyte live-cell imaging system (Essen BioScience).
Reverse phase protein array (RPPA)
One AZD8055-resistant TP53wt GSC (GS281) and 2 AZD8055-sensitive TP53mut GSCs (GS149 and GS186c) were analyzed by RPPA. First, the GSCs were cultured until 80% confluence in matrigel coated (1:20, Trivigen) T175 flasks. Afterwards the cells were trypsinized and transferred to non-coated T175 flasks where they were cultured for 24 hours as neurospheres. Then, cells were exposed to 0.5 μM AZD8055 for 3 hours. Hereafter cell pellets were prepared following Carna Biosciences’ protocol and stored at -80°C. The cell pellet was thawed on ice and cell lysates were prepared in 50 μl lysis buffer following Carna Biosciences’ protocol. The protein concentrations were measured using the Bradford protein assay and were provided to Carna Biosciences together with the cell lysates. The lysates were further processed and analyzed by Carna Biosciences (Kobe, Japan) according to their protocol. In short, the lysates were spotted onto glass slides and immunostaining was performed with 180 antibodies (one antibody per slide). The signals were then measured as fluorescence of the fluorophore-labeled secondary antibodies and normalized with the values for gamma-tubulin (loading control). The raw data and calculated relative concentrations were reported back. For each GSC the AZD8055-treated condition was divided by the DMSO-treated values. As a result, the fold change between the AZD8055-treated and DMSO-treated conditions was derived for each phosphosite of the 3 GSCs. The fold change of the AZD8055-resistant TP53wt GSC (GS281) were divided by the averaged fold change of the 2 AZD8055-sensitive TP53mut GSCs (GS149 and GS186c). This enabled the identification of phosphosites that were hyperphosphorylated in the AZD8055-resistant GSC (GS281) compared to the 2 AZD8055-sensitive GSCs (GS149 and GS186c).
Analysis of mutations in relation to drug sensitivity
The growth inhibitory concentration required to inhibit 50% of cell proliferation compared to non-treated control cells (GI50) was correlated to the presence or absence of mutated genes. Wilcoxon rank-sum tests were performed to statistically compare the GI50 values of mutated and wild type cultures for each aberrant gene (mutated, amplified or deleted) recurring three or more times among the patient-derived glioblastoma cultures. The false discovery rate was used to correct for multiple testing.
ACKNOWLEDGMENTS
We thank the Center for Personalized Cancer Treatment (CPCT) for performing the next generation sequencing and their technical assistance. We are also grateful to Zineb Belcaid, Joanne Laycock and Gerald Goh for thoughtful discussions of this work.
CONFLICTS OF INTEREST
The authors declare no competing financial interests.
FUNDING
This work was supported by the Foundation STOPBraintumors.org, Netherlands (M.L.M.L., S.S., S.L.).
REFERENCES
1. Ohgaki H, Kleihues P. Population-based studies on incidence, survival rates, and genetic alterations in astrocytic and oligodendroglial gliomas. J Neuropathol Exp Neurol. 2005; 64:479-489.
2. Stupp R, Mason WP, van den Bent MJ, Weller M, Fisher B, Taphoorn MJ, Belanger K, Brandes AA, Marosi C, Bogdahn U, Curschmann J, Janzer RC, Ludwin SK, Gorlia T, Allgeier A, Lacombe D, et al. Radiotherapy plus concomitant and adjuvant temozolomide for glioblastoma. N Engl J Med. 2005; 352:987-996.
3. De Witt Hamer PC. Small molecule kinase inhibitors in glioblastoma: a systematic review of clinical studies. Neuro Oncol. 2010; 12:304-316.
4. Prados MD, Byron SA, Tran NL, Phillips JJ, Molinaro AM, Ligon KL, Wen PY, Kuhn JG, Mellinghoff IK, de Groot JF, Colman H, Cloughesy TF, Chang SM, Ryken TC, Tembe WD, Kiefer JA, et al. Toward precision medicine in glioblastoma: the promise and the challenges. Neuro Oncol. 2015; 17:1051-1063.
5. Sleijfer S, Bogaerts J, Siu LL. Designing transformative clinical trials in the cancer genome era. J Clin Oncol. 2013; 31:1834-1841.
6. TCGA. Comprehensive genomic characterization defines human glioblastoma genes and core pathways. Nature. 2008; 455:1061-1068.
7. Brennan CW, Verhaak RG, McKenna A, Campos B, Noushmehr H, Salama SR, Zheng S, Chakravarty D, Sanborn JZ, Berman SH, Beroukhim R, Bernard B, Wu CJ, Genovese G, Shmulevich I, Barnholtz-Sloan J, et al. The somatic genomic landscape of glioblastoma. Cell. 2013; 155:462-477.
8. Lee J, Kotliarova S, Kotliarov Y, Li A, Su Q, Donin NM, Pastorino S, Purow BW, Christopher N, Zhang W, Park JK, Fine HA. Tumor stem cells derived from glioblastomas cultured in bFGF and EGF more closely mirror the phenotype and genotype of primary tumors than do serum-cultured cell lines. Cancer Cell. 2006; 9:391-403.
9. Yost SE, Pastorino S, Rozenzhak S, Smith EN, Chao YS, Jiang P, Kesari S, Frazer KA, Harismendy O. High-resolution mutational profiling suggests the genetic validity of glioblastoma patient-derived pre-clinical models. PLoS One. 2013; 8:e56185.
10. Balvers RK, Kleijn A, Kloezeman JJ, French PJ, Kremer A, van den Bent MJ, Dirven CM, Leenstra S, Lamfers ML. Serum-free culture success of glial tumors is related to specific molecular profiles and expression of extracellular matrix-associated gene modules. Neuro Oncol. 2013; 15:1684-1695.
11. Lawrence MS, Stojanov P, Polak P, Kryukov GV, Cibulskis K, Sivachenko A, Carter SL, Stewart C, Mermel CH, Roberts SA, Kiezun A, Hammerman PS, McKenna A, Drier Y, Zou L, Ramos AH, et al. Mutational heterogeneity in cancer and the search for new cancer-associated genes. Nature. 2013; 499:214-218.
12. Guertin DA, Sabatini DM. Defining the role of mTOR in cancer. Cancer Cell. 2007; 12:9-22.
13. Youle RJ, Strasser A. The BCL-2 protein family: opposing activities that mediate cell death. Nature reviews Molecular cell biology. 2008; 9:47-59.
14. Tse C, Shoemaker AR, Adickes J, Anderson MG, Chen J, Jin S, Johnson EF, Marsh KC, Mitten MJ, Nimmer P. ABT-263: a potent and orally bioavailable Bcl-2 family inhibitor. Cancer research. 2008; 68:3421-3428.
15. McGranahan N, Swanton C. Biological and therapeutic impact of intratumor heterogeneity in cancer evolution. Cancer Cell. 2015; 27:15-26.
16. Sottoriva A, Spiteri I, Piccirillo SG, Touloumis A, Collins VP, Marioni JC, Curtis C, Watts C, Tavare S. Intratumor heterogeneity in human glioblastoma reflects cancer evolutionary dynamics. Proc Natl Acad Sci U S A. 2013.
17. Johnson BE, Mazor T, Hong C, Barnes M, Aihara K, McLean CY, Fouse SD, Yamamoto S, Ueda H, Tatsuno K, Asthana S, Jalbert LE, Nelson SJ, Bollen AW, Gustafson WC, Charron E, et al. Mutational analysis reveals the origin and therapy-driven evolution of recurrent glioma. Science. 2014; 343:189-193.
18. Meyer M, Reimand J, Lan X, Head R, Zhu X, Kushida M, Bayani J, Pressey JC, Lionel AC, Clarke ID, Cusimano M, Squire JA, Scherer SW, Bernstein M, Woodin MA, Bader GD, et al. Single cell-derived clonal analysis of human glioblastoma links functional and genomic heterogeneity. Proc Natl Acad Sci U S A. 2015; 112:851-856.
19. Soeda A, Hara A, Kunisada T, Yoshimura S, Iwama T, Park DM. The evidence of glioblastoma heterogeneity. Sci Rep. 2015; 5:7979.
20. Huang S, Liu LN, Hosoi H, Dilling MB, Shikata T, Houghton PJ. p53/p21(CIP1) cooperate in enforcing rapamycin-induced G(1) arrest and determine the cellular response to rapamycin. Cancer Res. 2001; 61:3373-3381.
21. Hosoi H, Dilling MB, Shikata T, Liu LN, Shu L, Ashmun RA, Germain GS, Abraham RT, Houghton PJ. Rapamycin causes poorly reversible inhibition of mTOR and induces p53-independent apoptosis in human rhabdomyosarcoma cells. Cancer Res. 1999; 59:886-894.
22. Huang S, Shu L, Dilling MB, Easton J, Harwood FC, Ichijo H, Houghton PJ. Sustained activation of the JNK cascade and rapamycin-induced apoptosis are suppressed by p53/p21(Cip1). Mol Cell. 2003; 11:1491-1501.
23. Read RD, Cavenee WK, Furnari FB, Thomas JB. A drosophila model for EGFR-Ras and PI3K-dependent human glioma. PLoS Genet. 2009; 5:e1000374.
24. Tanaka K, Babic I, Nathanson D, Akhavan D, Guo D, Gini B, Dang J, Zhu S, Yang H, De Jesus J, Amzajerdi AN, Zhang Y, Dibble CC, Dan H, Rinkenbaugh A, Yong WH, et al. Oncogenic EGFR signaling activates an mTORC2-NF-kappaB pathway that promotes chemotherapy resistance. Cancer Discov. 2011; 1:524-538.
25. Sparks CA, Guertin DA. Targeting mTOR: prospects for mTOR complex 2 inhibitors in cancer therapy. Oncogene. 2010; 29:3733-3744.
26. Luchman HA, Stechishin OD, Nguyen SA, Lun XQ, Cairncross JG, Weiss S. Dual mTORC1/2 Blockade Inhibits Glioblastoma Brain Tumor Initiating Cells In Vitro and In Vivo and Synergizes with Temozolomide to Increase Orthotopic Xenograft Survival. Clin Cancer Res. 2014; 20:5756-5767.
27. Kahn J, Hayman TJ, Jamal M, Rath BH, Kramp T, Camphausen K, Tofilon PJ. The mTORC1/mTORC2 inhibitor AZD2014 enhances the radiosensitivity of glioblastoma stem-like cells. Neuro Oncol. 2014; 16:29-37.
28. Quartararo CE, Reznik E, deCarvalho AC, Mikkelsen T, Stockwell BR. High-Throughput Screening of Patient-Derived Cultures Reveals Potential for Precision Medicine in Glioblastoma. ACS Med Chem Lett. 2015; 6:948-952.
29. Vermaat JS, Nijman IJ, Koudijs MJ, Gerritse FL, Scherer SJ, Mokry M, Roessingh WM, Lansu N, de Bruijn E, van Hillegersberg R. Primary colorectal cancers and their subsequent hepatic metastases are genetically different: implications for selection of patients for targeted treatment. Clinical cancer research. 2012; 18:688-699.
30. Harakalova M, Mokry M, Hrdlickova B, Renkens I, Duran K, van Roekel H, Lansu N, van Roosmalen M, de Bruijn E, Nijman IJ, Kloosterman WP, Cuppen E. Multiplexed array-based and in-solution genomic enrichment for flexible and cost-effective targeted next-generation sequencing. Nat Protoc. 2011; 6:1870-1886.
31. Li H, Durbin R. Fast and accurate short read alignment with Burrows-Wheeler transform. Bioinformatics. 2009; 25:1754-1760.
32. Hoogstraat M, de Pagter MS, Cirkel GA, van Roosmalen MJ, Harkins TT, Duran K, Kreeftmeijer J, Renkens I, Witteveen PO, Lee CC, Nijman IJ, Guy T, van 't Slot R, Jonges TN, Lolkema MP, Koudijs MJ, et al. Genomic and transcriptomic plasticity in treatment-naive ovarian cancer. Genome Res. 2014; 24:200-211.
33. Hoogstraat M, Hinrichs JW, Besselink NJ, Radersma-van Loon JH, de Voijs CM, Peeters T, Nijman IJ, de Weger RA, Voest EE, Willems SM, Cuppen E, Koudijs MJ. Simultaneous detection of clinically relevant mutations and amplifications for routine cancer pathology. J Mol Diagn. 2015; 17:10-18.
34. Chou TC, Talalay P. Quantitative analysis of dose-effect relationships: the combined effects of multiple drugs or enzyme inhibitors. Adv Enzyme Regul. 1984; 22:27-55.