
INTRODUCTION
Inflammatory bowel disease (IBD) is a chronic inflammatory disease of the intestinal tract that causes relapse and remission, and is usually classified into two clinical syndromes: ulcerative colitis (UC) and Crohn’s disease (CD) [1]. Although the etiology of IBD is unclear, twin and familial aggregation studies have demonstrated roles for genetic factors. Genetic epidemiology studies have indicated that UC and CD are polygenic disorders, and that genetic susceptibility factors play an important role in the pathogenesis of these two diseases [2]. Previous studies identified several IBD susceptibility genes, including nucleotide oligomerization domain 2 (NOD2), interleukin-10 (IL-10), IL-23, and ATG16L1 [3, 4]. Genome-wide association studies (GWAS) have implicated that genes were involved in both UC and CD, indicating a partly shared pathogenesis [5, 6].
Myosin IXB (MYO9B) encodes a single-headed processive myosin that is a member of the class IX myosin family [7]. MY09B is expressed in various tissues and cell types, including human intestinal epithelial cells [8]. Studies using a rat model shown that overexpression of MYO9B results in actin filament-related morphologic changes in epithelial cells [9]. A previous Dutch study first suggested MYO9B as a susceptibility gene for celiac disease [10]. MYO9B lies on chromosome 19p13.1, which has been linked to both celiac disease [11] and IBD [12]. Autoimmune-related disorders may possess some common genetic susceptibility factors [13]. Furthermore, MYO9B has been shown to be associated with IBD [12]. Therefore, MYO9B may be a candidate susceptibility gene for IBD.
Recently, numerous studies investigated associations between MYO9B gene polymorphisms and IBD susceptibility, but with discordant results [14-21]. The clinical heterogeneity, different ethnic populations and small sample sizes of previous studies may have contributed to these disparities. To overcome these limitations and resolve inconsistencies, we performed a meta-analysis of the contradictory results from these relevant studies to clarify the associations between MY09B gene polymorphisms and risk of IBD, CD and UC.
RESULTS
Characteristics of the included studies
A total of 47 papers were identified after our initial search. After removing duplicates and screening the titles and abstracts, 37 papers were removed. Therefore, 10 papers were selected for further full text review; two papers [22, 23] were excluded, because they did not investigate the associations between MY09B gene polymorphisms and IBD, CD or UC. We finally identified eight eligible papers [14-21] including ten studies (8,975 cases and 9,482 controls) in this meta-analysis. Selection for included studies was presented in Figure 1. The characteristics of these included studies are summarized in Table 1. These studies were published from 2006 to 2014. The number for each genotype about five SNPs of MY09B was showed Supplementary Table 1. Five SNPs within MY09B gene were investigated, including rs1545620, rs962917, rs1457092, rs2305764 and rs2305767. Genotype distributions of the controls about rs1545620 in one study [17] did not conform to HWE [17] (P = 0.002). The NOS scores of all included studies ranged from 5 to 7 stars, which suggested they were studies of high methodological quality. Six papers were carried out in Caucasian populations [14-16, 18, 20, 21], and two in Asian populations [17, 19].
Table 1: Characteristics of included studies.
Author and year |
Country |
Ethnicity |
Numbers |
Polymorphisms |
HWE values |
Genotype methods |
NOS score |
||
UC |
CD |
Controls |
|||||||
Hu_2014 |
China |
Asian |
235 |
207 |
402 |
rs962917,rs1545620 |
0.252, 0.002 |
PCR |
7 |
Shi_2011 |
China |
Asian |
245 |
NA |
300 |
rs1545620 |
0.310 |
PCR |
6 |
Wolters_2011 |
Canada |
Caucasian |
603 |
754 |
924 |
rs962917,rs1457092,rs1545620,rs2305764,rs2305767 |
0.971, 0.971, 0.992, 0.992, 0.995 |
TaqMan |
6 |
Cooney_2009 |
UK |
Caucasian |
650 |
652 |
1190 |
rs1457092,rs1545620,rs2305764,rs2305767 |
0.988, 0.977, 0.987, 0.993 |
MALDI-TOF |
6 |
Latiano_2008 |
Italy |
Caucasian |
658 |
549 |
674 |
rs962917,rs1545620, rs2305764 |
0.101, 0.114, 0.107 |
PCR |
5 |
Nunez_2007 |
Spain |
Caucasian |
677 |
627 |
990 |
rs1457092,rs2305764, rs2305767 |
0.584, 0.772, 0.051 |
NA |
7 |
van Bodegraven_2006 |
Dutch |
Caucasian |
290 |
298 |
1624 |
rs1457092,rs1545620,rs2305764,rs2305767 |
0.992, 0.992, 0.995, 0.991 |
TaqMan |
6 |
van Bodegraven_2006 |
UK |
Caucasian |
580 |
735 |
2371 |
rs1457092,rs1545620,rs2305764,rs2305767 |
0.994, 0.997, 0.986, 0.980 |
TaqMan |
6 |
van Bodegraven_2006 |
Canada/Italy |
Caucasian |
650 |
164 |
445 |
rs1457092,rs1545620,rs2305764,rs2305767 |
0.969, 0.960,0.994, 1.000 |
TaqMan |
6 |
Amundsen_2006 |
Norway |
Caucasian |
308 |
149 |
562 |
rs1457092,rs2305764, rs2305767 |
0.974, 0.972, 0.960 |
NA |
6 |
Abbreviations: CD, Crohn’s disease; UC, ulcerative disease; NA, not available; NOS, Newcastle–Ottawa scale.
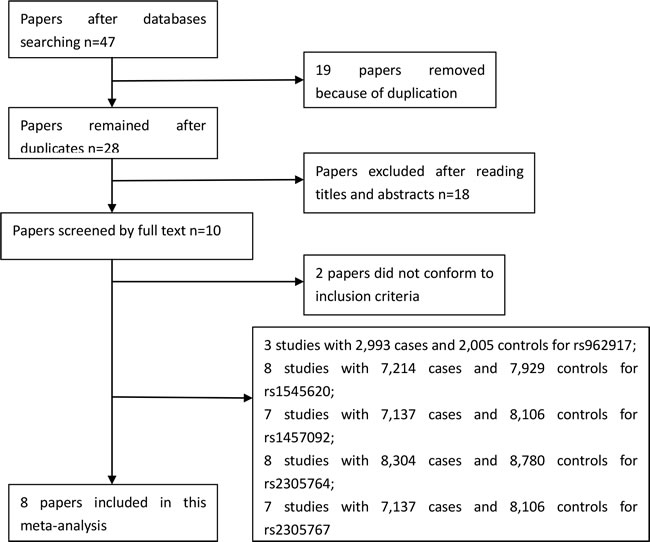
Figure 1: Selection for eligible studies included in this meta-analysis.
Meta-analysis of rs1545620
Six papers [15-19, 21] including eight studies with 7,214 cases and 7,929 controls examined rs1545620 polymorphism. As shown in Table 2, rs1545620 polymorphism was associated with a decreased risk of IBD in recessive model (CC vs. AA+AC: OR, 0.62; 95% CI, 0.45-0.84, P = 0.002, Figure 2); however, our study did not find rs1545620 was associated with UC or CD risk. Stratification analyses were conducted according to ethnicity. The results indicated that rs1545620 polymorphism was also significantly associated with a decreased risk of IBD among Caucasian populations in recessive model (CC vs. AA+AC: OR, 0.48; 95% CI, 0.38-0.62, P < 0.001). We did not find rs1545620 was related with UC or CD risk in Caucasian or Asian populations. By exclusion of one Chinese study that did not conform to HWE [17], the pooled estimates of the remaining studies also showed that rs1545620 polymorphism might decrease the risk of IBD (CC vs. AA+AC: OR, 0.53; 95% CI, 0.41-0.69, P < 0.001) (Table 3), suggesting that the results of this SNP was stable. The power analysis showed that our study has a power of 99% to detect the effects of rs1545620 polymorphism on IBD susceptibility, assuming an OR of 0.62. The false positive report probability (FPRP) of four genetic models were less than 0.5, indicating our data about this polymorphism was trustworthy.
Table 2: Meta-analysis of associations between the rs1545620 polymorphism and IBD, UC, CD.
Disease |
Comparison |
Populations |
Studies |
OR (95% CI) |
P-value |
P for heterogeneity |
Model |
I2 (%) |
PBegger/PEgger for Publication bias |
IBD |
C vs. A |
Overall |
8 |
0.95(0.86,1.06) |
0.391 |
<0.001 |
R |
78.4 |
0.322/0.568 |
Caucasian |
6 |
0.94(0.83,1.06) |
0.301 |
<0.001 |
R |
83.2 |
Na/Na |
||
Asian |
2 |
1.03 (0.81,1.32) |
0.793 |
0.167 |
F |
47.6 |
Na/Na |
||
CC vs. AA+AC |
Overall |
8 |
0.62(0.45,0.84) |
0.002 |
<0.001 |
R |
94.8 |
0.083/0.169 |
|
Caucasian |
6 |
0.48(0.38,0.62) |
<0.001 |
<0.001 |
R |
90.4 |
Na/Na |
||
Asian |
2 |
1.36(0.84,2.20) |
0.212 |
0.032 |
R |
78.1 |
Na/Na |
||
CC+AC vs. AA |
Overall |
8 |
0.91(0.78,1.08) |
0.287 |
0.001 |
R |
72.0 |
0.805/0.723 |
|
Caucasian |
6 |
0.91(0.78,1.05) |
0.199 |
0.007 |
R |
68.8 |
Na/Na |
||
Asian |
2 |
1.49(0.30,7.48) |
0.625 |
0.003 |
R |
88.9 |
Na/Na |
||
CC vs. AA |
Overall |
8 |
0.92(0.72,1.18) |
0.527 |
<0.001 |
R |
81.7 |
0.458/0.412 |
|
Caucasian |
6 |
0.88(0.68,1.14) |
0.348 |
<0.001 |
R |
83.5 |
Na/Na |
||
Asian |
2 |
1.51(0.33,6.90) |
0.596 |
0.005 |
R |
87.3 |
Na/Na |
||
CD |
C vs. A |
Overall |
7 |
0.95(0.85,1.06) |
0.335 |
0.006 |
R |
67.1 |
0.881/0.709 |
Caucasian |
6 |
0.94(0.84,1.07) |
0.362 |
0.003 |
R |
72.5 |
Na/Na |
||
Asian |
1 |
0.97(0.75,1.27) |
0.842 |
Na |
Na |
Na |
Na/Na |
||
CC vs. AA+AC |
Overall |
7 |
0.96(0.81,1.13) |
0.607 |
0.010 |
R |
64.3 |
0.652/0.373 |
|
Caucasian |
6 |
0.95(0.78,1.15) |
0.572 |
0.006 |
R |
69.4 |
Na/Na |
||
Asian |
1 |
1.04(0.74,1.46) |
0.807 |
Na |
Na |
Na |
Na/Na |
||
CC+AC vs. AA |
Overall |
7 |
0.91(0.83,1.01) |
0.069 |
0.145 |
F |
37.2 |
0.881/0.754 |
|
Caucasian |
6 |
0.91(0.79,1.05) |
0.217 |
0.096 |
R |
46.6 |
Na/Na |
||
Asian |
1 |
0.81(0.48,1.37) |
0.434 |
Na |
Na |
Na |
Na/Na |
||
CC vs. AA |
Overall |
7 |
0.89(0.71,1.13) |
0.346 |
0.004 |
R |
68.5 |
0.881/0.827 |
|
Caucasian |
6 |
0.90(0.70,1.17) |
0.425 |
0.002 |
R |
73.3 |
Na/Na |
||
Asian |
1 |
0.85(0.49,1.45) |
0.545 |
Na |
Na |
Na |
Na/Na |
||
UC |
C vs. A |
Overall |
8 |
0.91(0.81,1.02) |
0.108 |
0.001 |
R |
71.4 |
0.805/0.758 |
Caucasian |
6 |
0.92(0.80,1.06) |
0.237 |
<0.001 |
R |
79.2 |
Na/Na |
||
Asian |
2 |
0.87(0.72,1.05) |
0.141 |
0.749 |
F |
0.0 |
Na/Na |
||
CC vs. AA+AC |
Overall |
8 |
0.89(0.73,1.08) |
0.247 |
0.001 |
R |
73.0 |
0.216/0.642 |
|
Caucasian |
6 |
0.91(0.74,1.12) |
0.378 |
0.001 |
R |
74.8 |
Na/Na |
||
Asian |
2 |
0.58(0.16,2.08) |
0.405 |
0.013 |
R |
83.6 |
Na/Na |
||
CC+AC vs. AA |
Overall |
8 |
0.88(0.76,1.01) |
0.073 |
0.029 |
R |
55.2 |
0.621/0.253 |
|
Caucasian |
6 |
0.89(0.75,1.05) |
0.163 |
0.021 |
R |
62.3 |
Na/Na |
||
Asian |
2 |
0.80(0.53,1.19) |
0.270 |
0.161 |
F |
49.1 |
Na/Na |
||
CC vs. AA |
Overall |
8 |
0.79(0.60,1.03) |
0.078 |
<0.001 |
R |
76.7 |
0.621/0.340 |
|
Caucasian |
6 |
0.85(0.64,1.14) |
0.278 |
<0.001 |
R |
79.8 |
Na/Na |
||
Asian |
2 |
0.49(0.22,1.10) |
0.085 |
0.130 |
F |
56.3 |
Na/Na |
*Bold values are statistically significant (P < 0.05). Abbreviations: OR, odds ratio; 95% CI, 95% confidence interval; CD, Crohn’s disease; UC, ulcerative disease; IBD, inflammatory bowel disease; F, fixed effects model; R, random effects model; Na, not available.
Table 3: Meta-analysis of the association between the rs1545620 polymorphism and IBD, UC, CD susceptibility after excluding one study (Hu et al.).
Disease |
Comparison |
Model |
OR(95%CI) |
P |
I2 (%) |
P for heterogeneity |
IBD |
C vs. A |
R |
0.96(0.85,1.08) |
0.473 |
81.5 |
<0.001 |
CC vs. AA+AC |
R |
0.53(0.41,0.69) |
<0.001 |
91.5 |
<0.001 |
|
CC+AC vs. AA |
R |
0.94(0.79,1.12) |
0.470 |
74.2 |
0.001 |
|
CC vs. AA |
R |
0.95(0.72,1.25) |
0.720 |
84.1 |
<0.001 |
|
CD |
C vs. A |
R |
0.94(0.84,1.07) |
0.362 |
72.5 |
0.003 |
CC vs. AA+AC |
R |
0.95(0.78,1.15) |
0.572 |
69.4 |
0.006 |
|
CC+AC vs. AA |
R |
0.91(0.79,1.05) |
0.217 |
46.6 |
0.096 |
|
CC vs. AA |
R |
0.90(0.70,1.17) |
0.425 |
73.7 |
0.002 |
|
UC |
C vs. A |
R |
0.91(0.81,1.03) |
0.152 |
75.4 |
<0.001 |
CC vs. AA+AC |
R |
0.87(0.70,1.08) |
0.218 |
76.1 |
<0.001 |
|
CC+AC vs. AA |
R |
0.90(0.78,1.04) |
0.147 |
55.0 |
0.038 |
|
CC vs. AA |
R |
0.80(0.60,1.07) |
0.136 |
79.5 |
<0.001 |
*Bold values are statistically significant (P < 0.05). Abbreviations: OR, odds ratio; 95% CI, 95% confidence interval; CD, Crohn’s disease; UC, ulcerative disease; IBD, inflammatory bowel disease; F, fixed effects model; R, random effects model.
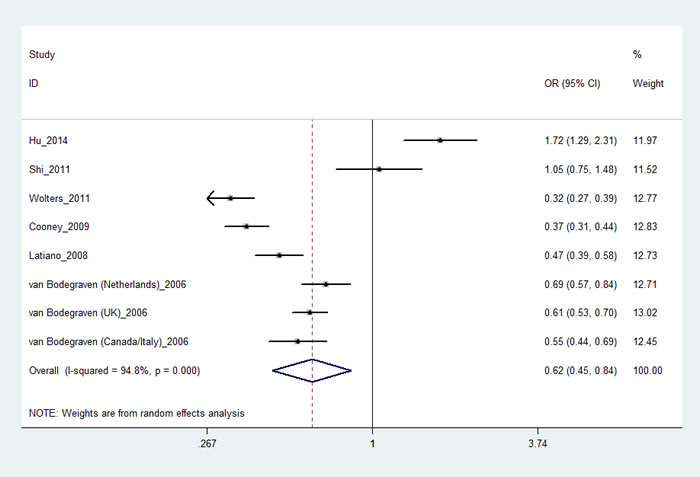
Figure 2: Forest plot shows odds ratio for associations between the rs1545620 polymorphism and IBD (CC vs. AA+AC).
Meta-analysis of rs962917
Three studies [16, 17, 21] with 2,993 cases and 2,005 controls investigated rs962917 polymorphism. As shown in Table 4, rs962917 polymorphism was associated with an increased risk of IBD. Stratification analyses of ethnicity also indicated that rs962917 polymorphism was significantly associated with the increased risk of IBD among Caucasian populations. We also found rs962917 was related with UC or CD risk (AA vs. GG+GA: OR, 1.24; 95% CI, 1.07-1.44, P = 0.005, Figure 3), especially among Caucasian populations, but not Asian populations. We did not perform sensitivity analyses, because only three studies investigated rs962917 polymorphism. Due to limited studies, we did not conduct Egger’s and Begg’s tests in stratification analyses of ethnicity. Both Egger’s and Begg’s tests revealed that there was no obvious publication bias in overall analysis for rs962917 polymorphism. The power of this meta-analysis about rs962917 polymorphism ranged from 0.57 to 0.97.
The FPRP of four genetic models was less than 0.5, indicating our data about this polymorphism was trustworthy.
Table 4: Meta-analysis of associations between the rs962917 polymorphism and IBD, UC, CD.
Disease |
Comparison |
Populations |
Studies |
OR (95% CI) |
P-value |
P for heterogeneity |
Model |
I2 (%) |
PBegger/PEgger for Publication bias |
IBD |
A vs. G |
Overall |
3 |
1.13(1.04,1.23) |
0.003 |
0.667 |
F |
0.0 |
0.602/0.400 |
Caucasian |
2 |
1.15(1.05,1.26) |
0.002 |
0.727 |
F |
0.0 |
Na/Na |
||
Asian |
1 |
1.04(0.84,1.29) |
0.695 |
Na |
Na |
Na |
Na/Na |
||
AA vs. GG+GA |
Overall |
3 |
1.26(1.10,1.43) |
<0.001 |
0.130 |
F |
51.1 |
0.117/0.595 |
|
Caucasian |
2 |
1.28(1.11,1.48) |
0.001 |
0.055 |
R |
72.9 |
Na/Na |
||
Asian |
1 |
1.16(0.88,1.52) |
0.285 |
Na |
Na |
Na |
Na/Na |
||
AA+GA vs. GG |
Overall |
3 |
1.08(0.94,1.25) |
0.281 |
0.273 |
F |
23.0 |
0.602/0.460 |
|
Caucasian |
2 |
1.12(0.96,1.30) |
0.148 |
0.467 |
F |
0.0 |
Na/Na |
||
Asian |
1 |
0.76(0.45,1.26) |
0.284 |
Na |
Na |
Na |
Na/Na |
||
AA vs. GG |
Overall |
3 |
1.31(1.10,1.58) |
0.003 |
0.118 |
F |
53.2 |
0.602/0.445 |
|
Caucasian |
2 |
1.40(1.15,1.70) |
0.001 |
0.335 |
F |
53.2 |
Na/Na |
||
Asian |
1 |
0.83(0.49,1.40) |
0.481 |
Na |
Na |
Na |
Na/Na |
||
UC |
A vs. G |
Overall |
3 |
1.12(1.01,1.24) |
0.025 |
0.426 |
F |
0.0 |
0.602/0.830 |
Caucasian |
2 |
1.12(1.00,1.24) |
0.048 |
0.199 |
F |
39.3 |
Na/Na |
||
Asian |
1 |
1.15(0.89,1.49) |
0.279 |
Na |
Na |
Na |
Na/Na |
||
AA vs. GG+GA |
Overall |
3 |
1.30(0.97,1.74) |
0.075 |
0.037 |
R |
69.7 |
0.602/0.415 |
|
Caucasian |
2 |
1.33(0.83,2.13) |
0.243 |
0.010 |
R |
84.8 |
Na/Na |
||
Asian |
1 |
1.28(0.93,1.77) |
0.132 |
Na |
Na |
Na |
Na/Na |
||
AA+GA vs. GG |
Overall |
3 |
1.06(0.89,1.25) |
0.508 |
0.884 |
F |
0.0 |
0.117/0.068 |
|
Caucasian |
2 |
1.07(0.89,1.25) |
0.443 |
0.921 |
F |
0.0 |
Na/Na |
||
Asian |
1 |
0.91(0.49,1.71) |
0.772 |
Na |
Na |
Na |
Na/Na |
||
AA vs. GG |
Overall |
3 |
1.29(1.04,1.30) |
0.020 |
0.151 |
F |
47.1 |
0.602/0.800 |
|
Caucasian |
2 |
0.98(0.83,1.15) |
0.169 |
0.071 |
R |
69.2 |
Na/Na |
||
Asian |
1 |
0.83(0.66,1.04) |
0.135 |
Na |
Na |
Na |
Na/Na |
||
CD |
A vs. G |
Overall |
3 |
1.12(1.00,1.28) |
0.044 |
0.289 |
F |
19.3 |
0.117/0. 107 |
Caucasian |
2 |
1.17(1.05,1.30) |
0.005 |
0.703 |
F |
0.0 |
Na/Na |
||
Asian |
1 |
0.94(0.72,1.22) |
0.622 |
Na |
Na |
Na |
Na/Na |
||
AA vs. GG+GA |
Overall |
3 |
1.24(1.07,1.44) |
0.005 |
0.310 |
F |
14.7 |
0.602/0.989 |
|
Caucasian |
2 |
1.30(1.10,1.54) |
0.002 |
0.339 |
F |
0.0 |
Na/Na |
||
Asian |
1 |
1.03(0.74,1.44) |
0.846 |
Na |
Na |
Na |
Na/Na |
||
AA+GA vs. GG |
Overall |
3 |
1.04(0.78,1.40) |
0.780 |
0.099 |
R |
56.8 |
0.602/0.476 |
|
Caucasian |
2 |
1.14(0.96,1.37) |
0.142 |
0.294 |
F |
9.1 |
Na/Na |
||
Asian |
1 |
0.63(0.35,1.14) |
0.128 |
Na |
Na |
Na |
Na/Na |
||
AA vs. GG |
Overall |
3 |
1.21(0.83,1.76) |
0.323 |
0.074 |
R |
61.7 |
0.602/0.179 |
|
Caucasian |
2 |
1.43(1.14,1.80) |
0.002 |
0.901 |
F |
0.0 |
Na/Na |
||
Asian |
1 |
0.83(0.66,1.04) |
0.194 |
Na |
Na |
Na |
Na/Na |
*Bold values are statistically significant (P < 0.05). Abbreviations: OR, odds ratio; 95% CI, 95% confidence interval; CD, Crohn’s disease; UC, ulcerative disease; IBD, inflammatory bowel disease; F, fixed effects model; R, random effects model; Na, not available.
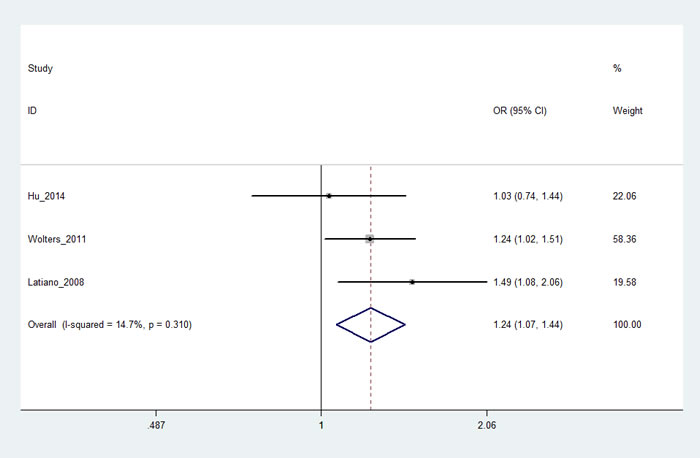
Figure 3: Forest plot shows odds ratio for the associations between rs962917 and CD( AA vs. GG+GA).
Meta-analysis of rs1457092, rs2305764, rs2305767
Five papers [14, 15, 18, 20, 21] including seven studies with 7,137 cases and 8,106 controls examined rs1457092 polymorphism; six papers [14-16, 18, 20, 21] including eight studies with 8,304 cases and 8,780 controls studied rs2305764 polymorphism; five papers [14, 15, 18, 20, 21] including seven studies with 7,137 cases and 8,106 controls studied rs2305767 polymorphism. For these three SNPs, we did not perform stratification analyses due to lack of data. As shown in Table 5, we found rs1457092 increased the risk of IBD (AA vs. CC+CA: OR, 1.20; 95% CI, 1.05-1.38, P = 0.009, Figure 4a) or UC (Figure 4b), but not CD. For rs2305764, we also found rs2305764 increased the risk of IBD in recessive model (AA vs. GG+GA: OR, 1.14; 95% CI, 1.00-1.30, P = 0.045, Figure 4c). With regard to rs2305767, our results suggested rs2305767 was associated with a decreased risk of UC (GG+AG vs. AA: OR, 0.84; 95% CI, 0.72-0.97, P = 0.020, Figure 4d), but not associated with IBD and CD risk. The power analysis showed that the power of this meta-analysis with regard to rs1457092, rs2305764, rs2305767 polymorphisms was greater than 0.95. The FPRP of genetic models were less than 0.5, indicating our data about these polymorphisms was trustworthy.
Table 5: Meta-analysis of associations between rs1457092, rs2305764, rs2305767 polymorphisms and IBD, UC, CD.
Polymorphism |
Comparison |
Disease |
Studies |
OR (95% CI) |
P-value |
P for heterogeneity |
Model |
I2 (%) |
PBegger/PEgger for Publication bias |
rs1457092 |
A vs. C |
IBD |
7 |
1.11(1.01,1.21) |
0.029 |
0.001 |
R |
73.1 |
0.652/0.837 |
UC |
7 |
1.15(1.08,1.22) |
<0.001 |
0.120 |
F |
40.7 |
0.293/0.711 |
||
CD |
7 |
1.05(0.93,1.19) |
0.402 |
0.001 |
R |
73.3 |
0.652/0.977 |
||
AA vs. CC+CA |
IBD |
7 |
1.20(1.05,1.38) |
0.009 |
0.056 |
R |
51.2 |
0.652/0.822 |
|
UC |
7 |
1.27(1.13,1.42) |
<0.001 |
0.193 |
F |
30.8 |
0.453/0.413 |
||
CD |
7 |
0.92(0.54,1.55) |
0.745 |
<0.001 |
R |
94.6 |
0.099/0.104 |
||
AA+CA vs. CC |
IBD |
7 |
1.16(1.06,1.26) |
0.001 |
0.287 |
F |
18.7 |
0.453/0.868 |
|
UC |
7 |
1.16(1.06,1.28) |
0.001 |
0.204 |
F |
30.9 |
0.453/0.989 |
||
CD |
7 |
1.05(0.90,1.24) |
0.528 |
0.003 |
R |
69.8 |
0.881/0.918 |
||
AA vs. CC |
IBD |
7 |
1.25(1.04,1.51) |
0.018 |
0.004 |
R |
68.2 |
0.652/0.851 |
|
UC |
7 |
1.34(1.18,1.51) |
<0.001 |
0.128 |
F |
39.6 |
0.176/0.532 |
||
CD |
7 |
1.13(0.89,1.42) |
0.316 |
0.007 |
R |
66.4 |
0.881/0.984 |
||
rs2305764 |
A vs. G |
IBD |
8 |
1.06(0.99,1.14) |
0.084 |
0.026 |
R |
56.1 |
1.000/0.918 |
UC |
8 |
0.97(0.71,1.34) |
0.867 |
<0.001 |
R |
96.9 |
0.138/0.688 |
||
CD |
8 |
0.71(0.45,1.13) |
0.150 |
<0.001 |
R |
98.3 |
0.322/0.166 |
||
AA vs. GG+GA |
IBD |
8 |
1.14(1.00,1.30) |
0.045 |
0.020 |
R |
57.8 |
0.621/0.861 |
|
UC |
8 |
1.01(0.69,1.47) |
0.966 |
<0.001 |
R |
92.1 |
0.048/0.054 |
||
CD |
8 |
0.94(0.67,1.33) |
0.739 |
<0.001 |
R |
86.6 |
0.621/0.084 |
||
AA+GA vs. GG |
IBD |
8 |
1.05(0.98,1.12) |
0.145 |
0.134 |
F |
37.0 |
0.458/0.853 |
|
UC |
8 |
0.95(0.63,1.43) |
0.800 |
<0.001 |
R |
96.2 |
0.805/0.495 |
||
CD |
8 |
0.66(0.35,1.26) |
0.209 |
<0.001 |
R |
98.2 |
0.322/0.407 |
||
AA vs. GG |
IBD |
8 |
1.15(0.99,1.34) |
0.061 |
0.015 |
R |
59.6 |
0.621/0.993 |
|
UC |
8 |
0.98(0.58,1.63) |
0.928 |
<0.001 |
R |
94.8 |
0.048/0.080 |
||
CD |
8 |
0.83(0.53,1.30) |
0.413 |
<0.001 |
R |
90.9 |
0.621/0.068 |
||
rs2305767 |
G vs. A |
IBD |
7 |
0.92(0.83,1.02) |
0.113 |
<0.001 |
R |
79.1 |
0.652/0.964 |
UC |
7 |
0.89(0.80,0.99) |
0.032 |
0.005 |
R |
67.8 |
0.652/0.577 |
||
CD |
7 |
0.98(0.89,1.07) |
0.622 |
0.024 |
R |
58.9 |
0.652/0.379 |
||
GG vs. AA+AG |
IBD |
7 |
0.91(0.78,1.06) |
0.240 |
0.004 |
R |
68.5 |
0.453/0.644 |
|
UC |
7 |
0.89(0.77,1.03) |
0.124 |
0.089 |
R |
45.3 |
0.881/0.468 |
||
CD |
7 |
1.00(0.90,1.11) |
0.972 |
0.145 |
F |
37.1 |
0.293/0.259 |
||
GG+AG vs. AA |
IBD |
7 |
0.88(0.77,1.01) |
0.067 |
0.002 |
R |
71.9 |
0.881/0.837 |
|
UC |
7 |
0.84(0.72,0.97) |
0.020 |
0.009 |
R |
64.7 |
0.881/0.441 |
||
CD |
7 |
0.98(0.89,1.07) |
0.601 |
0.119 |
F |
40.7 |
0.881/0.500 |
||
GG vs. AA |
IBD |
7 |
0.85(0.69,1.05) |
0.134 |
<0.001 |
R |
77.6 |
0.453/0.937 |
|
UC |
7 |
0.81(0.66,0.99) |
0.039 |
0.014 |
R |
62.4 |
0.881/0.743 |
||
CD |
7 |
0.96(0.79,1.17) |
0.675 |
0.029 |
R |
57.2 |
0.453/0.351 |
*Bold values are statistically significant (P < 0.05). Abbreviations: OR, odds ratio; 95% CI, 95% confidence interval; CD, Crohn’s disease; UC, ulcerative disease; IBD, inflammatory bowel disease; F, fixed effects model; R, random effects model.
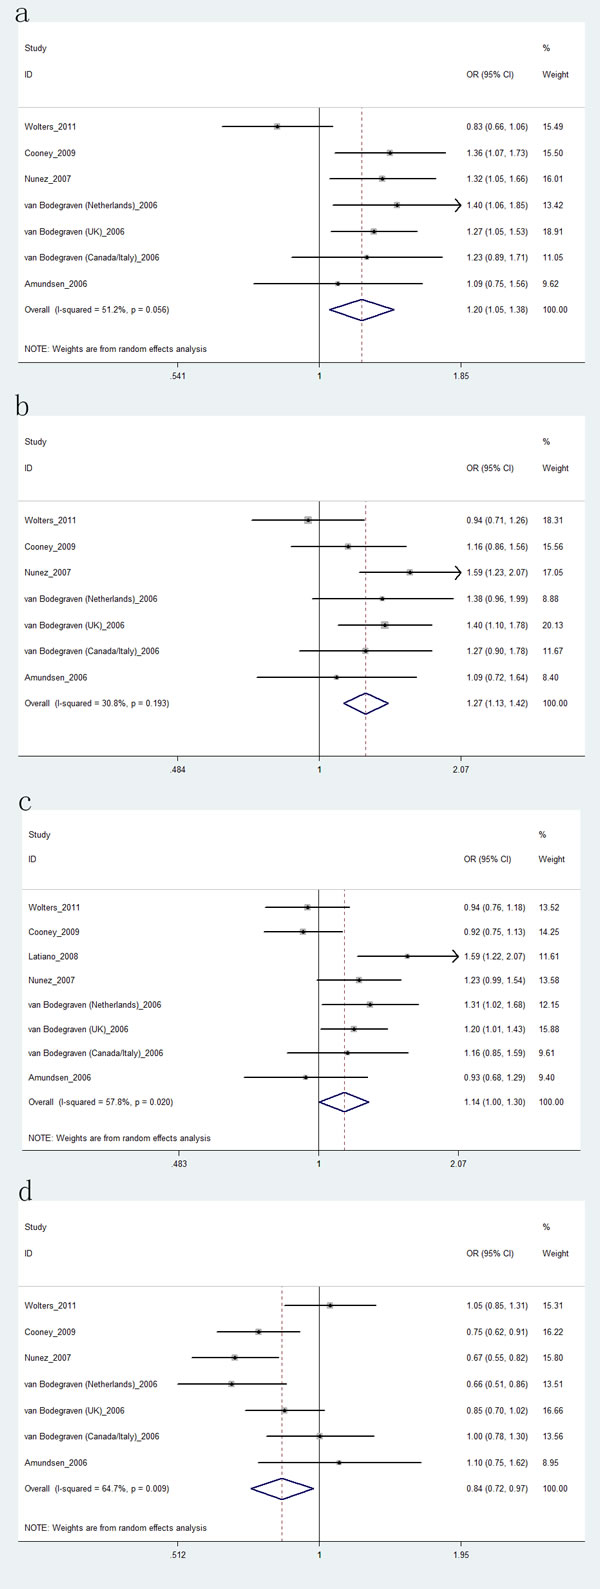
Figure 4: Forest plot shows odds ratio for the associations: a. between rs1457092 polymorphism and risk of IBD (AA vs. CC+CA); b. between rs1457092 polymorphism and risk of UC (AA vs. CC+CA); c. between the rs2305764 polymorphism and risk of IBD (AA vs. GG+GA); d. between rs2305767 polymorphism and risk of UC (GG+AG vs. AA).
Sensitivity analysis and publication bias
We assessed sensitivity by omitting each study once at a time in every genetic model for these five SNPs. The pooled ORs for the effects of rs962917, rs1457092, rs2305764 and rs2305767 on the risk for IBD or CD or UC indicated that our data were stable and trustworthy about these four SNPs. However, we found pooled ORs for the effect of rs1545620 on the risk for IBD (Figure 5a) or CD (Figure 5b) or UC (Figure 5c) changed significantly when we omitted the study [16] by Latiano et al., suggesting that our data about rs1545620 polymorphism were poorly stable and trustworthy.
Both Egger’s and Begg’s tests were used to evaluated the publication bias of this meta-analysis. Our data revealed that there was no obvious publication bias in overall analysis for these five SNPs (Table 2, 4, 5 and Figure 6). Due to limited studies, we did not conduct Egger’s and Begg’s tests in stratification analyses of ethnicity.
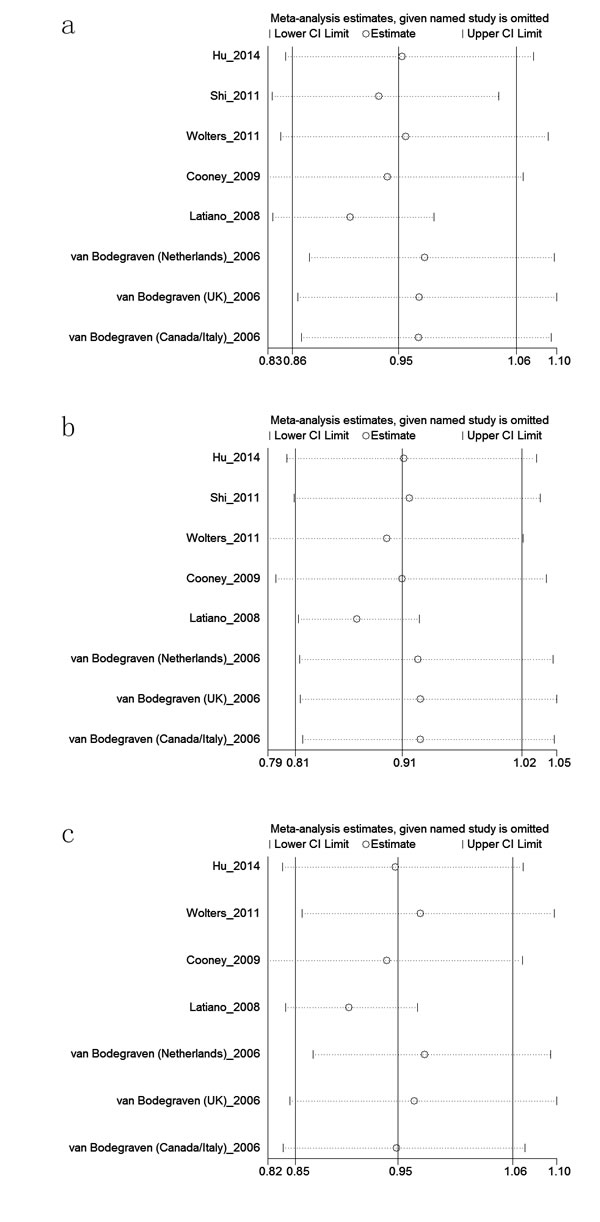
Figure 5: Sensitivity analyses between the rs1545620 polymorphism and (a): IBD, (b): UC and (c): CD risk in allele model.
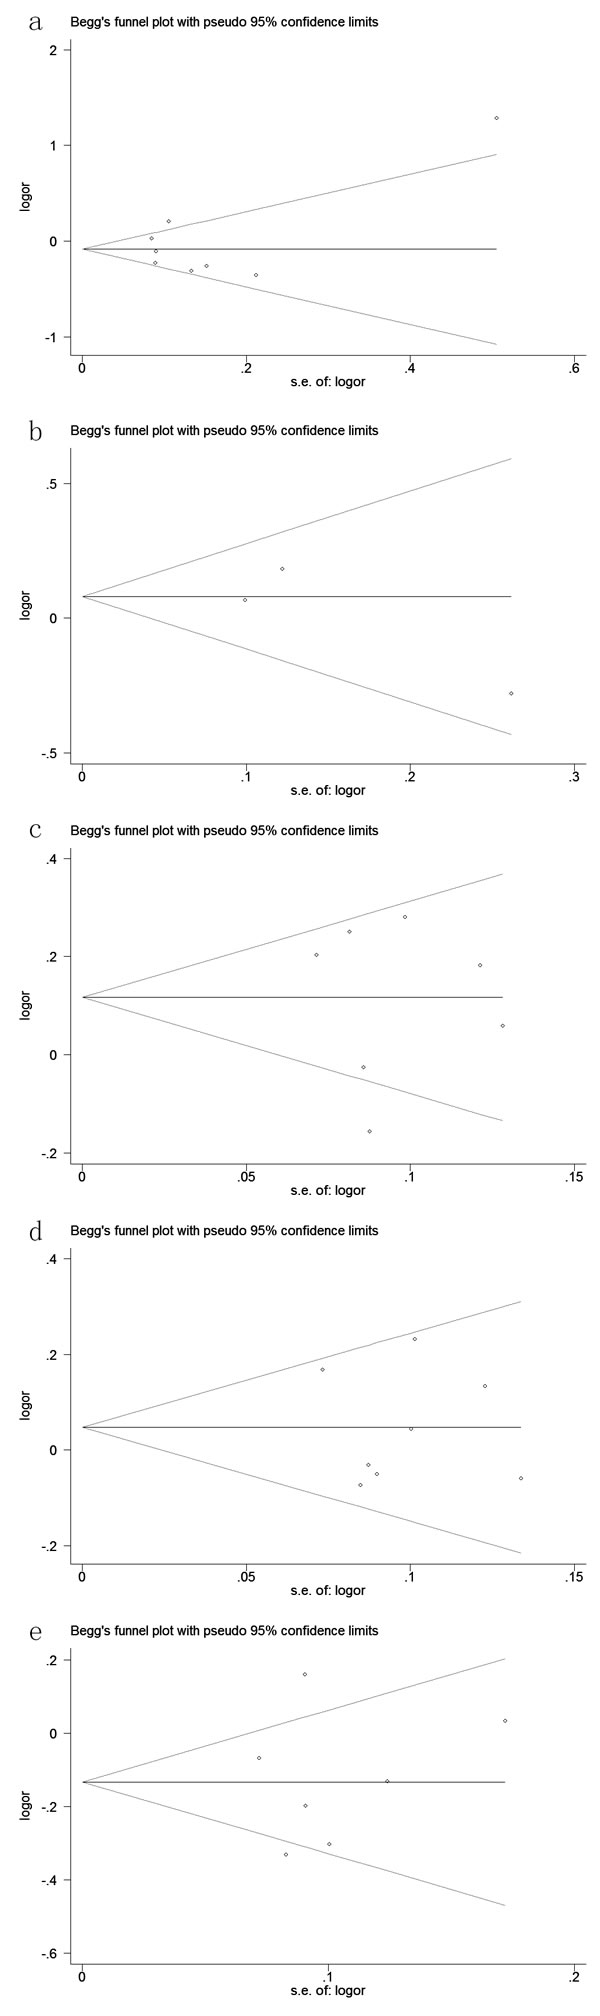
Figure 6: Begg’s tests for publication bias between (a): rs1545620, (b): rs962917, (c): rs1457092, (d): rs2305764 and (e): rs2305767 polymorphisms and the risk of IBD in dominant model.
DISCUSSION
In this meta-analysis, we evaluated recent studies on the relationships between MY09B gene polymorphisms and susceptibility to IBD, CD and UC. The primary findings were as follows: (1) the rs1545620 polymorphism was associated with a decreased risk of IBD; (2)rs2305767 decreased the risk of UC; (3) rs962917 increased the risk of IBD, CD and UC; (4) rs1457092 increased the risk of IBD and UC; (5) rs2305764 was associated with an increased risk of IBD; and (6) stratification analyses indicated that rs1545620 decreased the risk of IBD in Caucasian populations, while rs962917 increased the risk of IBD, CD and UC in Caucasian populations.
MYO9B is a candidate gene that is reportedly associated with celiac disease [10] and diabetes type 1 (DM type 1) [24, 25]. A previous study [26] demonstrated increased intestinal permeability in DM type 1 patients in vivo, which was associated with increased MYO9B gene expression. Their findings indicated a close link between MYO9B expression and changes in intestinal permeability [26]. MYO9B is a single motor protein with a Rho GTPase-activating domain, which downregulates Rho-dependent signaling pathways by converting active Rho-GTP into inactive Rho-GDP [9]. GTPases of the Rho family have been demonstrated to be involved in the regulation of tight junction function and actin filament remodeling, which lead to enhanced paracellular epithelial permeability [27, 28]. Therefore, it is reasonable to hypothesize that MYO9B may cause impaired intestinal barrier integrity. Furthermore, IBD is often characterized by increased permeability of intestinal epithelium [29, 30]. These findings suggest that MY09B may play an important role in the pathogenesis of IBD, and that MY09B is a candidate susceptibility gene for IBD.
To date, several studies have assessed associations between MYO9B gene polymorphisms and IBD susceptibility; however, they reported conflicting results. Several studies [14, 17, 19, 21] did not find MYO9B to be a candidate gene for IBD, while other studies [15, 16, 18, 20] suggested this gene was significantly associated with IBD, CD or UC risk. However, these studies had inadequate statistical power and involved relatively small samples. To overcome these limitations, we conducted a meta-analysis to assess associations between MY09B gene polymorphisms and the risk of IBD, CD and UC.
We determined that rs1545620 was associated with a decreased risk of IBD and rs2305767 was associated with a decreased risk of UC. Moreover, three other SNPs (rs962917, rs1457092 and rs2305764) increased the risk of IBD, CD or UC. It is noteworthy that only rs962917 was related to the risk of CD in this meta-analysis, while the four other SNPs were not. We found that rs1457092 and rs2305767 were associated with the risk of UC. Previous studies have demonstrated genetic differences between CD and UC [31]. Twin concordance rate data have indicated that the heritable component is less crucial for UC than for CD [32].A Spanish study [20] by Nunez et al. found that MYO9B gene polymorphisms were not correlated with CD, but were with UC. Van Bodegraven et al. reported that MY09B was more strongly associated with UC than with CD [18]. Furthermore, they found MY09B gene polymorphisms were not associated with CD in the Canadian/Italian populations [18]. It is therefore reasonable to assume that MYO9B may affect susceptibility to UC specifically. With regard to rs962917, only three studies [16, 17, 21] involving 1,500 cases and 2,005 controls addressed the association between this SNP and CD; however, these studies involved a smaller sample size compared with works focusing on the other four SNPs. Any association between SNPs in genes with diseases is greatly affected by the number of subjects. Given the small number of participants, we should interpret the relationship between rs962917 and CD with caution. Furthermore, the power of this meta-analysis about rs962917 polymorphism was smaller compared with other four polymorphisms. The power of rs1457092, rs2305764, rs2305767 and rs1545620 polymorphisms was greater than 0.95, which suggested that our data were trustworthy. Further studies on the role of MY09B in UC are warranted.
Analyses stratified by ethnicity indicated that rs1545620 decreased the risk of IBD in Caucasian populations. Our data also suggest that rs962917 increased the risk of IBD, CD and UC in Caucasian populations. However, a relationship between MY09B and IBD, CD or UC was not detected in Asian populations. The genetic background of IBD may vary among ethnicities. Previous studies have demonstrated OCTN or CARD15 gene variations to be associated with susceptibility to CD in Caucasian populations [33, 34], but not in Asian populations [35]. Two Asian studies from China [17, 19] reported no associations between MY09B gene polymorphisms and IBD. Although Hu et al. revealed that MYO9B gene might influence the sub-phenotypic expression of CD, they did not find an association between these MYO9B polymorphisms and intestinal permeability in IBD [17]. It is intriguing to hypothesize that variations in MYO9B predispose Caucasians to IBD. However, we cannot definitively state that MYO9B is not related to IBD in Asian patients, because this meta-analysis included only two Chinese studies [17, 19] with limited sample sizes. Larger-scale studies are urgently needed to assess associations between MYO9B gene polymorphisms and IBD in Asian populations and other ethnicities.
Among all included studies, one Chinese study [17] did not conform to HWE with respect to the rs1545620 polymorphism. After excluding this study, the pooled estimates of the remaining studies indicated that the rs1545620 polymorphism might decrease the risk of IBD (Table 3), consistent with the initial result. Heterogeneity was not reduced after exclusion of the Chinese study; it is thus tempting to speculate that this may not have been a source of heterogeneity. A sensitivity analysis of rs1545620 omitting the study by Latiano et al. [16] significantly altered the pooled ORs for the effect of this SNP on the risk of IBD, CD or UC, suggesting that the rs1545620 data are poorly reliable. It is noting that this study [16] did not provide the basic data of controls. We did not make sure whether the controls in this study were matched cases for age, sex or other confounders. As a result, we could not exclude the possibility that their results were false positive. The reasons why this study [16] affected the results of rs1545620 polymorphism remained unclear, but may be partially explained by above assumption. As for other reasons, clinical heterogeneity, and different ethnic populations may explain it, which needs further verification.
Several potential limitations of this meta-analysis should be taken into consideration. First, one Chinese study did not conform to HWE with respect to rs1545620 polymorphism; however, our data indicated the results of this SNP were trustworthy. Second, the numbers of studies included in the meta-analysis was small, and the sample size of this meta-analysis was not large enough. Third, our results were based on unadjusted estimates, without considering other confounders (such as age, gender, or environmental factors); thus, a more precise analysis should be performed, assuming the availability of individual data. Fourth, due to inclusion of only two Asian studies, we could not conduct analyses on rs1457092, rs2305764 or rs2305767 stratified by ethnicity. Future studies that include Asian populations and other ethnic groups are warranted due to ethnic differences in gene polymorphisms. Fifth, the heterogeneity of this meta-analysis was high in some genetic models.
In conclusion, this meta-analysis indicated that five SNPs within MY09B were associated with the risk of IBD, CD or UC. Future large-scale studies in Asian populations and other ethnicities are urgently needed to more accurately characterize associations between MY09B gene polymorphisms and IBD, CD and UC.
MATERIALS AND METHODS
Literature search
We performed a comprehensive search in PubMed, Embase, and CNKI databases to identify studies through January 1, 2016 that were related with the MY09B gene polymorphisms and IBD, CD or UC. The following search terms were used: “inflammatory bowel disease,” ‘‘IBD’’ ‘‘ulcerative disease,’’ ‘‘UC,’’ ‘‘Crohn’s disease,’’ ‘‘CD,’’ ‘‘MYO9B,’’ ‘‘myosin IXB’’ and ‘‘polymorphisms’’. Two independent authors conducted the search. No language or other restrictions were placed on the search. We also performed a manual search of references cited in published articles to identify other initially omitted studies. Any disagreements were resolved by consensus.
Criteria of inclusion and exclusion
Criteria for the inclusion in this analysis were: (1) studies that evaluated the associations between UC or CD or IBD with at least one of the five single nucleotide polymorphisms (SNPs), (2) studied on human beings, (3) study provided sufficient data to calculate the Odds ratios (ORs) and 95% confidence intervals (CIs), and P value, and (4) case-control study. Exclusion criteria were: (1) duplication of previous publications; (2) review, editorial, or other non-original studies; (3) studies without detailed genotype data; (4) studies were without control group.
Data extraction and quality assessment
For all eligible studies, the extracted information including: name of first author, publication year, country of origin, ethnicity, numbers of cases (UC and CD) and controls, and polymorphisms. Two authors independently performed the extraction of data and evaluated the study quality based on the Newcastle-Ottawa Scale (NOS) [36]. Total NOS scores ranged from 0 to 9. A score ranging 5 to 9 stars is considered to be a generally high methodological quality whereas a score ranging 0 to 4 is regarded as a relatively poor quality [37]. They compared results and agreed on a consensus; disagreements were resolved by discussion.
Statistical analysis
All statistical analyses were performed using the Stata 11.0 software (StataCorp, College Station, TX, USA). Pooled ORs and 95% CIs were calculated to assess the associations between UC or CD or IBD and the five polymorphisms of MY09B gene. P < 0.05 was considered statistically significant. Heterogeneity was evaluated by the Q statistic (significant at P < 0.1) and I2 statistic (where > 50% indicates significant heterogeneity) [38]. A fixed-effect model was used for comparing the trials without showing heterogeneity, whereas a random effect model was selected for comparing trials showing heterogeneity. Pooled ORs were calculated for allele model, the dominant model, the recessive model and the homozygous model. We performed sensitivity analyses by omitting each study in turn to determine the effect on the test of heterogeneity and evaluated the stability of the overall results. Hardy-Weinberg equilibrium (HWE) was assessed in the controls using Pearson’s χ2 test. Potential publication bias was investigated with the use of Begger’s and Egger’s linear regression test [39]; P < 0.05 was considered to indicate statistically significant. The power of this meta-analysis for five SNPs was calculated according to the method recommended by Hedges and Pigott [40], with a significant value of 0.05. We calculated the FPRP of this meta-analysis based on the methods of Wacholder et al. [41] and preset an FPRP value of 0.5.
Abbreviations
IBD, inflammatory bowel disease; CD, Crohn’s disease; UC, ulcerative colitis; MYO9B, Myosin IXB; CI, confidence interval; OR, odds ratio; NOS, Newcastle-Ottawa Scale; HWE, Hardy-Weinberg equilibrium.
CONFLICTS OF INTEREST
The authors declare no conflict of interest.
REFERENCES
1. Baumgart DC and Carding SR. Inflammatory bowel disease: cause and immunobiology. Lancet. 2007; 369:1627-1640.
2. Xavier RJ and Podolsky DK. Unravelling the pathogenesis of inflammatory bowel disease. Nature. 2007; 448:427-434.
3. Cho JH and Weaver CT. The genetics of inflammatory bowel disease. Gastroenterology. 2007; 133:1327-1339.
4. Abraham C and Cho JH. Inflammatory bowel disease. N Engl J Med. 2009; 361:2066-2078.
5. Fisher SA, Tremelling M, Anderson CA, Gwilliam R, Bumpstead S, Prescott NJ, Nimmo ER, Massey D, Berzuini C, Johnson C, Barrett JC, Cummings FR, Drummond H, Lees CW, Onnie CM, Hanson CE, et al. Genetic determinants of ulcerative colitis include the ECM1 locus and five loci implicated in Crohn’s disease. Nature genetics. 2008; 40:710-712.
6. Franke A, Balschun T, Karlsen TH, Hedderich J, May S, Lu T, Schuldt D, Nikolaus S, Rosenstiel P, Krawczak M and Schreiber S. Replication of signals from recent studies of Crohn’s disease identifies previously unknown disease loci for ulcerative colitis. Nature genetics. 2008; 40:713-715.
7. Inoue A, Saito J, Ikebe R and Ikebe M. Myosin IXb is a single-headed minus-end-directed processive motor. Nature cell biology. 2002; 4:302-306.
8. Wirth JA, Jensen KA, Post PL, Bement WM and Mooseker MS. Human myosin-IXb, an unconventional myosin with a chimerin-like rho/rac GTPase-activating protein domain in its tail. Journal of cell science. 1996; 109:653-661.
9. Muller RT, Honnert U, Reinhard J and Bahler M. The rat myosin myr 5 is a GTPase-activating protein for Rho in vivo: essential role of arginine 1695. Molecular biology of the cell. 1997; 8:2039-2053.
10. Monsuur AJ, de Bakker PI, Alizadeh BZ, Zhernakova A, Bevova MR, Strengman E, Franke L, van’t Slot R, van Belzen MJ, Lavrijsen IC, Diosdado B, Daly MJ, Mulder CJ, Mearin ML, Meijer JW, Meijer GA, et al. Myosin IXB variant increases the risk of celiac disease and points toward a primary intestinal barrier defect. Nature genetics. 2005; 37:1341-1344.
11. Van Belzen MJ, Meijer JW, Sandkuijl LA, Bardoel AF, Mulder CJ, Pearson PL, Houwen RH and Wijmenga C. A major non-HLA locus in celiac disease maps to chromosome 19. Gastroenterology. 2003; 125:1032-1041.
12. Rioux JD, Silverberg MS, Daly MJ, Steinhart AH, McLeod RS, Griffiths AM, Green T, Brettin TS, Stone V, Bull SB, Bitton A, Williams CN, Greenberg GR, Cohen Z, Lander ES, Hudson TJ, et al. Genomewide search in Canadian families with inflammatory bowel disease reveals two novel susceptibility loci. American journal of human genetics. 2000; 66:1863-1870.
13. Massey D and Parkes M. Common pathways in Crohn’s disease and other inflammatory diseases revealed by genomics. Gut. 2007; 56:1489-1492.
14. Amundsen SS, Vatn M, group Is, Wijmenga C, Sollid LM and Lie BA. Association analysis of MYO9B gene polymorphisms and inflammatory bowel disease in a Norwegian cohort. Tissue antigens. 2006; 68:249-252.
15. Cooney R, Cummings JR, Pathan S, Beckly J, Geremia A, Hancock L, Guo C, Morris A and Jewell DP. Association between genetic variants in myosin IXB and Crohn’s disease. Inflammatory bowel diseases. 2009; 15:1014-1021.
16. Latiano A, Palmieri O, Valvano MR, D’Inca R, Caprilli R, Cucchiara S, Sturniolo GC, Bossa F, Andriulli A and Annese V. The association of MYO9B gene in Italian patients with inflammatory bowel diseases. Alimentary pharmacology & therapeutics. 2008; 27:241-248.
17. Hu J, Mei Q, Huang J, Hu NZ, Liu XC and Xu JM. Association of MYO9B gene polymorphisms with inflammatory bowel disease in Chinese Han population. World journal of gastroenterology. 2014; 20:7466-7472.
18. van Bodegraven AA, Curley CR, Hunt KA, Monsuur AJ, Linskens RK, Onnie CM, Crusius JB, Annese V, Latiano A, Silverberg MS, Bitton A, Fisher SA, Steinhart AH, Forbes A, Sanderson J, Prescott NJ, et al. Genetic variation in myosin IXB is associated with ulcerative colitis. Gastroenterology. 2006; 131:1768-1774.
19. Shi J, Zhou L, Zhernakova A, Qian J, Zhu F, Sun G, Zhu L, Ma X, Dijkstra G, Wijmenga C, Faber KN, Lu X and Weersma RK. Haplotype-based analysis of ulcerative colitis risk loci identifies both IL2 and IL21 as susceptibility genes in Han Chinese. Inflammatory bowel diseases. 2011; 17:2472-2479.
20. Nunez C, Oliver J, Mendoza JL, Gomez-Garcia M, Pinero A, Taxonera C, Diaz-Rubio M, Lopez-Nevot MA, de la Concha EG, Nieto A, Urcelay E, Martinez A and Martin J. MYO9B polymorphisms in patients with inflammatory bowel disease. Gut. 2007; 56:1321-1322.
21. Wolters VM, Xu W, Zhao X, Walters TD, Griffiths AM, Silverberg MS and Muise AM. Replication of genetic variation in the MYO9B gene in Crohn’s disease. Hum Immunol. 2011; 72:592-597.
22. Wapenaar MC, Monsuur AJ, van Bodegraven AA, Weersma RK, Bevova MR, Linskens RK, Howdle P, Holmes G, Mulder CJ, Dijkstra G, van Heel DA and Wijmenga C. Associations with tight junction genes PARD3 and MAGI2 in Dutch patients point to a common barrier defect for coeliac disease and ulcerative colitis. Gut. 2008; 57:463-467.
23. Annese V, Latiano A, Palmieri O and Andriulli A. Dissecting genetic predisposition to inflammatory bowel disease: current progress and prospective application. Expert Rev Clin Immunol. 2007; 3:287-298.
24. Persengiev S, Koeleman BP, Downes K, Valdigem G, van der Slik AR, Eerligh P, Monsuur A, Bruining GJ, Wijmenga C, Todd JA, Roep BO and Alizadeh BZ. Association analysis of myosin IXB and type 1 diabetes. Hum Immunol. 2010; 71:598-601.
25. Santiago JL, Martinez A, Nunez C, de la Calle H, Fernandez-Arquero M, de la Concha EG and Urcelay E. Association of MYO9B haplotype with type 1 diabetes. Hum Immunol. 2008; 69:112-115.
26. Sapone A, de Magistris L, Pietzak M, Clemente MG, Tripathi A, Cucca F, Lampis R, Kryszak D, Carteni M, Generoso M, Iafusco D, Prisco F, Laghi F, Riegler G, Carratu R, Counts D, et al. Zonulin upregulation is associated with increased gut permeability in subjects with type 1 diabetes and their relatives. Diabetes. 2006; 55:1443-1449.
27. Bruewer M, Hopkins AM, Hobert ME, Nusrat A and Madara JL. RhoA, Rac1, and Cdc42 exert distinct effects on epithelial barrier via selective structural and biochemical modulation of junctional proteins and F-actin. American journal of physiology Cell physiology. 2004; 287:C327-335.
28. Matter K and Balda MS. Signalling to and from tight junctions. Nature reviews Molecular cell biology. 2003; 4:225-236.
29. Berkes J, Viswanathan VK, Savkovic SD and Hecht G. Intestinal epithelial responses to enteric pathogens: effects on the tight junction barrier, ion transport, and inflammation. Gut. 2003; 52:439-451.
30. Bruewer M, Luegering A, Kucharzik T, Parkos CA, Madara JL, Hopkins AM and Nusrat A. Proinflammatory cytokines disrupt epithelial barrier function by apoptosis-independent mechanisms. Journal of immunology. 2003; 171:6164-6172.
31. van Heel DA, Fisher SA, Kirby A, Daly MJ, Rioux JD, Lewis CM and Genome Scan Meta-Analysis Group of the IBDIGC. Inflammatory bowel disease susceptibility loci defined by genome scan meta-analysis of 1952 affected relative pairs. Human molecular genetics. 2004; 13:763-770.
32. Russell RK and Satsangi J. IBD: a family affair. Best practice & research Clinical gastroenterology. 2004; 18:525-539.
33. Cavanaugh JA, Adams KE, Quak EJ, Bryce ME, O’Callaghan NJ, Rodgers HJ, Magarry GR, Butler WJ, Eaden JA, Roberts-Thomson IC, Pavli P, Wilson SR and Callen DF. CARD15/NOD2 risk alleles in the development of Crohn’s disease in the Australian population. Annals of human genetics. 2003; 67:35-41.
34. Vermeire S and Rutgeerts P. Current status of genetics research in inflammatory bowel disease. Genes Immun. 2005; 6:637-645.
35. Li M, Gao X, Guo CC, Wu KC, Zhang X and Hu PJ. OCTN and CARD15 gene polymorphism in Chinese patients with inflammatory bowel disease. World journal of gastroenterology. 2008; 14:4923-4927.
36. Stang A. Critical evaluation of the Newcastle-Ottawa scale for the assessment of the quality of nonrandomized studies in meta-analyses. European journal of epidemiology. 2010; 25:603-605.
37. Ownby RL, Crocco E, Acevedo A, John V and Loewenstein D. Depression and risk for Alzheimer disease: systematic review, meta-analysis, and metaregression analysis. Archives of general psychiatry. 2006; 63:530-538.
38. Higgins JP and Thompson SG. Quantifying heterogeneity in a meta-analysis. Statistics in medicine. 2002; 21:1539-1558.
39. Peters JL, Sutton AJ, Jones DR, Abrams KR and Rushton L. Comparison of two methods to detect publication bias in meta-analysis. Jama. 2006; 295:676-680.
40. Hedges LV and Pigott TD. The power of statistical tests in meta-analysis. Psychological methods. 2001; 6:203-217.
41. Wacholder S, Chanock S, Garcia-Closas M, El Ghormli L and Rothman N. Assessing the probability that a positive report is false: an approach for molecular epidemiology studies. Journal of the National Cancer Institute. 2004; 96:434-442.