
INTRODUCTION
Neuroblastoma (NB) is a cancer of undifferentiated sympathetic neuroblasts that accounts for approximately 10% of all childhood cancer worldwide [1, 2]. It frequently originates in adrenal medulla but can develop in the sympathetic ganglia of the chest, abdomen or pelvis [1–3]. The tumor either regress spontaneously in infants or undergo relentless proliferation in children older than 1 year of age, and is characterized by the patient’s age at diagnosis, spread of the disease or genetic heterogeneity led by chromosomal aberration, oncogene amplification or allelic loss [1–3]. These diverse clinical presentations stratify NB tumors into risk groups in which low-risk group has a good prognosis and is cured by surgery alone, but high-risk group has a very poor prognosis despite of intensive chemotherapy [3–5]. Genome-wide surveys have identified a large number of protein biomarkers [6, 7], among which v-myc avian myelocytomatosis viral oncogene neuroblastoma derived homolog (MYCN) oncogene, is a strong prognostic marker for advance stage NB, indicating a poor survival rate [8–10]. Additionally, anaplastic lymphoma kinase (ALK) oncogene, which is amplified in 3–4% and frequently mutated in 6–10% of NB cases, reported to be another promising target for the disease treatment [11–14]. Therapeutic strategies such as targeting neuroblastoma cell surface disialoganglioside GD2 antigen with monoclonal antibodies has also shown a substantial improvement in the patient outcome [15]. Although, protein biomarkers and multimodal therapies have improved NB patients survival, still the survival chance for event-free survival (EFS) in high-risk group is less than 50% [5]. Therefore, there is a need to find new crucial players at the molecular level that can significantly associate with NB prognosis.
With advancement in the field of molecular biology and high-throughput techniques, it is now known that large portions of the mammalian genome are noncoding, spanning from short RNAs (including miRNAs, piRNAs, snoRNAs) to long RNAs of transcript length greater than 200 nucleotides [16, 17]. Long noncoding RNAs (lncRNAs), are regulatory RNAs transcribed either from intragenic or intergenic locus of the genome and constitute major proportion of the cellular transcripts [18–20]. The growing number of evidences show involvement of lncRNAs in gene-regulation, transport, differentiation, dosage-compensation, and protein synthesis [21–24]. Studies have also pointed out their expression to be altered in various types of cancer including NB, initiating tumor development and progression [22, 25–27]. For instance, the expression of lncRNA, neuroblastoma associated transcript-1 (NBAT-1) is down-regulated in high-risk NB and associated with poor patient survival [28]. Loss of NBAT-1 contributes to aggressive NB, indicating its importance as a tumor suppressor lncRNA [28]. The expression of lncRNA, short CASC15 isoform (CASC15-S) is also down-regulated in high-risk NB promoting neural growth and differentiation [29]. The expression of long intergenic non-protein coding RNA 467 (linc00467) is up-regulated by silenced N-MYC in NB cell line and its suppression promotes NB cell apoptosis [30].
MYCN amplification is a potent driver of NB oncogenesis. It encodes a transcription factor N-MYC, which first dimerizes to myc associated factor x (MAX) at E-box site of the promoter, and either activates or inhibits transcription of the target genes required in cell cycle, cell proliferation, neuronal differentiation, metabolism, and apoptosis in NB [31]. At the present time, lncRNAs that are altered by MYCN amplification and associated with prognostication for high-risk NB are largely unknown. Thus, here we performed differential expression study using microarray and RNA-seq based lncRNA and mRNA expression profiles between MYCN amplified and MYCN non-amplified subtypes in NB. The lncRNAs identified in both of the technologies, were further validated by quantitative reverse transcription polymerase chain reaction (RT-qPCR). Moreover, we performed co-expression study between lncRNAs and coding genes and identified lncRNA, SNHG1 and coding gene, TAF1D to be one of the highly positively co-expressed pair. Furthermore, we conducted Kaplan-Meier survival analysis and univariate/multivariate statistical analysis by integrating the clinical information of NB patients to the expression value of SNHG1, and explored its clinical implications. Our results suggest that SNHG1 can serve as a potential biomarker predicting NB patient’s survival and an important resource for future functional characterization.
RESULTS
Transcriptome analysis between MYCN amplified and MYCN non-amplified NB
To obtain the expression profile of lncRNAs, we first re-annotated the entire collection of probes for the Affymetrix HU133 plus 2.0 platform and identified 4,256 probes mapped to lncRNAs. Next, we carried out differential expression analysis of a microarray dataset (GEO accession GSE12460) with a total of 47 patients, out of which 14 were MYCN amplified and 33 were MYCN non-amplified (seventeen samples were removed with unknown MYCN status). We identified 21 lncRNAs and 591 coding genes to be differentially expressed (adjusted P ≤ 0.05 and fold change ≥ 2) in MYCN amplified samples compared with MYCN non-amplified ones in NB (Supplementary Table S1). Additionally, to enhance the data reliability, 13 lncRNAs (9 up-regulated and 4 down-regulated) that were reported in Gencode v.22 [18] were retained and shown as heatmap (Figure 1A). Next, to explore the biological functions of the differentially expressed coding genes, we performed a functional enrichment analysis. We found that biological processes such as serine family amino acid biosynthetic process, cell cycle, kinetochore assembly, centromere complex assembly, were significantly enriched for the up-regulated genes. These processes entail the involvement of genes in NB oncogenesis. In contrast, neuron projection development, neuron development, exocytosis, synapse assembly, biological processes got significantly enriched for the down-regulated genes. These processes entail their importance in the early stage of nervous system development (Figure 1B).
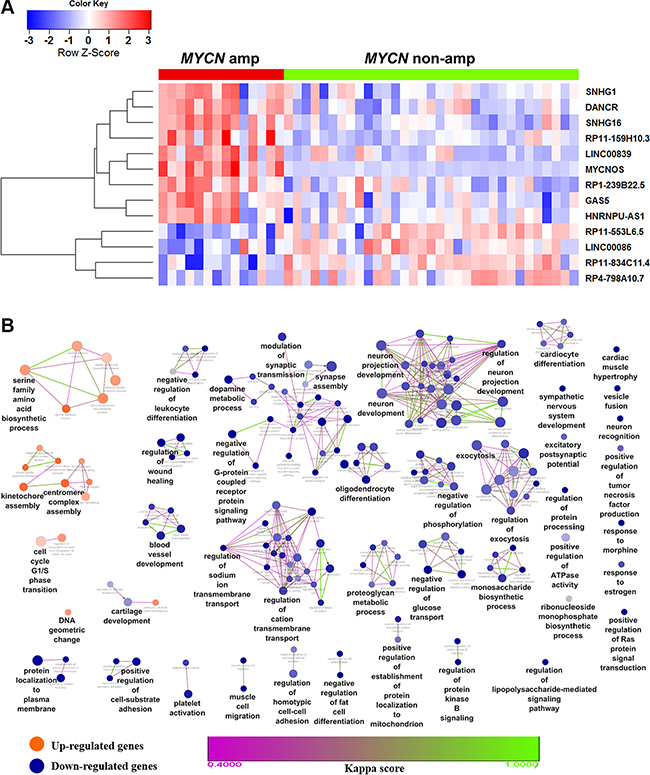
Figure 1: Heatmap of differentially expressed lncRNAs and biological functions of de-regulated coding genes in NB. (A) Heatmap showing the expression values of lncRNAs found differentially expressed in MYCN amplified compared with MYCN non-amplified patient samples. Each column indicates a MYCN amplified (grouped in red bar) or non-amplified (green) patients samples. Each row represents the lncRNA ordered by hierarchical clustering analysis. Expression value of each lncRNA was scaled across samples and represented in a blue-red color scale. (B) Functional enrichment map of differentially expressed coding genes. Nodes represent GO terms and edges represent genes shared between GO terms (kappa score threshold = 0.4). Edge color gradient represents kappa score. Overview GO terms are shown by the highest statistically enriched term in each group formed by fusion of the GO terms sharing similar genes. Clusters with orange color are enriched functions for up-regulated genes while blue clusters are for down-regulated genes. Node color gradient represents the proportion of up (orange) or down-regulated (blue) genes associated with the term. A node (GO term) with equal proportion of up and down-regulated genes is represented in grey color.
Identification and validation of potential lncRNAs in NB
Differential expression analysis of a RNA-sequencing (RNA-seq) dataset with GEO accession GSE62564, a total of 493 patients, out of which, 92 were MYCN amplified and 401 were MYCN non-amplified (five samples were removed with unknown MYCN status) was performed. We identified 90 lncRNAs and 1348 coding genes to be differentially expressed (adjusted P ≤ 0.05 and fold change ≥ 2) in the two subtype conditions (Supplementary Table S2). In the next step, fifty one differentially expressed lncRNAs were retained as they were also annotated in the Gencode v.22. Consistent with the previous studies RNA-seq has identified much more differentially expressed transcripts than microarray [32]. The transcripts shared between these two technologies are shown as a venn diagram (Supplementary Figure S1). Among the 51 lncRNAs from RNA-seq analysis, only 6 were identified in microarray analysis as well and termed as potential lncRNAs in NB (Table 1 and Figure 2A). We further used RT-qPCR to validate their differential expression in various NB cell lines such as MYCN amplified (SK-N-BE(2)-C, SK-N-DZ) and MYCN non-amplified (SK-N-AS, SK-N-F1, SK-N-SH). Interestingly, all the potential lncRNAs except GAS5, were up-regulated in MYCN amplified cell lines when compared with MYCN non-amplified cell line SK-N-F1 (Figure 2B). In the case of GAS5, the expression in MYCN amplified cell lines showed moderate up-regulation when compared with SK-N-F1. However, contradictory results were observed in SK-N-AS and SK-N-SH.
Table 1: Common potential lncRNAs identified by both microarray and RNA-seq differential expression analyses
lncRNA |
RefSeq ID |
Chromosome location |
Microarray |
RNA-seq |
||
|---|---|---|---|---|---|---|
Fold change |
P (corrected) |
Fold change |
P (corrected) |
|||
MYCNOS |
NR_026766 |
Chr 2 |
5.55 |
8.09E-12 |
14.37 |
2.80E-231 |
LINC00839 |
NR_026827 |
Chr 10 |
4.67 |
3.42E-04 |
10.33 |
1.59E-73 |
SNHG1 |
NR_003098 |
Chr 11 |
2.47 |
2.05E-02 |
3.21 |
3.11E-81 |
DANCR |
NR_024031 |
Chr 4 |
2.34 |
1.96E-03 |
2.91 |
3.11E-77 |
GAS5 |
NR_002578 |
Chr 1 |
2.43 |
2.30E-03 |
2.65 |
2.06E-66 |
SNHG16 |
NR_038110 |
Chr17 |
2.23 |
3.02E-04 |
2.64 |
2.77E-65 |
Abbreviation: P = P-value.
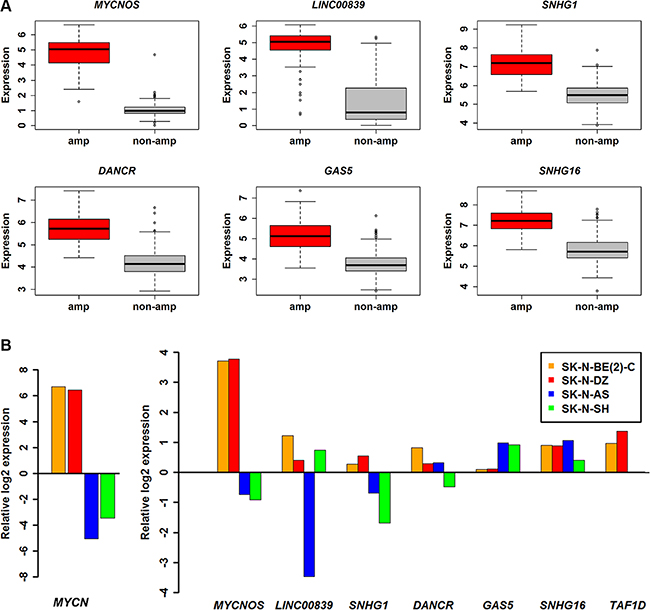
Figure 2: Expression profile of potential lncRNAs. (A) Boxplot showing six lncRNAs expression profiles in MYCN amplified (n = 92) and MYCN non-amplified (n = 401). (B) Bar charts of expression levels measured by RT-qPCR in NB cell lines. The expression levels were normalized to endogenous GAPDH and relative to SK-N-F1 and displayed in log2 scale. MYCN and TAF1D are also shown for comparison.
Co-expression study between differentially expressed lncRNAs and coding genes in MYCN amplified and non-amplified NB
To decipher the transcriptional regulatory relationship, we calculated Spearman’s correlation coefficient (SCC) between the expression values of microarray identified differentially expressed lncRNAs and coding genes in amplified and non-amplified conditions, respectively. Next, each correlation value was transformed into their z-score using Fisher’s Z-transformation (Figure 3). Statistically significant co-expressed pairs were filtered out with z-score threshold ≥ 3.0 in both MYCN amplified and MYCN non-amplified conditions. We found 116 co-expression edges connecting 96 nodes (85 coding genes and 11 lncRNAs) in the MYCN amplified network (Figure 4) whereas 201 co-expression edges connecting 165 nodes (152 coding genes and 13 lncRNAs) in the MYCN non-amplified network (Supplementary Figure S2). In addition, to examine the chance of observing such amounts of connections in both networks, we randomized lncRNA and coding gene expression profiles by interchanging gene expression values within samples for 1,000 times, respectively. Then, we repeated the above co-expression analysis procedure to the randomized expression datasets for 10,000 times, and each time the same threshold cutoff was applied. The result depicted that random connections were less than the original ones with P < 0.0001 in both amplified and non-amplified cases (Supplementary Figure S3). Thus, the significant connections observed between lncRNA and coding genes in the original networks imply that there exist some underlying regulatory mechanisms which coordinate gene expression to execute a particular biological phenomena. Moreover, we filtered our original co-expression dataset, with SCC cut off threshold ≥ 0.8, and observed 39 co-expressed pairs. Among which, SNHG1 (lncRNA) and TAF1D (coding gene) were found to be one of the highly positively correlated pairs with a significant z-score of 5.81 in a MYCN amplified subtype. We further tested this positive correlation in a RNA-seq dataset and also confirmed it by RT- qPCR (Figure 5). In consistence with the above findings, the correlation between SNHG1 and TAF1D was also significant when it was evaluated by mutual rank (MR) in the four NB datasets with GEO accession, GSE13136 (n = 30), GSE12460 (n = 47), GSE16476 (n = 88) and GSE62564 (n = 493) (Table 2).
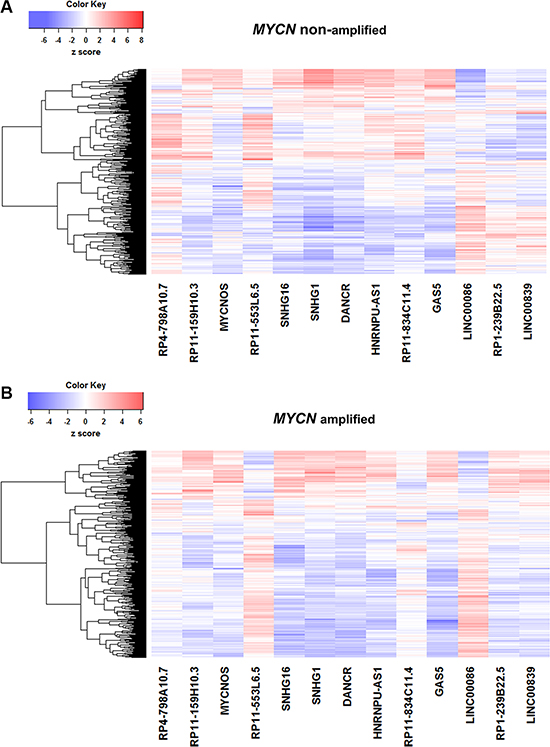
Figure 3: Correlation of lncRNA and coding gene expression profiles. Fisher’s Z-transformed score of Spearman’s correlation coeffiecient (SCC) between lncRNAs (n = 13) and coding genes (n = 591) in (A) MYCN amplified and (B) MYCN non-amplified neuroblastoma tumor samples. Dendrograms of coding genes (rows) are displayed.
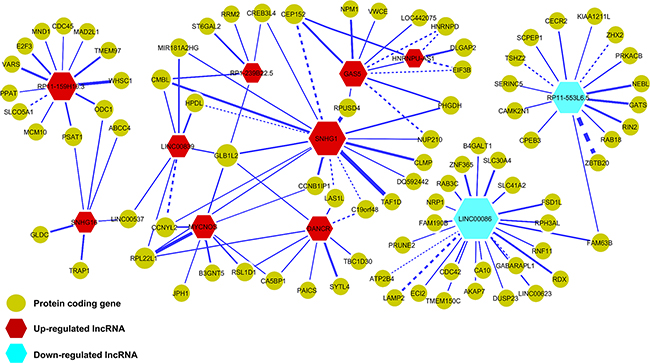
Figure 4: Co-expression network of lncRNAs and protein-coding genes in MYCN amplified neuroblastoma. Nodes represent the lncRNAs and coding genes whereas edges represent the z-scores of expression correlation between lncRNAs and coding genes. Red nodes represent up-regulated lncRNAs and blue ones represent down-regulated lncRNAs. Yellow nodes represent protein-coding genes. Node size and edge width are proportional to the degree of a node and z-score, respectively. Dashed edges indicate that the connected lncRNA and coding gene pairs also appeared in the MYCN non-amplified network.
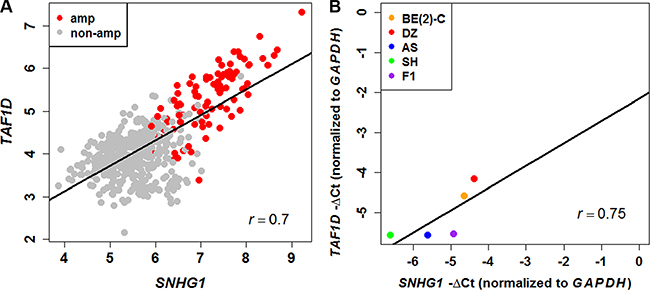
Figure 5: Positive correlation between SNHG1 and TAF1D expression. (A) Scatter plot of SNHG1 and TAF1D expression levels in neuroblastoma patients measured by RNA-seq (n = 493) shows positive correlation. (B) The positive correlation was confirmed in NB cell lines via RT-qPCR (r = 0.75).
Table 2: Correlation and mutual rank between SNHG1 and TAF1D in various microarray and RNA-seq datasets
Datasets |
SCC (MYCN amp) |
SCC (MYCN non-amp) |
MR (MYCN amp) |
MR (MYCN non-amp) |
|---|---|---|---|---|
GSE12460 (n = 47) Microarray |
0.95 |
0.38 |
1 |
846 |
GSE16476 (n = 88) Microarray |
0.81 |
0.46 |
12 |
110 |
GSE62564 (n = 493) RNA-seq |
0.75 |
0.23 |
2 |
1087 |
GSE13136 (n = 30) Microarray |
0.6 |
0.65 |
927 |
94 |
Abbreviations: SCC = Spearman’s correlation coefficient, MR = mutual rank.
SNHG1 is up-regulated in high-risk NB
SNHG1 and its co-expressed coding gene, TAF1D was also found to be significantly up-regulated in the high-risk NB patients (Figure 6A, Supplementary Figure S4A). We next investigated their expression levels in different stages of NB based on the International Neuroblastoma Staging System (INSS) and discovered that, as compared to stages 1–3, SNHG1 showed a significant higher expression in stage 4. In addition, compared to stage 4S, which is also a metastatic stage found in children younger than one year, stage 4 still had significantly higher SNHG1 expression (P = 3.93E-07) (Figure 6B, Supplementary Figure S4B). This implies that highly expressed SNHG1 might play a role in the progression of NB. Moreover, the expression of SNHG1 and MYCN was found to be positively correlated in both amplified and non-amplified subtype conditions, which were further validated by RT-qPCR (Figures 2B, 6C–6D, Supplementary Figure S4C–S4D). This suggests that SNHG1 is not only correlated with MYCN amplification but also with MYCN expression. Moreover, our ChIP-seq data analysis observed MYCN binding sites in the promoter of SNHG1 (Supplementary Figure S5) [33]. Furthermore, previous study has pointed out that lncRNAs possess tissue-specific expression [34]. We examined the RNA-seq expression of SNHG1 across 16 normal human tissues obtained from Illumina Human BodyMap 2.0 project, and found that it also shows tissue-specific expression predominantly in the adrenal gland, a common site for origin of NB (Figure 6E). To address the possibility that expression of SNHG1 might play a role in the patient survival status, we have shown a bar plot of the ordered expression of SNHG1 per survival status of the NB cohort (n = 493) (Figure 6F). This indicates that high expression of SNHG1 is associated with the disease outcome.
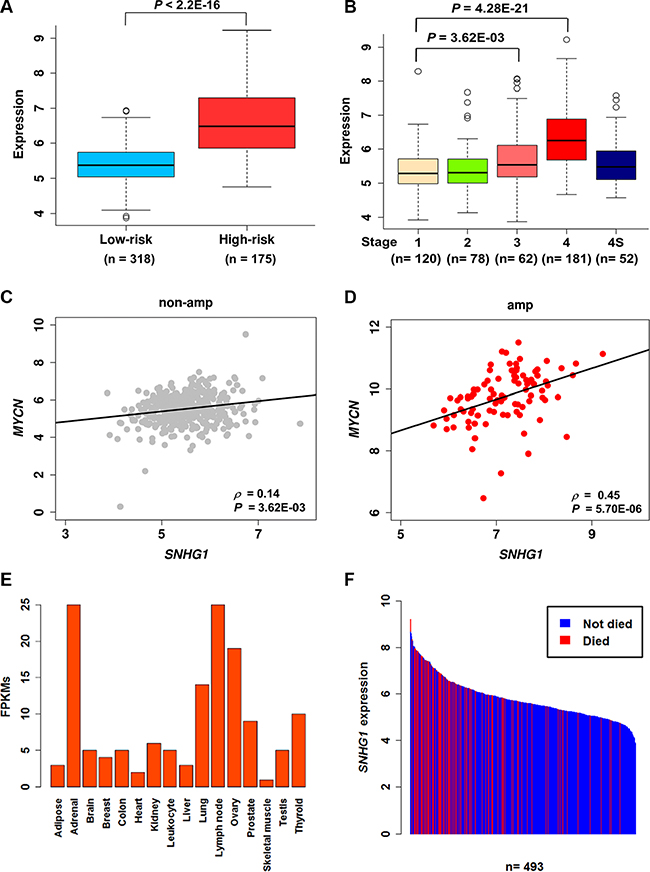
Figure 6: SNHG1 is a prognostic marker for neuroblastoma. (A, B) Boxplots showing the normalized log2RPM expression values of SNHG1 in different risk groups and stages in a NB cohort (n = 493). The P-values presented were determined by Mann-Whitney-Wilcoxon test (A) and Dunn’s multiple comparison test (B). (C, D) Scatter plots showing the correlation between MYCN and SNHG1 in MYCN non-amplified (n = 401) and MYCN amplified patients (n = 92). SCC and the corresponding P-values are displayed. (E) Bar chart showing the ordered expression levels across 16 normal human tissues, based on the RNA-seq data from the Illumina Body Map project. (F) Bar chart showing the ordered expression levels of SNHG1 per survival status of the patient. Here, blue and red bars represent patients did not die and died of disease, respectively.
High expression of SNHG1 is critical to patient survival
To understand the prognostic value of SNHG1, we performed a Kaplan-Meier survival analysis on the expression value of SNHG1 (n = 493). First, we classified patients into low-expression (n = 246) and high-expression (n = 247) groups based on the median expression of SNHG1. We observed that patients in the high-expression group displayed poorer event-free survival (EFS) (P = 9.37E-13) and overall survival (OS) (P = 1.11E-16) than those in the low-expression group (Figure 7A–7B). Second, we ordered SNHG1 expression and randomly selected the top 92 expression values and classified them into a high-expression group, whereas the remaining 401 into a low-expression group. This arrangement is irrespective of the patient’s MYCN or risk status. The high-expression leads to significantly poorer EFS than low expression (P = 3.13E-12) (Figure 7C). We observed consistency in our results based on the analysis performed in an independent cohort (n = 88) (Figure 7D, Supplementary Figure S6A). Importantly, the multivariate Cox regression analysis revealed that high expression of SNHG1 can act as an independent prognostic biomarker predicting EFS in NB (n = 493, hazard ratio = 1.58, P = 2.36E-02) (Table 3).
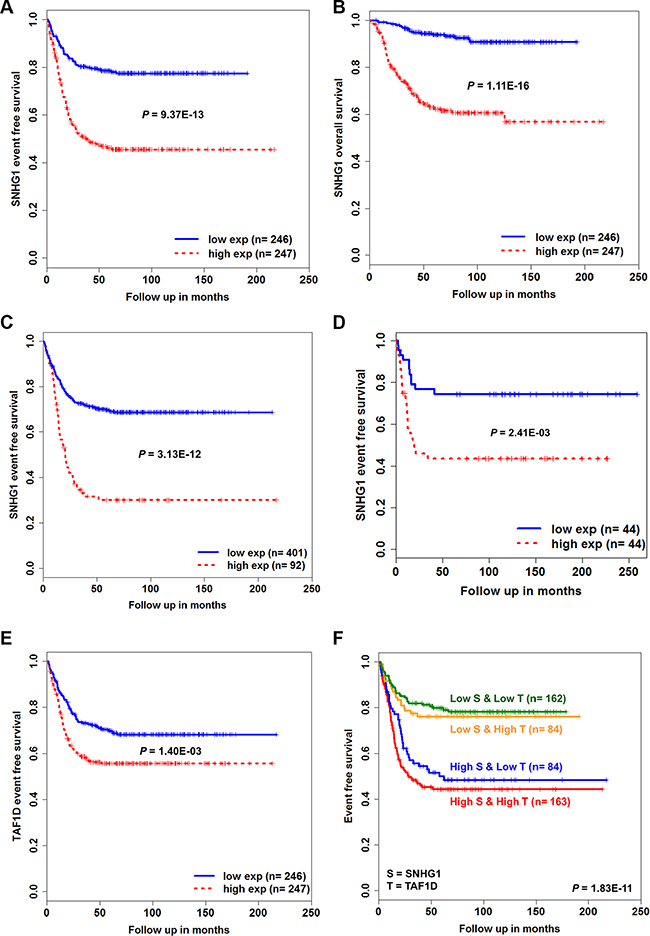
Figure 7: Kaplan-Meier survival analysis for NB patients. The Kaplan-Meier plots for (A) event-free survival (EFS) and (B) overall survival (OS) of low-expression versus high-expression groups based on the median SNHG1 expression level of GSE62564 patients (n = 493). (C) Kaplan-Meier curves of low-expression (n = 401) versus high-expression group (n = 92) based on the ordered expression of SNHG1. (D) Kaplan-Meier plot curve for EFS of GSE16476 patients (n = 88) (E) Kaplan-Meier plot for EFS of low-expression versus high-expression group based on the median expression of TAF1D (n = 493). (F) Kaplan-Meier plot for EFS of combinatorial low and high expression of both SNHG1 and TAF1D (n = 493). The P-values were obtained by log-rank (Mantel-Haenszel) test.
Table 3: Cox regression analysis of SNHG1 with established risk factors in GSE62564 NB cohort (n= 493)
Variables |
EFS |
OS |
||||
|---|---|---|---|---|---|---|
HR |
95% CI |
P |
HR |
95% CI |
P |
|
Univariate model |
||||||
MYCN (amp vs non-amp) |
3.22 |
(2.35–4.41) |
3.19E-13 |
7.80 |
(5.27–11.55) |
< 2e-16 |
Stage (4 vs 1,2,3 & 4S) |
3.88 |
(2.86–5.27) |
< 2e-16 |
8.56 |
(5.38–13.63) |
< 2e-16 |
Age (≥ 18 months vs < 18 months) |
3.33 |
(2.46–4.52) |
9.88E-15 |
8.55 |
(5.24–13.94) |
< 2e-16 |
Age (cont.) |
1.00 |
(1–1) |
5.32E-13 |
1.00 |
(1–1) |
3.22E-15 |
Sex (male vs female) |
0.90 |
(0.69–1.19) |
4.69E-01 |
0.94 |
(0.65–1.36) |
7.46E-01 |
SNHG1 (≥ 5.65 vs < 5.65) |
3.03 |
(2.2–4.18) |
1.09E-11 |
6.54 |
(3.93–10.89) |
5.25E-13 |
SNHG1 (cont.) |
1.76 |
(1.53–2.02) |
1.78E-15 |
2.37 |
(1.99–2.81) |
< 2e-16 |
TAF1D (≥ 4.11 vs < 4.11) |
1.62 |
(1.2–2.17) |
1.55E-03 |
1.89 |
(1.27–2.8) |
1.69E-03 |
TAF1D (cont.) |
1.58 |
(1.32–1.89) |
5.11E-07 |
2.10 |
(1.69–2.62) |
2.50E-11 |
Multivariate model |
||||||
MYCN (amp vs non-amp) |
1.34 |
(0.9–2.01) |
1.51E-01 |
2.80 |
(1.65–4.75) |
1.34E-04 |
SNHG1 (≥ 5.65 vs < 5.65) |
1.58 |
(1.06–2.35) |
2.36E-02 |
2.22 |
(1.21–4.07) |
1.02E-02 |
TAF1D (≥ 4.11 vs < 4.11) |
1.24 |
(0.87–1.77) |
2.36E-01 |
0.93 |
(0.56–1.54) |
7.67E-01 |
Stage (4 vs 1,2,3 & 4S) |
2.10 |
(1.43–3.09) |
1.68E-04 |
2.63 |
(1.51–4.56) |
6.05E-04 |
Age (≥ 18 months vs < 18 months) |
1.97 |
(1.39–2.8) |
1.60E-04 |
3.54 |
(2.04–6.12) |
6.60E-06 |
|
||||||
MYCN (amp vs non-amp) |
1.85 |
(1.08–3.17) |
2.57E-02 |
5.19 |
(2.72–9.93) |
6.34E-07 |
SNHG1 (cont.) |
1.72 |
(1.33–2.24) |
4.35E-05 |
1.95 |
(1.38–2.77) |
1.68E-04 |
TAF1D (cont.) |
0.76 |
(0.58–0.99) |
4.15E-02 |
0.59 |
(0.43–0.83) |
1.89E-03 |
Abbreviations: EFS = event-free survival; OS = overall survival; HR = hazard ratio; CI = confidence interval; P = P-value; cont. = continuous expression.
aIn both univariate and multivariate Cox regression analyses, the gene median expression cutoff was used to divide patients into high and low expression groups.
bP-value in bold typeface indicates statistical significance (P < 0.05).
Further, to examine the prognostic value of SNHG1 co-expressed coding gene TAF1D, we again classified patients into low-expression (n = 246) and high-expression groups (n = 247) based on the median expression of TAF1D. We found that high-expression of TAF1D also leads to poor patient EFS (P = 1.40E-03) (Figure 7E, Supplementary Figure S6B).
Combinatorial expression of SNHG1 and TAF1D affects prognosis
We next sought to understand whether co-expressed SNHG1 and TAF1D have a combinatorial effect on the patient survival outcome. To achieve this, all patients were divided into four groups based on high or low expression status of SNHG1 and TAF1D in each patient: Group 1 (high-expression of both SNHG1 and TAF1D, n = 163), Group 2 (high-expression of SNHG1 and low-expression of TAF1D, n = 84), Group 3 (low-expression of SNHG1 and high- expression of TAF1D, n = 84) and Group 4 (low-expression of both SNHG1 and TAF1D, n = 162). We found EFS in the four groups as 44%, 48%, 76% and 78% at end points, respectively (Figure 7F). In addition, the interaction between the expression values of SNHG1 and TAFID was significant in the multivariate Cox analysis (Table 4). We also evaluated our hypothesis by creating a risk-score formula, which is a linear combination of gene expression values weighted by their univariate Cox regression coefficient for EFS as follows: Risk Score = (0.5648381 * expression of SNHG1) + (0.459009 * expression of TAF1D) for each patient. Next, median risk-score was used as a cutoff to divide patients into low-risk (n = 246) and high-risk group (n = 247). We observed that patients in the high-risk group is significantly associated with poor patient survival (P = 4.70E-10) (Supplementary Figure S7). Interestingly, this interaction effect was found to be independent when assessed in the multivariate Cox analysis (Table 4 and Supplementary Table S3). We further asked whether the hazard rate obtained is constant over time. We performed tests of proportional hazard for each variable and found no violation of the assumption (Table 5 and Supplementary Table S4). Collectively, these results indicate that highly expressed SNHG1 has a dominant influence on the patient prognostication and upon its interaction with TAF1D might worsen patient survival outcome.
Table 4: Multivariate Cox-regression analysis for combinatorial effect of SNHG1&TAF1D with established factors in GSE62564 NB cohort
Variables |
EFS |
||
|---|---|---|---|
HR |
95% CI of HR |
P |
|
MYCN (amp vs non-amp) |
1.26 |
(0.76–2.12) |
3.71E-01 |
Stage (4 vs 1,2,3 & 4S) |
2.16 |
(1.46–3.2) |
1.25E-04 |
Age (≥ 18 months vs < 18 months) |
2.00 |
(1.4–2.85) |
1.28E-04 |
SNHG1 (cont.) |
3.40 |
(1.39–8.33) |
7.51E-03 |
TAF1D (cont.) |
4.71 |
(1.36–16.34) |
1.47E-02 |
SNHG1 (cont.) * TAF1D (cont.) |
0.80 |
(0.67–0.96) |
1.54E-02 |
|
|||
MYCN (amp vs non-amp) |
1.36 |
(0.93–1.97) |
1.10E-01 |
Stage (4 vs 1,2,3 & 4S) |
2.23 |
(1.56–3.2) |
1.22E-05 |
Age ( ≥ 18 months vs < 18 months) |
1.97 |
(1.39–2.81) |
1.67E-04 |
SNHG1 & TAF1D risk score (≥ 5.02 vs < 5.02) |
1.76 |
(1.22–2.52) |
2.25E-03 |
aP-value in bold typeface indicates statistical significance (P < 0.05)
Table 5: Cox proportional hazard analysis of EFS in NB patients
Variable |
rho |
chisq |
P |
|---|---|---|---|
MYCN (amp vs non-amp) |
0.12 |
2.64 |
1.04E-01 |
SNHG1 (≥ 5.65 vs < 5.65) |
0.07 |
0.82 |
3.66E-01 |
TAF1D (≥ 4.11 vs < 4.11) |
–0.12 |
2.60 |
1.07E-01 |
GLOBAL |
NA |
5.46 |
1.41E-01 |
aThe non-significant P-value for each variable and the global test as a whole indicates that the hazard ratio obtained is constant over time.
DISCUSSION
Recently, lncRNAs due to their abundance and functions have gained lots of scientific interests. They are pervasively transcribed and classified into a diverse range of transcripts based on their orientation to neighboring protein-coding genes as antisense, intergenic, overlapping, intronic or processed [18]. Abruptly expressed lncRNAs regulate their target gene by acting in cis or in trans manner [25, 35–38]. Accumulating evidence has linked dysregulated lncRNAs functionally either as oncogenes or tumor suppressors in various cancer progression and development [39]. However, only few reports have discussed their contribution in NB. MYCN oncogene amplification, is still one of the most powerful predictors for the fatal outcome in NB. It exhibits oncogenic activity by altering the expression of its target genes. To date, very little is known about lncRNAs that are altered by MYCN amplification and associated with patient prognostication, which along with MYCN can augment NB pathogenesis. We hypothesized that genes which are significantly differentially expressed are directly or indirectly regulated by MYCN amplification. Thus, we performed differential expression analysis between MYCN amplified and MYCN non-amplified NB. The heatmap of lncRNA expression profile generated by hierarchical clustering showed a clear separation of MYCN amplified samples from the MYCN non-amplified ones.
In contrast to microarray, RNA-seq extensively detect the gene abundance with higher sensitivity. Therefore, we next screened lncRNAs and protein-coding genes based on the RNA-seq differential expression analysis. We identified common transcripts detected by both platforms. Employing this approach, we discovered a potential dysregulated lncRNA set in NB, comprising of six lncRNAs followed by successful RT-qPCR validation of each lncRNA except GAS5. Here, MYCNOS and SNHG1 showed highly positive correlation with MYCN expression.
The lncRNA, mycn opposite strand (MYCNOS) physically interacts with a transcription factor CCTF and epigenetically enhances MYCN expression resulting in loss of differentiation, tumor progression and invasion in NB cells [40]. Small nucleolar RNA host gene 16 (SNHG16) also known as non-coding RNA expressed in aggressive neuroblastoma (ncRAN), is located in chromosome 17q and its high expression is associated with poor outcome of NB patient [41]. Differentiation antagonizing non-protein coding RNA (DANCR) possess stem-cell like properties and critical to patient survival of hepatocellular carcinoma (HCC). Over-expression of DANCR enhances stemness features and tumorigenesis in HCC cells [42]. Small nucleolar RNA host gene 1 (SNHG1) is up-regulated in lung cancer, breast cancer and HCC [43–45]. High expression of SNHG1 is associated with poor prognosis of HCC patients [45]. However, the functional characterization and clinical implication of LINC00839, DANCR and GAS5 in NB are still unknown. Future research on these candidate lncRNAs will promote better understanding of NB etiology.
Typically lncRNAs are highly correlated with their neighboring protein-coding genes [34]. Studies have pointed out that regulatory mechanism such as copy number variation, DNA methylation and transcription factors can induce the lncRNAs and protein-coding genes to be co-expressed together and amplify the cancer pathogenesis [46]. Therefore we applied co-expression analysis study on lncRNAs and coding genes in NB. To identify statistically significant co-expressed pairs in both amplified and non-amplified conditions, we converted each correlation value into z-score. This procedure has also been applied in previous studies [47]. By applying a significant threshold we identified SNHG1 and TAF1D as one of the highly co-expressed pairs which were further validated by RT-qPCR.
SNHG1 is located in 11q12.3 region of the chromosome whose deletion is linked with poor prognosis in high risk NB tumors [48]. To investigate the prognostic impact of SNHG1, we performed survival analysis by integrating SNHG1 expression and clinical outcome of NB patients in the RNA-seq datasets. A clear separation was observed in the survival curves between patients who were divided based on either SNHG1 median expression cutoff or upon top 92 and remaining 401 ordered expression values. In addition, the prognostic value was also reproduced in an independent cohort of NB patients in microarray datasets. Moreover, our multivariate Cox-regression result revealed that, by incorporating established clinical markers such as MYCN amplification, stage, and age into analysis, SNHG1 high expression still displayed a significant poor hazard rate for both overall and event-free survivals. Collectively these data indicated that highly expressed SNHG1 can act as a prognostic biomarker in predicting clinical outcome of NB patients. Additionally, we also showed that correlated SNHG1 and TAF1D expression values might have an interaction effect on the patient survival outcome, which was revealed by significant P-values of their interaction and risk-score in the multivariate Cox analysis. However, this effect needs to be further validated by experiments. Using risk score model to investigate multiple gene effect on patient outcome has also been applied by several studies [49, 50].
SNHG1 is a host to 8 small nucleolar RNAs (snoRNAs), namely SNORD22 and SNORD25-31, residing within its introns [51]. Studies have shown emergence of snoRNAs as potential regulators in cancer development [52]. Therefore, it is important to evaluate whether the prognostic value and prospective biological functions of SNHG1 are independent of snoRNAs. Here, we examined their expression levels in the RNA-seq data and found the snoRNA expression to be substantially low compared with their host gene (Supplementary Figure S8). However, this hypothesis needs further experimental support. In addition, these snoRNAs did not pass our cutoff threshold for differential expression and thus were filtered out from the analysis.
Taken together, our integrative analysis reveals that SNHG1 could be a prognostic biomarker that independently predicts poor clinical outcome for EFS in NB patients. Additionally, SNHG1 is driven by N-MYC and regulated by MYCN amplification. SNHG1 expression is positively correlated with MYCN expression in both MYCN amplified and MYCN non-amplified NB tumors. These empirical evidences open up new research opportunities to elucidate the functional characterization of this novel lncRNA marker, which will improve our knowledge in deeper understanding of its functional role in the NB etiology and its potential as therapeutic target for NB intervention.
MATERIALS AND METHODS
Preprocessing of the microarray dataset and detection of differentially expressed lncRNAs and coding genes
The raw CEL files were downloaded from the NCBI GEO database. The samples with unknown MYCN status were removed. The normalized and log2 transformed expression value of probes were extracted using Robust Multi-array Average (RMA) normalization algorithm. Next, the limma R package [53] was applied to identify differentially expressed coding genes and lncRNAs in MYCN amplified compared with MYCN non-amplified subtype conditions. For the case of multiple probes representing the same gene, their averaged expression were taken for further analyses.
Functional enrichment analysis
ClueGO [54], a Cytoscape plug-in was used for the interpretation of functions enriched for the differential coding genes. Statistical parameters such as right-sided hypergeometric test, P < 0.05 with Benjamini-Hochberg correction, GO levels between 6 to 14 and kappa score threshold of 0.4, were applied to identify the gene ontology (GO) terms enriched for the up-regulated and down-regulated genes.
Identification of differentially expressed lncRNAs and coding genes in the RNA-seq dataset
The log2RPM normalized RNA-seq dataset and patients clinical data with GEO accession GSE62564 were downloaded. The samples with unknown MYCN status were removed. To avoid negative log2 expression values, the intensities were converted back to their original raw expression and increased with one and then log2 transformed. The coding-gene and lncRNA expression data were extracted based on RefSeq ID annotations, which identified 34,255 and 6,260 coding genes and lncRNAs transcripts. Next, limma package with the same threshold as described earlier was applied for the detection of differentially expressed transcripts. For the case of gene with transcript variant, high standard deviation transcipt were taken for further analyses.
Co-expression analysis and Fisher’s Z-transformation
We calculated Spearman’s correlation coefficients (SCC) between the expression values of differentially expressed coding genes and lncRNAs. Next, Fisher transformation was applied to each of the calculated correlation as follows,
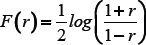
where F(r) is the Fisher transformed score of r, the SCC of lncRNA and coding gene pair. Further, z-score of the Fisher transformed SCC is calculated by the following expression,
where Z is the z-score of r and N is the sample size. Larger z-score implies the correlation is statistically significant. The threshold for z-score was set to ≥ 3.0 and co-expression network was constructed in Cytoscape 3.3.0.
Mutual rank calculation
Mutual rank (MR) is a measure of the geometric average between the correlation rank of gene A to gene B and gene B to gene A [55]. Here, the MYCN amplified and MYCN non-amplified samples were separated for each dataset. Next, SCC values were calculated between all the lncRNAs and coding genes present in each dataset. Further, the absolute highest correlation was ranked with smallest rank values. The MR was calculated by the following expression,

Cell line culture
Human neuroblastoma cell lines SK-N-DZ, SK-N-SH, and SK-N-BE(2)-C were purchased from American Type Tissue Collection (ATCC). SK-N-AS and SK-N-F1 neuroblastoma cell lines were kindly provided by Dr. Yung-Feng Liao (Institute of Cellular and Organismic Biology, Academia Sinica). All cell lines were cultured in Dulbecco’s Modified Eagle’s Medium (DMEM) supplemented with 10% fetal bovine serum (FBS) (Biological Industries). Cells were grown at 37°C under 5% CO2 atmosphere.
Cellular RNA extraction and reverse transcription
Neuroblastoma cells were homogenized in TRIzol reagent (Invitrogen) and cellular RNA was extracted using Direct-zolTM RNA MiniPrep kit (Zymo Research) following the manufacturer’s protocol. RNA concentration was determined by NanoDrop ND-1000 (NanoDrop Technologies) and RNA quality was checked by 1% agarose gel electrophoresis. One microgram total RNA of each sample along with oligo(dT)18 and random hexamer primer was reverse transcribed to cDNA in a final volume of 20 μl using RevertAidTM H Minus First Strand cDNA Synthesis Kit (Thermo Scientific). The synthesized cDNA was stored in −80°C until use.
Real-time quantitative PCR
The cDNA of each cell line was amplified using iQTM SYBR Green Supermix (Bio-rad) and CFX96 Real-Time PCR System (Bio-rad). Each lncRNA in each cell line was repeated in triplicates. The average expression (ΔCt) of each lncRNA was normalized to average GAPDH expression. The relative expression (ΔΔCt) was calibrated to ΔCt of SK-N-F1. The primer sequence for each lncRNA used in the study is listed in the Supplementary Table S5.
Survival analysis
The Kaplan-Meier event-free survival (EFS) and overall survival (OS) analysis was performed for the two groups of patients, classified on the basis of median gene expression value. The significance of the survival curve was assessed using the log-rank (Mantel-Haenszel) test. Next, the risk association of the lncRNA expression among several known risk factors was determined using univariate and multivariate Cox regression analyses. Proportional hazard assumption for the variable was computed by cox.zph function embedded in the R survival package.
ACKNOWLEDGMENTS
We thank the Technology Commons at National Taiwan University for instrumental support. We are grateful to Dr. Yung-Feng Liao for kindly providing the neuroblastoma cell lines. We also thank Golam Haider, Girish Mokkapati and Dhani Ram Mahato for proofreading the manuscript. Divya Sahu thanks the support of Taiwan International Graduate Program, Institute of Information Science, Academia Sinica, Taipei, Taiwan.
CONFLICTS OF INTEREST
The authors declare no conflicts of interest.
GRANT SUPPORT
This work was supported by the Ministry of Science and Technology (NSC 102-2628-B-002-041-MY3, MOST 103-2320-B-010-031-MY3 and MOST 104-2628-E-010-001-MY3), National Health Research Institutes (NHRI-EX105-10530PI) and 2016 Translational Medicine Piloted Model Cooperation Projects of National Taiwan University Medical Campus and College of Life Science (104F021 and 105R3701).
Authors’ contributions
H.-F. J and H.-C. H. conceived, designed, and supervised the study. D. S., C.-L. H. and C.-C. L. performed bioinformatics analyses. D. S. and T.-W. Y. performed biological validation. W.-M. H. and S.-Y. H. helped data analysis and biological interpretation. D. S., C.-C. L., H.-F. J. and H.-C. H. interpreted the results and wrote the manuscript. All authors read and approved the final manuscript.
REFERENCES
1. Maris JM, Hogarty MD, Bagatell R, Cohn SL. Neuroblastoma. Lancet. 2007; 369:2106–20.
2. Brodeur GM. Neuroblastoma: biological insights into a clinical enigma. Nat Rev Cancer. 2003; 3:203–16.
3. Maris JM. Recent Advances in Neuroblastoma. N Engl J Med. 2010; 362:2202–11.
4. Matthay KK, Villablanca JG, Seeger RC, Stram DO, Harris RE, Ramsay NK, Swift P, Shimada H, Black CT, Brodeur GM, Gerbing RB, Reynolds CP. Treatment of High-Risk Neuroblastoma with Intensive Chemotherapy, Radiotherapy, Autologous Bone Marrow Transplantation, and 13-cis-Retinoic Acid. N Engl J Med. 1999; 341:1165–73.
5. Cohn SL, Pearson ADJ, London WB, Monclair T, Ambros PF, Brodeur GM, Faldum A, Hero B, Iehara T, Machin D, Mosseri V, Simon T, Garaventa A, et al. The International Neuroblastoma Risk Group (INRG) Classification System: An INRG Task Force Report. J Clin Oncol. 2009; 27:289–97.
6. Pugh TJ, Morozova O, Attiyeh EF, Asgharzadeh S, Wei JS, Auclair D, Carter SL, Cibulskis K, Hanna M, Kiezun A, Kim J, Lawrence MS, Lichenstein L, et al. The genetic landscape of high-risk neuroblastoma. Nat Genet. 2013; 45:279–84.
7. Cheung NKV, Dyer MA. Neuroblastoma: developmental biology, cancer genomics and immunotherapy. Nat Rev Cancer. 2013; 13:397–411.
8. Brodeur GM, Seeger RC, Schwab M, Varmus HE, Bishop JM. Amplification of N-myc in untreated human neuroblastomas correlates with advanced disease stage. Science. 1984; 224:1121–4.
9. Seeger RC, Brodeur GM, Sather H, Dalton A, Siegel SE, Wong KY, Hammond D. Association of multiple copies of the N-myc oncogene with rapid progression of neuroblastomas. N Engl J Med. 1985; 313:1111–6.
10. Huang M, Weiss WA. Neuroblastoma and MYCN. Cold Spring Harb Perspect Med. 2013; 3:a014415.
11. Mosse YP, Laudenslager M, Longo L, Cole KA, Wood A, Attiyeh EF, Laquaglia MJ, Sennett R, Lynch JE, Perri P, Laureys G, Speleman F, Kim C, et al. Identification of ALK as a major familial neuroblastoma predisposition gene. Nature. 2008; 455:930–5.
12. Janoueix-Lerosey I, Lequin D, Brugieres L, Ribeiro A, de Pontual L, Combaret V, Raynal V, Puisieux A, Schleiermacher G, Pierron G, Valteau-Couanet D, Frebourg T, Michon J, et al. Somatic and germline activating mutations of the ALK kinase receptor in neuroblastoma. Nature. 2008; 455:967–70.
13. George RE, Sanda T, Hanna M, Frohling S, Luther WII, Zhang J, Ahn Y, Zhou W, London WB, McGrady P, Xue L, Zozulya S, Gregor VE, et al. Activating mutations in ALK provide a therapeutic target in neuroblastoma. Nature. 2008; 455:975–8.
14. Chen Y, Takita J, Choi YL, Kato M, Ohira M, Sanada M, Wang L, Soda M, Kikuchi A, Igarashi T, Nakagawara A, Hayashi Y, Mano H, et al. Oncogenic mutations of ALK kinase in neuroblastoma. Nature. 2008; 455:971–4.
15. Yu AL, Gilman AL, Ozkaynak MF, London WB, Kreissman SG, Chen HX, Smith M, Anderson B, Villablanca JG, Matthay KK, Shimada H, Grupp SA, Seeger R, et al. Anti-GD2 antibody with GM-CSF, interleukin-2, and isotretinoin for neuroblastoma. N Engl J Med. 2010; 363:1324–34.
16. Mattick JS, Makunin IV. Non-coding RNA. Hum Mol Genet. 2006; 15 Spec No 1:R17–29.
17. Esteller M. Non-coding RNAs in human disease. Nat Rev Genet. 2011; 12:861–74.
18. Derrien T, Johnson R, Bussotti G, Tanzer A, Djebali S, Tilgner H, Guernec G, Martin D, Merkel A, Knowles DG, Lagarde J, Veeravalli L, Ruan X, et al. The GENCODE v7 catalog of human long noncoding RNAs: analysis of their gene structure, evolution, and expression. Genome Res. 2012; 22:1775–89.
19. Mercer TR, Dinger ME, Mattick JS. Long non-coding RNAs: insights into functions. Nat Rev Genet. 2009; 10:155–59.
20. Iyer MK, Niknafs YS, Malik R, Singhal U, Sahu A, Hosono Y, Barrette TR, Prensner JR, Evans JR, Zhao S, Poliakov A, Cao X, Dhanasekaran SM, et al. The landscape of long noncoding RNAs in the human transcriptome. Nat Genet. 2015; 47:199–208.
21. Kotake Y, Nakagawa T, Kitagawa K, Suzuki S, Liu N, Kitagawa M, Xiong Y. Long non-coding RNA ANRIL is required for the PRC2 recruitment to and silencing of p15INK4B tumor suppressor gene. Oncogene. 2011; 30:1956–62.
22. Gong C, Li Z, Ramanujan K, Clay I, Zhang Y, Lemire-Brachat S, Glass DJ. A long non-coding RNA, LncMyoD, regulates skeletal muscle differentiation by blocking IMP2-mediated mRNA translation. Dev Cell. 2015; 34:181–91.
23. Zhao J, Sun BK, Erwin JA, Song JJ, Lee JT. Polycomb proteins targeted by a short repeat RNA to the mouse X chromosome. Science. 2008; 322:750–6.
24. Wang Kevin C, Chang Howard Y. Molecular Mechanisms of Long Noncoding RNAs. Mol Cell. 43:904–14.
25. Gupta RA, Shah N, Wang KC, Kim J, Horlings HM, Wong DJ, Tsai MC, Hung T, Argani P, Rinn JL, Wang Y, Brzoska P, Kong B, et al. Long non-coding RNA HOTAIR reprograms chromatin state to promote cancer metastasis. Nature. 2010; 464:1071–6.
26. Gutschner T, Hammerle M, Eissmann M, Hsu J, Kim Y, Hung G, Revenko A, Arun G, Stentrup M, Gross M, Zornig M, MacLeod AR, Spector DL, et al. The noncoding RNA MALAT1 is a critical regulator of the metastasis phenotype of lung cancer cells. Cancer Res. 2013; 73:1180–9.
27. Pandey GK, Kanduri C. Long noncoding RNAs and neuroblastoma. Oncotarget. 2015; 6:18265–75. doi: 10.18632/oncotarget.4251.
28. Pandey GK, Mitra S, Subhash S, Hertwig F, Kanduri M, Mishra K, Fransson S, Ganeshram A, Mondal T, Bandaru S, Ostensson M, Akyurek LM, Abrahamsson J, et al. The risk-associated long noncoding RNA NBAT-1 controls neuroblastoma progression by regulating cell proliferation and neuronal differentiation. Cancer Cell. 2014; 26:722–37.
29. Russell MR, Penikis A, Oldridge DA, Alvarez-Dominguez JR, McDaniel L, Diamond M, Padovan O, Raman P, Li Y, Wei JS, Zhang S, Gnanchandran J, Seeger R, et al. CASC15-S Is a Tumor Suppressor lncRNA at the 6p22 Neuroblastoma Susceptibility Locus. Cancer Res. 2015; 75:3155–66.
30. Atmadibrata B, Liu PY, Sokolowski N, Zhang L, Wong M, Tee AE, Marshall GM, Liu T. The Novel Long Noncoding RNA linc00467 Promotes Cell Survival but Is Down-Regulated by N-Myc. PloS One. 2014; 9:e88112.
31. Meyer N, Penn LZ. Reflecting on 25 years with MYC. Nat Rev Cancer. 2008; 8:976–90.
32. Zhao S, Fung-Leung WP, Bittner A, Ngo K, Liu X. Comparison of RNA-Seq and microarray in transcriptome profiling of activated T cells. PloS One. 2014; 9:e78644.
33. Hsu CL, Chang HY, Chang JY, Hsu WM, Huang HC, Juan HF. Unveiling MYCN Regulatory Networks in Neuroblastoma via Integrative Analysis of Heterogeneous Genomics Data. Oncotarget. 2016; 7:36293–36310. doi: 10.18632/oncotarget.9202.
34. Cabili MN, Trapnell C, Goff L, Koziol M, Tazon-Vega B, Regev A, Rinn JL. Integrative annotation of human large intergenic noncoding RNAs reveals global properties and specific subclasses. Genes Dev. 2011; 25:1915–27.
35. Martianov I, Ramadass A, Serra Barros A, Chow N, Akoulitchev A. Repression of the human dihydrofolate reductase gene by a non-coding interfering transcript. Nature. 2007; 445:666–70.
36. Brown CJ, Ballabio A, Rupert JL, Lafreniere RG, Grompe M, Tonlorenzi R, Willard HF. A gene from the region of the human X inactivation centre is expressed exclusively from the inactive X chromosome. Nature. 1991; 349:38–44.
37. Nagano T, Mitchell JA, Sanz LA, Pauler FM, Ferguson-Smith AC, Feil R, Fraser P. The Air noncoding RNA epigenetically silences transcription by targeting G9a to chromatin. Science. 2008; 322:1717–20.
38. Rinn JL, Kertesz M, Wang JK, Squazzo SL, Xu X, Brugmann SA, Goodnough LH, Helms JA, Farnham PJ, Segal E, Chang HY. Functional demarcation of active and silent chromatin domains in human HOX loci by noncoding RNAs. Cell. 2007; 129:1311–23.
39. Prensner JR, Chinnaiyan AM. The emergence of lncRNAs in cancer biology. Cancer Discov. 2011; 1:391–407.
40. Zhao X, Li D, Pu J, Mei H, Yang D, Xiang X, Qu H, Huang K, Zheng L, Tong Q. CTCF cooperates with noncoding RNA MYCNOS to promote neuroblastoma progression through facilitating MYCN expression. Oncogene. 2015; 35:3565–76.
41. Yu M, Ohira M, Li Y, Niizuma H, Oo ML, Zhu Y, Ozaki T, Isogai E, Nakamura Y, Koda T, Oba S, Yu B, Nakagawara A. High expression of ncRAN, a novel non-coding RNA mapped to chromosome 17q25.1, is associated with poor prognosis in neuroblastoma. Int J Oncol. 2009; 34:931–8.
42. Yuan SX, Wang J, Yang F, Tao QF, Zhang J, Wang LL, Yang Y, Liu H, Wang ZG, Xu QG, Fan J, Liu L, Sun SH, et al. Long noncoding RNA DANCR increases stemness features of hepatocellular carcinoma by derepression of CTNNB1. Hepatology. 2016; 63:499–511.
43. You J, Fang N, Gu J, Zhang Y, Li X, Zu L, Zhou Q. Noncoding RNA small nucleolar RNA host gene 1 promote cell proliferation in nonsmall cell lung cancer. Indian J Cancer. 2014; 51:e99–e102.
44. Yu F, Bracken CP, Pillman KA, Lawrence DM, Goodall GJ, Callen DF, Neilsen PM. p53 Represses the Oncogenic Sno-MiR-28 Derived from a SnoRNA. PloS One. 2015; 10:e0129190.
45. Zhang M, Wang W, Li T, Yu X, Zhu Y, Ding F, Li D, Yang T. Long noncoding RNA SNHG1 predicts a poor prognosis and promotes hepatocellular carcinoma tumorigenesis. Biomed Pharmacother. 2016; 80:73–9.
46. Wang P, Ning S, Zhang Y, Li R, Ye J, Zhao Z, Zhi H, Wang T, Guo Z, Li X. Identification of lncRNA-associated competing triplets reveals global patterns and prognostic markers for cancer. Nucleic Acids Res. 2015; 43:3478–89.
47. Kuo WP, Mendez E, Chen C, Whipple ME, Farell G, Agoff N, Park PJ. Functional Relationships Between Gene Pairs in Oral Squamous Cell Carcinoma. AMIA Annu Symp Proc. 2003; 2003:371–75.
48. Carén H, Kryh H, Nethander M, Sjöberg R-M, Träger C, Nilsson S, Abrahamsson J, Kogner P, Martinsson T. High-risk neuroblastoma tumors with 11q-deletion display a poor prognostic, chromosome instability phenotype with later onset. Proc Natl Acad Sci USA. 2010; 107:4323–28.
49. Garzon R, Volinia S, Papaioannou D, Nicolet D, Kohlschmidt J, Yan PS, Mrozek K, Bucci D, Carroll AJ, Baer MR, Wetzler M, Carter TH, Powell BL, et al. Expression and prognostic impact of lncRNAs in acute myeloid leukemia. Proc Natl Acad Sci USA. 2014; 111:18679–84.
50. Hu Y, Chen HY, Yu CY, Xu J, Wang JL, Qian J, Zhang X, Fang JY. A long non-coding RNA signature to improve prognosis prediction of colorectal cancer. Oncotarget. 2014; 5:2230–42. doi: 10.18632/oncotarget.1895.
51. Tycowski KT, Shu MD, Steitz JA. A mammalian gene with introns instead of exons generating stable RNA products. Nature. 1996; 379:464–6.
52. Williams GT, Farzaneh F. Are snoRNAs and snoRNA host genes new players in cancer? Nat Rev Cancer. 2012; 12:84–88.
53. Ritchie ME, Phipson B, Wu D, Hu Y, Law CW, Shi W, Smyth GK. limma powers differential expression analyses for RNA-sequencing and microarray studies. Nucleic Acids Res. 2015; 43:e47.
54. Bindea G, Mlecnik B, Hackl H, Charoentong P, Tosolini M, Kirilovsky A, Fridman WH, Pagès F, Trajanoski Z, Galon J. ClueGO: a Cytoscape plug-in to decipher functionally grouped gene ontology and pathway annotation networks. Bioinformatics. 2009; 25:1091–93.
55. Obayashi T, Kinoshita K. Rank of Correlation Coefficient as a Comparable Measure for Biological Significance of Gene Coexpression. DNA Res. 2009; 16:249–60.