
INTRODUCTION
Breast cancer (BC) is one of the most common malignancies and a leading cause of cancer-related mortality among women worldwide [1, 2]. Tumor size, lymph node (LN) metastasis, and hormone receptor status are the most preferred prognosticators applied by oncologists in the management of BC patients. However, as patients with histologically similar tumors at the same disease stage may have different clinical outcomes, it remains difficult to predict patient survival. Personalized treatment regimens require a precise prediction of individual disease outcome. Accordingly, numerous histopathological features and markers have been introduced [3].
DNA cytometric techniques, such as flow cytometry (FCM) and image DNA cytometry, are generally used in tumor cytology [4]. Clinically, fine needle aspiration (FNA) is listed among the routine cytometric analyses for suspicious breast masses. FNA biopsy is a quick technique for pre-operative diagnosis of BC and the fresh tissue samples obtained could be used for further DNA cytometric analyses [5].
As DNA cytometry is widely used in tumor pathology, DNA ploidy emerges as a prominent marker to reflect tumor proliferation. DNA ploidy is the set number of cell chromosomes. Due to the fact that DNA ploidy reflects the cell cycle of a tumor, it is supposed to reflect the biological behavior of the malignancy. DNA ploidy status is mostly defined as follows: the determination of DNA ploidy refers to DNA index (DI), which represents the ratio of the DNA content of G0/1 tumor cells to the reference G0/1 diploid peak (2n) for each specimen as shown in flow cytometry plots (Figure 1). DI = 1 suggests a near diploid specimen, which means only one peak of G0/1 cells in the near diploid region (2n) with few G2M tumor cells in the tetraploid region (4n). On the other hand, if an additional peak with a different DI is present, the tumor is considered aneuploid. Tumors presenting hypo-diploidy (DI < 0.95) and hyper-diploidy (1.04 ≤ DI < 1.44 ) are classified as aneuploidy BCs [6].
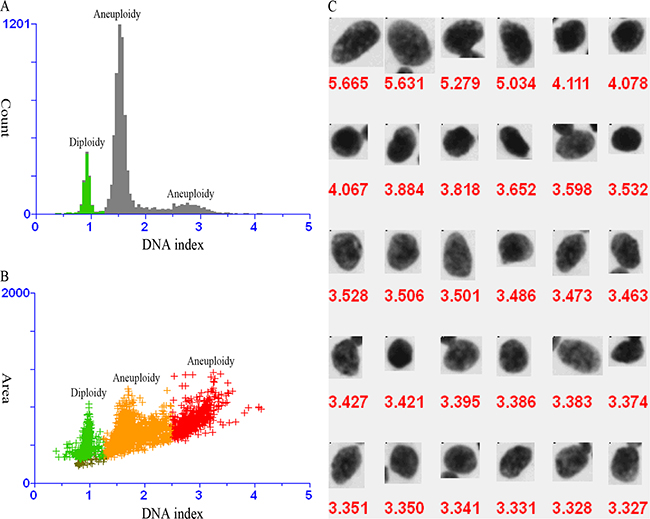
Figure 1: DNA analysis of fine needle aspirates of a suspicious lump. A. Three separate G0-1 peaks in DNA content histogram (green for diploidy, and grey for aneuploidy). B. One diploid peak (green) and two aneuploid peaks (orange and red) in DNA content scatter plot. C. Aneuploid cells with DNA index value > 2.5.
Various studies [7-35] have suggested that DNA ploidy might be associated with recurrence risk and mortality in BC, but their results were mixed, giving controversial views on cancer treatment. Herein we carried out a meta-analysis on the association between DNA ploidy status and BC characteristics and survival.
RESULTS
Study selection
A total of 49 studies were retrieved for full review during primary search according to the inclusion criteria, and 29 studies [7-35] were finally selected (Figure 2). The characteristics of each study were listed in Table 1.
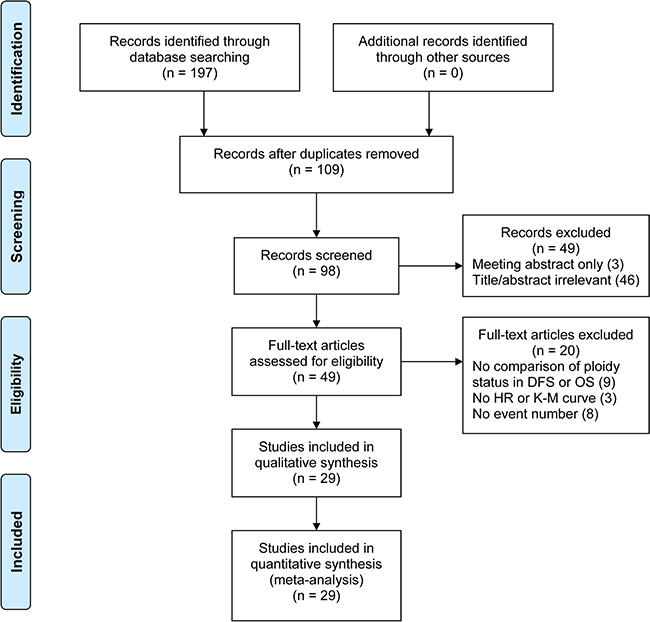
Figure 2: PRISMA flow diagram. DFS, disease-free survival; OS, overall survival; HR, hazard ratio; K-M, Kaplan-Meier.
Table 1: Characteristics of studies included in this meta-analysis
Authors |
Year |
No. of patients |
Age (year) |
TNM stage |
Follow-up month# |
Mastectomy |
BCT |
HT |
CT |
HT & CT |
NOS |
|---|---|---|---|---|---|---|---|---|---|---|---|
Kallioniemi et al. |
1987 |
308 |
NR |
I-III |
96** |
100 |
53 |
NR |
48 |
NR |
7 |
Clark et al. |
1989 |
395 |
> 50 |
N0 |
59 |
NR |
NR |
NR |
NR |
NR |
8 |
Muss et al. |
1989 |
101 |
59 (27-83) |
N0 |
51 |
NR |
NR |
0 |
0 |
0 |
7 |
Toikkanen et al. |
1989 |
351 |
56 (30-89) |
I-IV |
324 (264-504) |
203 |
NR |
NR |
NR |
NR |
7 |
Sigurdsson et al. |
1990 |
367 |
62 (21-96) |
N0 |
48 (24-70) |
323 |
44 |
83 |
9 |
10 |
7 |
Winchester et al. |
1990 |
257 |
NR |
N0 |
80 (1-148) |
NR |
NR |
NR |
NR |
NR |
8 |
Beerman et al. |
1990 |
690 |
57 ± 14 |
I-III |
84 |
NR |
NR |
NR |
NR |
NR |
7 |
Keyhani-Rofagha et al. |
1990 |
165 |
58 (27-81) |
N0 |
103; 97* |
165 |
NR |
NR |
NR |
NR |
7 |
Merkel et al. |
1993 |
326 |
NR |
N0 |
76; 78 ± 2* |
NR |
NR |
0 |
0 |
0 |
7 |
Wenger et al. |
1993 |
127000 |
NR |
NR |
26 |
NR |
NR |
NR |
NR |
NR |
8 |
Balslev et al. |
1994 |
421 |
NR |
N0 |
81 (19-160) |
404 |
15 |
0 |
0 |
0 |
8 |
Bergers et al. |
1996 |
932 |
NR |
T1-3 |
NR |
NR |
NR |
NR |
NR |
NR |
7 |
Desserich et al. |
1997 |
57 |
44 (29-55) |
N0 |
73.2 (9.6-209) |
33 |
NR |
2 |
13 |
NR |
7 |
Bergers et al. |
1997 |
1301 |
60 (27-93) |
Operable |
84** |
NR |
NR |
NR |
NR |
NR |
7 |
Harbeck et al. |
1999 |
125 |
56 (35-82) |
N0 |
72 (47-108) |
83 |
42 |
0 |
0 |
0 |
7 |
Pinto et al. |
1999 |
308 |
58.5 (23-88) |
T1-3N0-1 |
39.6 (3-84) |
208 |
28 |
127 |
132 |
NR |
8 |
Chassevent et al. |
2001 |
633 |
55.3(24-75) |
T1-2N0-1M0 |
69 |
125 |
508 |
163 |
139 |
NR |
7 |
Pinto et al. |
2001 |
306 |
58.5 (23-88) |
I-II |
39.6 (3-84) |
278 |
28 |
46 |
84 |
43 |
7 |
Prasad et al |
2001 |
332 |
63 (29-92) |
I-IV |
120 (84-144) |
279 |
NR |
NR |
NR |
NR |
7 |
Tsutsui et al. |
2001 |
653 |
54.4 (27-93) |
N0 |
46* |
437 |
216 |
219 |
209 |
211 |
7 |
Pinto et al. |
2003 |
392 |
63 (24-91) |
IIB-IV |
81 (3-117) |
172 |
3 |
113 |
174 |
NR |
8 |
Tsutsui et al. |
2003 |
998 |
53.1 (25-85) |
NR |
42 |
755 |
243 |
344 |
348 |
306 |
7 |
Michels et al. |
2004 |
1984 |
58 (23-93) |
NR |
54 (1-140) |
661 |
1129 |
NR |
NR |
NR |
7 |
Kute et al. |
2004 |
556 |
61.7 ± 13.6 |
N0 |
93.6 (1-140.4) |
NR |
NR |
191 |
161 |
NR |
7 |
Zabotto et al. |
2005 |
271 |
56 (31-87) |
I-II |
64 (5-95) |
88 |
183 |
87 |
51 |
85 |
8 |
Pinto et al. |
2006 |
135 |
62 (32-83) |
T1-2N0 |
58.5 (6-132) |
81 |
54 |
87 |
25 |
NR |
7 |
Gazic et al. |
2007 |
770 |
60 (22-94) |
I-IV |
90 |
475 |
215 |
310 |
314 |
131 |
7 |
Pinto et al. |
2013 |
393 |
59 (23-88) |
I-IIIA |
134 (50-240) |
275 |
118 |
121 |
113 |
52 |
8 |
Pinto et al. |
2015 |
684 |
60 (23-89) |
I-IV |
134.5 (56-272) |
445 |
239 |
233 |
155 |
158 |
8 |
NR, not reported; BCT, breast conserving surgery; HT, hormone therapy; CT, chemotherapy; NOS, Newcastle-Ottawa Scale
#shown as median (range [if given]); *mean ± standard deviation (if given); **overall follow-up month.
Outcomes
The 29 included studies were published between 1987 and 2015, with follow-up periods of 26 to 324 months. A total of 141,163 individuals were included in our analysis. Detailed data and analyses by categories are available in Table 2.
Table 2: Analyses of outcomes by categories
Outcome |
No. of studies |
Participants |
Statistical model |
Effect estimate (95% CI) |
|---|---|---|---|---|
Stage I vs. II-IV |
6 |
2315 |
Random-effects |
0.84 (0.74, 0.96) |
T1 vs. T2-4 |
11 |
26570 |
Random-effects |
0.82 (0.77, 0.87) |
N0 vs. N1-3 |
8 |
24763 |
Fixed-effect |
0.85 (0.83, 0.87) |
G2 vs. G1 |
8 |
1804 |
Fixed-effect |
1.58 (1.40, 1.79) |
G3 vs. G1 |
8 |
1542 |
Random-effects |
2.17 (1.77, 2.67) |
G3 vs. G2 |
8 |
2206 |
Random-effects |
1.41 (1.25, 1.60) |
ER− vs. ER+ |
12 |
117988 |
Random-effects |
1.32 (1.22, 1.43) |
Age < 50 vs. ≥ 50 years |
8 |
27209 |
Random-effects |
1.00 (0.91, 1.11) |
Age < 40 vs. ≥ 40 years |
3 |
1103 |
Fixed-effect |
0.99 (0.81, 1.21) |
Pre- vs. post-menopausal |
4 |
1990 |
Random-effects |
1.02 (0.93, 1.12) |
CI, confidence interval.
Aneuploidy rate with regard to tumor stage
Six studies [7, 11, 20, 25, 34, 35] investigated the correlation between aneuploidy rate and tumor pTNM stages. This pooled analysis revealed that aneuploidy was significantly less frequent in patients with stage I BC compared to those with stages II-IV tumors (RR = 0.84; 95% CI, 0.74 to 0.96; P = 0.01, random-effects model; Figure 3A; sign test: P = 1; RD = -0.12; 95% CI, -0.17 to -0.08; P < 0.00001, fixed- effect model). The result from the Egger’s test showed that there was no indication of a bias (P = 0.956).
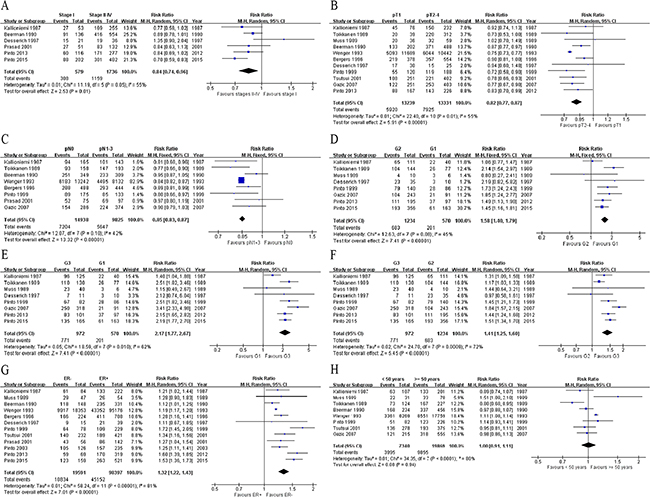
Figure 3: Forest plots of ploidy status vs. BC pathologic features and age. Aneuploidy is significantly more frequent in stage I tumors than in stages II-IV ones A. in > 2 cm tumors than in ≤ 2 cm ones B. in tumors with lymph node metastasis than in pN0 ones C. in G2 tumors than in G1 tumors D. in G3 tumors than in G1 tumors E. in G3 tumors than in G2 tumors F. and in ER− tumors than in ER+ tumors G. However, no significant differences exist between patients ≥ 50 years and those < 50 years H. ER, estrogen receptor; M-H, Mantel-Haenszel; CI, confidence interval.
Aneuploidy rate with regard to tumor size
Eleven studies [7, 9-11, 16, 18, 20, 22, 26, 33, 34] examined the correlation between aneuploidy rate and tumor size. This meta-analysis revealed that aneuploidy was significantly less frequent in ≤ 2 cm tumors than in > 2 cm ones (RR = 0.82; 95% CI, 0.77 to 0.87; P < 0.00001, random-effects model; Figure 3B; sign test: P = 0.013; RD = -0.14; 95% CI, -0.15 to -0.13; P < 0.00001, fixed-effect model). The Egger’s test showed that there was no significant bias (P = 0.408).
Aneuploidy rate with regard to LN status
There are 8 studies [7, 10, 11, 16, 18, 22, 25, 33] examining the correlation between aneuploidy and tumor pN status. The pooled data implied that aneuploidy was significantly less frequent in BCs with pN0 than in LN metastasis ones (RR = 0.85; 95% CI, 0.83 to 0.87; P < 0.00001; sign test: P = 0.074; Figure 3C; RD = -0.09; 95% CI, -0.10 to -0.07; P < 0.00001), based on a fixed-effect model.
Aneuploidy rate with regard to tumor grading
Eight studies [7, 9, 10, 20, 22, 33-35] provided data concerning the association between aneuploidy frequency and tumor grade. The meta-analysis revealed that aneuploidy was significantly more frequent in G2 tumors than in G1 tumors (RR = 1.58; 95% CI, 1.40 to 1.79; P < 0.00001, fixed-effect model; Figure 3D; sign test: P = 0.074; RD = 0.21; 95% CI, 0.13 to 0.28; P < 0.00001, random-effects model). Besides, aneuploidy was significantly more frequent in G3 tumors than in G1 tumors (RR = 2.17; 95% CI, 1.77 to 2.67; P < 0.00001, random-effects model; Figure 3E; sign test: P = 0.041; RD = 0.44; 95% CI, 0.36 to 0.52; P < 0.00001, random-effects model). Similar results were observed when comparing G3 and G2 tumors (RR = 1.41; 95% CI, 1.25 to 1.60; P < 0.00001; Figure 3F; sign test: P = 0.041; RD = 0.23; 95% CI, 0.16 to 0.30; P < 0.00001) based on a random-effects model. The results from the Egger’s tests showed that there was no indication of biases for these two meta-analyses (P = 0.316 and 0.437, respectively).
Aneuploidy rate with regard to ER status
Twelve studies [7, 9, 11, 16, 18, 20, 22, 25-27, 34, 35] investigated the aneuploidy frequency in ER+ and ER− BCs. The pooled analysis uncovered that aneuploidy was significantly more frequent in ER− tumors than in ER+ tumors (RR = 1.32; 95% CI, 1.22 to 1.43; P < 0.00001; Figure 3G; sign test: P = 0.04; RD = 0.18; 95% CI, 0.12 to 0.24; P < 0.00001) based on a random-effects model. The Egger’s test demonstrated no significant bias (P = 0.908).
Aneuploidy rate with regard to age and menopausal status
Analyses of the association between aneuploidy and age revealed no statistical significance. From eight [7, 9-11, 16, 22, 26, 33] studies using 50 years of age as a cut point, the RR of patients with aneuploidy tumor less than 50 years compared to those above 50 years old was 1.00 (95% CI, 0.91 to 1.11; P = 0.94; Figure 3H). Likewise, pooled analysis of the studies [20, 26, 34] using 40 years as a cut point showed a similar result (RR = 0.99; 95% CI, 0.81 to 1.21; P = 0.92). Four studies [7, 17, 18, 34] explored the aneuploidy frequency in premenopausal and postmenopausal women with BCs and our analysis demonstrated that aneuploidy was not significantly associated with menopausal status (RR = 1.02; 95% CI, 0.93 to 1.12; P = 0.66; sign test: P = 0.04). Egger’s tests showed that there was no bias for these meta-analyses (P = 0.146, 0.365, and 0.365, respectively).
DFS and OS of BC in relation to ploidy status
Patients with aneuploid tumors had significantly worse DFS (21 studies [8, 9, 14-17, 19, 21-26, 28-35]; HR = 0.73; 95% CI, 0.65 to 0.82; P < 0.00001; Figure 4A; sign test: P = 0.001) and OS (18 studies [7, 9-13, 17, 19, 22, 24-27, 29, 30, 33-35]; HR = 0.72; 95% CI, 0.61 to 0.85, P =0.0001; Figure 4B; sign test: P = 0.016) compared with diploid ones, based on a random-effects model.
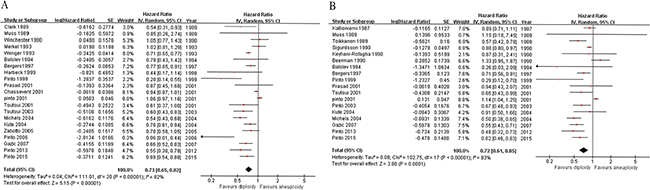
Figure 4: Forest plots of ploidy status vs. survival in breast cancer. Patients with aneuploid tumors have significantly worse disease-free survival A. and overall survival B. compared with diploid ones. IV, inverse variance; CI, confidence interval.
Subgroup analysis
Subgroup analysis was carried out and focused on node-negative BC. Pooled results showed that aneuploidy remained significantly more prevalent in ≤ 2 cm tumors compared to > 2 cm ones (RR = 0.82; 95% CI, 0.71 to 0.95; P = 0.009), and in ER− BCs than ER+ ones (RR = 1.32; 95% CI, 1.16 to 1.51; P < 0.00001) based on a fixed-effect model. The pooled HR for OS was 0.87 (6 studies [9, 12, 13, 17, 26, 29], 95% CI, 0.79 to 0.95, P = 0.002; sign test: P = 0.480) based on the fixed-effect model. The pooled HR for DFS was 0.76 (9 studies [8, 9, 14, 15, 17, 21, 26, 29, 32], 95% CI, 0.60 to 0.96, P = 0.02; sign test: P = 0.134) based on the random-effects model. There is no indication of biases for these subgroup analyses (Egger’s test: P = 0.332, 0.058, and 0.392, respectively).
Sensitivity test
Sensitivity analyses were performed for all the outcomes. Particularly, the sensitivity test excluding the largest study [16] showed that the effect estimate remained very similar (tumor size: RR = 0.84, 95% CI, 0.79 to 0.88, P < 0.00001; LN metastasis: RR = 0.88, 95% CI, 0.84 to 0.93, P < 0.00001; ER status: RR = 1.34, 95% CI, 1.23 to 1.46, P < 0.00001; age with 50 years as cut-point: RR = 0.98, 95% CI, 0.89 to 1.08, P = 0.65; DFS: HR = 0.73, 95% CI, 0.64 to 0.83, P < 0.00001). In tumor stage analysis, after excluding Wyss-Desserich et al.’s study [20], which was the only one focusing on patients with node-negative tumors, the outcome remained alike; however, when Pinto et al. (2013)’s data [34] were omitted, the significance was weakened (P = 0.06). In tumor grade analyses, after omitting Gazic et al.’s study [33], which used tumor samples from fine needle aspirates (FNAs) compared to the others which used tissues from surgery, the outcomes remained significant (G3 vs. G1: RR = 2.12, 95% CI, 1.88 to 2.39; P < 0.00001; fixed-effect model; G3 vs. G2: RR = 1.37, 95% CI, 1.28 to 1.46; P < 0.00001; fixed-effect model). Sensitivity analyses of the other outcomes yielded similar results. Egger’s test and an exhaustive literature search conferred a substantial degree of confidence in our pooled findings.
DISCUSSION
DNA content analysis has been suggested to assess cell kinetics insofar as the DNA percent of S phase cells is identified by histogram. However, the S phase assessment is usually hampered by the overlap between aneuploid tumor and diploid non-malignant cell populations, few cells, background debris, and multiploid/hypertetraploid tumors. For this reason, in human tumor cells, DNA content analysis is mainly used to evaluate the occurrence of aneuploid cell population, an abnormality known to represent the tumor cells. Though the role of aneuploidy as an independent prognostic parameter in BC has been widely studied during the last decades, the results remained controversial. This study is the first meta-analysis focusing on this particular aspect of aneuploidy in BC. It shows that the frequency of DNA aneuploidy is significantly associated with certain prognostic factors, such as tumor size, grade, LN metastasis, and ER status in BC patients. Aneuploidy is more frequently detected in BCs with larger diameters, poorly differentiated cells, LN metastasis, and negative ER expression. However, it was not significantly correlated with menopausal status or age. This study also supports aneuploidy as a significant prognosticator for DFS and OS in BC. Patients with diploid tumors benefited from a significantly reduced risk (27% and 28%, respectively) for cancer recurrence and death.
It is well described that cancer develops from normal tissue through adenoma to carcinoma, and finally metastasis. Aneuploidy has been suggested to be related to cell proliferation and poor differentiation but not disease stage [36]. Our analysis showed a significantly positive correlation between aneuploidy and BC stage, as well as tumor size. It implies the potential role of aneuploidy in BC progression. LN metastasis is a high-risk factor for BC. Previous studies revealed controversial results of the correlation between DNA aneuploidy and LN metastasis. Some of the studies have failed to demonstrate the relationship between ploidy and node status [11, 18, 25, 37]. Based on 8 studies on this aspect, our analysis showed a significant association between aneuploidy and LN metastasis. In addition, aneuploidy was shown to be correlated with a poor survival, especially in node-negative BC. Furthermore, Fallenius et al. [38] demonstrated that node-positive non-aneuploid tumors entailed a better survival than node-negative but aneuploid tumors, suggesting that aneuploidy in this cohort was a stronger prognostic marker than node assessment. Thus, aneuploidy might be a BC prognosticator and provide a valuable clue for early intervention. The relationship between DNA ploidy and BC grade has been reported in many studies [6, 39]. The result of this analysis reveals that aneuploidy is more frequent as tumor grade increases. Therefore, it is suggested that patients with well differentiated or diploid tumors tend to have relatively good clinical outcomes. Base on the fact that the extension of disease remains the most significant prognostic factor in BC, aneuploidy may have a prognostic impact within each stage of the disease. For patients with G2 BCs, the therapeutic decision making is more difficult because of the relatively equivocal information. In this regard, DNA ploidy status may provide some useful prognostic information. Szasz et al. [40] investigated a CIN4 chromosomal instability gene signature by quantitative polymerase chain reaction analysis, and found that tumor aneuploidy stratifies G2 tumors into good and poor prognosis groups. Pinto et al. [32] also carried out a study focusing on this subset of aneuploidy, and found that aneuploidy is negatively correlated with DFS in T1-2N0-2 G2 BC patients. Thus patients diagnosed with aneuploidy BC should be classified into high-risk groups and require systematic treatment. More studies exploring the outcomes of aneuploidy or diploidy on G2 BC are needed.
There is a close correlation between DNA ploidy and ER status. Due to the biological and clinical significances of DNA ploidy, it should be focused on during therapeutic planning. Systemic chemotherapy is recommended for the majority of BCs [41]. However, previous studies [41, 42] had inconsistent results on the benefit of chemotherapy for patients with different ER statuses. Our results show that aneuploidy occurs more frequently in ER− BC, especially node-negative ER− BC, which implies that, adjuvant chemotherapy should be selected for this subgroup of patients. And for those with ER+ tumors, appropriate hormone therapy could be applied.
The outcomes of BC patients might be affected by treatment modalities. However, this analysis demonstrates that patients with aneuploid tumors perform worse than those with diploidy ones, even though they are supplied with adjuvant therapy. In 2005, Moureau-Zabotto et al. [31] carried out a study on the predictive value of aneuploidy comparing patients receiving adjuvant chemotherapy with those without chemotherapy. In patients who received adjuvant chemotherapy, DNA ploidy status before treatment had no correlations with DFS and OS. On the contrary, in patients without chemotherapy, aneuploid tumors had significantly worse DFS and OS compared to diploid ones. Therefore, aneuploidy might be used as a recurrence prognosticator for therapeutic decision making. Furthermore, BC polyploidy was shown to be correlated with induction of stemness (conversion of usual BC cells into cancer stem cells). Particularly, polyploidy and stemness might be enhanced after treatment with irradiation or chemotherapy [43-46]. The addition of (neo)adjuvant therapy might be harmful to some patients. Thus, DNA flow cytometry might be needed during the therapeutic process to revise treatment strategies. Since more patients are now receiving adjuvant treatment, randomized studies with larger series of participants are needed to further determine the value of DNA ploidy status in anti-BC therapy.
Besides, DNA ploidy analysis using the DNA flow cytometry method has its advantages. Most molecular/genomic technologies are not applied in routine practice [47, 48]. There exist difficulties in data interpretation, significant cost, and lack of standardization [49, 50]. And tumor grading requires the assessment by experienced pathologists. Comparably, DNA ploidy analysis by flow cytometry is a simple, fast, cheap, and standardized method [47, 48, 51]. By following recommended protocols and using appropriate controls, the error’s possibility would be minimized and data would become more precise and reproducible.
The strengths of our analyses lie in the thorough literature research and qualified statistical approaches, which provided the veritable results. Besides, all the selected studies are of relatively high quality. However, this meta-analysis has some limitations. First, it is only based on published but not individual patient data. Second, the studies included were not randomized studies. Third, not all outcome measures were reported by all enrolled studies. Hitherto, the results should be taken into consideration with cautiousness. Further studies are required in this field.
In conclusion, this meta-analysis reveals that DNA ploidy status might refine the outcome assessment and personalized treatment choice. And a significantly higher frequency of aneuploidy at advanced tumor stages implies an increased genomic instability during BC progression. This finding may have important therapeutic implications in BC. Furthermore, it should be noted that the value of aneuploidy for BC prognosis needs to be validated in further multicenter studies with larger samples and longer follow-up periods. This would be, undoubtedly, a giant step forward to improve the personalized medicine in BC management.
METHODS
Publication search
This meta-analysis was guided by the Preferred Reported Items for Systematic Reviews and Meta-Analysis (PRISMA) statement issued in 2009 [52]. The electronic databases PubMed, EMBASE, and Web of Science were searched for relevant published studies up to November 20th 2015, using the following keywords: ‘DNA ploidy/aneuploidy’, ‘cytometry’, and ‘breast/mammary cancer/carcinoma’. The American Society of Clinical Oncology annual meeting abstract was also retrieved. The language limitation was not applied during search.
Inclusion criteria
To be considered eligible for this meta-analysis, the relevant clinical studies were carefully selected based on the following criteria: 1) available baseline statuses of enrolled women; 2) estimation of overall survival (OS), disease free survival (DFS), or relapse free survival (RFS)-DNA content relationship as aim of the study; 3) patients were diagnosed BC by histological method and the specimens were collected before any anticancer treatment (e.g., chemotherapy, radiotherapy, hormone therapy); 4) clear definition of DNA diploidy and aneuploidy; 5) the Kaplan-Meier (K-M) method was used to estimate survival rate according to the DNA content, and a Cox proportional hazard regression model was occupied to investigate the relative strength and independent prognostic value of the variables. Alternatively, the study reported hazard ratio (HR) with a 95% confidence interval (CI).
Xu J and Huang L implemented the literature search, and identified eligible papers according to the inclusion criteria. Li J participated in a final decision if consensus could not be reached through discussion. Studies were excluded from the analysis if the retrieved paper was an earlier report of data updated in a subsequent publication.
Data extraction and definition
Data extraction and quality assessment were conducted by Xu J and Huang L. The data extracted from each eligible study included authors’ names, publication year, baseline characteristics, statistic method, DNA ploidy status, median follow-up, adjuvant settings, and survival. The investigated parameters were the BC aneuploidy rates in relation to tumor size, grade, LN metastasis, estrogen receptor (ER) status, DFS, and OS. DFS events included local and distant recurrences of the original cancer, second primary BC, and death. Hazard ratios (HRs) with 95% confidence intervals (CIs) were applied where possible. If HRs and 95% CIs were not directly reported, we extracted data from K-M curves by Engauge Digitizer 4.1 and then calculated the indexes.
Statistical analysis
Statistical analyses were carried out following the recommendations of the Cochrane Collaboration Guidelines. The quality of included studies was assessed by the Newcastle-Ottawa Scale (NOS) scale. Fixed-effect or random-effects model chosen according to data heterogeneity was adopted to calculate the pooled estimate (risk ratio [RR], risk difference [RD], or HR) using the Mantel-Haenszel’s or the inverse variance method based on the available data type. Sign tests were performed to assess the significance of evidence in each dataset. Cochran’s Q statistic was used to check the homogeneity assumption. We calculated the Higgins’ I2 index, which describes the percentage of total cross-study variation due to heterogeneity rather than chance, to obtain a quantitative measure of the degree of inconsistency in the results of studies. The fixed-effect model was adopted if no heterogeneity was present (χ2P < 0.100 and I2 < 50%). When there existed excessive heterogeneity, data were first rechecked for validation. If the heterogeneity persisted, the DerSimonian random-effects model was employed [53, 54]. The forest plot was generated to display results, and potential publication bias was estimated by Egger’s test [55]. Sensitivity test was carried out to investigate the influence of a single study on the pooled estimates by sequentially excluding each study. Subgroup analyses were performed by pooling estimates for similar subsets of patients across studies where available. All statistical analyses were performed using RevMan 5.3 and Stata 11. All P values were two-sided.
ACKNOWLEDGMENT
The authors would most sincerely thank the reviewers and editors for critically reviewing this paper and for the constructive and thoughtful comments and suggestions. We are grateful to Ms. Sarah Ding for the English language assistance. This study was supported by The Medical Technology Development Research Project of MOHC (W2013GJ42).
CONFLICTS OF INTEREST
None of the authors have any competing interests in the manuscript.
REFERENCES
1. Ferlay J, Soerjomataram I, Dikshit R, Eser S, Mathers C, Rebelo M, Parkin DM, Forman D and Bray F. Cancer incidence and mortality worldwide: sources, methods and major patterns in GLOBOCAN 2012. International journal of cancer. 2015; 136:E359-386.
2. Torre LA, Bray F, Siegel RL, Ferlay J, Lortet-Tieulent J and Jemal A. Global cancer statistics, 2012. CA: a cancer journal for clinicians. 2015; 65:87-108.
3. Weigel MT and Dowsett M. Current and emerging biomarkers in breast cancer: prognosis and prediction. Endocrine-related cancer. 2010; 17:R245-262.
4. Abdalla FB, Boder JM, Buhmeida A, Elzagheid AI and Collan Y. Image DNA cytometry in FNABs of Libyan breast disease. Anticancer research. 2010; 30:175-181.
5. Ahmed M and Douek M. How Do You Calculate the Sensitivity of Preoperative Ultrasonography-guided Fine Needle Aspiration (FNA) for Axillary Staging in Breast Cancer? Annals of surgery. 2015; 262:e22.
6. Ross JS, Linette GP, Stec J, Ross MS, Anwar S and Boguniewicz A. DNA ploidy and cell cycle analysis in breast cancer. American journal of clinical pathology. 2003; 120:S72-84.
7. Kallioniemi OP, Blanco G, Alavaikko M, Hietanen T, Mattila J, Lauslahti K and Koivula T. Tumour DNA ploidy as an independent prognostic factor in breast cancer. British journal of cancer. 1987; 56:637-642.
8. Clark GM, Dressler LG, Owens MA, Pounds G, Oldaker T and McGuire WL. Prediction of relapse or survival in patients with node-negative breast cancer by DNA flow cytometry. The New England journal of medicine. 1989; 320:627-633.
9. Muss HB, Kute TE, Case LD, Smith LR, Booher C, Long R, Kammire L, Gregory B and Brockschmidt JK. The relation of flow cytometry to clinical and biologic characteristics in women with node negative primary breast cancer. Cancer. 1989; 64:1894-1900.
10. Toikkanen S, Joensuu H and Klemi P. The prognostic significance of nuclear DNA content in invasive breast cancer–a study with long-term follow-up. British journal of cancer. 1989; 60:693-700.
11. Beerman H, Kluin PM, Hermans J, van de Velde CJ and Cornelisse CJ. Prognostic significance of DNA-ploidy in a series of 690 primary breast cancer patients. International journal of cancer. 1990; 45:34-39.
12. Keyhani-Rofagha S, O’Toole RV, Farrar WB, Sickle-Santanello B, DeCenzo J and Young D. Is DNA ploidy an independent prognostic indicator in infiltrative node-negative breast adenocarcinoma? Cancer. 1990; 65:1577-1582.
13. Sigurdsson H, Baldetorp B, Borg A, Dalberg M, Ferno M, Killander D and Olsson H. Indicators of prognosis in node-negative breast cancer. The New England journal of medicine. 1990; 322:1045-1053.
14. Winchester DJ, Duda RB, August CZ, Goldschmidt RA, Wruck DM, Rademaker AW, Winchester DP and Merkel DE. The importance of DNA flow cytometry in node-negative breast cancer. Archives of surgery. 1990; 125:886-889.
15. Merkel DE, Winchester DJ, Goldschmidt RA, August CZ, Wruck DM and Rademaker AW. DNA flow cytometry and pathologic grading as prognostic guides in axillary lymph node-negative breast cancer. Cancer. 1993; 72:1926-1932.
16. Wenger CR, Beardslee S, Owens MA, Pounds G, Oldaker T, Vendely P, Pandian MR, Harrington D, Clark GM and McGuire WL. DNA ploidy, S-phase, and steroid receptors in more than 127,000 breast cancer patients. Breast cancer research and treatment. 1993; 28:9-20.
17. Balslev I, Christensen IJ, Rasmussen BB, Larsen JK, Lykkesfeldt AE, Thorpe SM, Rose C, Briand P and Mouridsen HT. Flow cytometric DNA ploidy defines patients with poor prognosis in node-negative breast cancer. International journal of cancer. 1994; 56:16-25.
18. Bergers E, van Diest PJ and Baak JP. Cell cycle analysis of 932 flow cytometric DNA histograms of fresh frozen breast carcinoma material. Correlations between flow cytometric, clinical, and pathologic variables. MMMCP Collaborative Group. Multicenter Morphometric Mammary Carcinoma Project Collaborative Group. Cancer. 1996; 77:2258-2266.
19. Bergers E, Baak JP, van Diest PJ, van Gorp LH, Kwee WS, Los J, Peterse HL, Ruitenberg HM, Schapers RF, Somsen JG, van Beek MW, Bellot SM and Fijnheer J. Prognostic implications of different cell cycle analysis models of flow cytometric DNA histograms of 1,301 breast cancer patients: results from the Multicenter Morphometric Mammary Carcinoma Project (MMMCP). International journal of cancer. 1997; 74:260-269.
20. Wyss-Desserich MT, Caduff-Joos R, Wyss P, Rageth C, Wight E, Unger C, Walt H and Haller U. Premenopausal node-negative breast cancer: may adjuvant chemotherapy be indicated by the analysis of nuclear DNA dynamics? Breast cancer research and treatment. 1997; 42:253-263.
21. Harbeck N, Dettmar P, Thomssen C, Berger U, Ulm K, Kates R, Hofler H, Janicke F, Graeff H and Schmitt M. Risk-group discrimination in node-negative breast cancer using invasion and proliferation markers: 6-year median follow-up. British journal of cancer. 1999; 80:419-426.
22. Pinto AE, Andre S and Soares J. Short-term significance of DNA ploidy and cell proliferation in breast carcinoma: a multivariate analysis of prognostic markers in a series of 308 patients. Journal of clinical pathology. 1999; 52:604-611.
23. Chassevent A, Jourdan ML, Romain S, Descotes F, Colonna M, Martin PM, Bolla M and Spyratos F. S-phase fraction and DNA ploidy in 633 T1T2 breast cancers: a standardized flow cytometric study. Clin Cancer Res. 2001; 7:909-917.
24. Pinto AE, Andre S, Pereira T, Nobrega S and Soares J. Prognostic comparative study of S-phase fraction and Ki-67 index in breast carcinoma. Journal of clinical pathology. 2001; 54:543-549.
25. Prasad AR, Divine G and Zarbo RJ. Two-color, cytokeratin-labeled dna flow cytometric analysis of 332 breast cancers: lack of prognostic value with 12-year follow-up. Archives of pathology & laboratory medicine. 2001; 125:364-374.
26. Tsutsui S, Ohno S, Murakami S, Hachitanda Y and Oda S. Prognostic value of DNA ploidy in 653 Japanese women with node-negative breast cancer. International journal of clinical oncology. 2001; 6:177-182.
27. Pinto AE, Andre S, Mendonca E, Silva G and Soares J. Overall survival in advanced breast cancer: relevance of progesterone receptor expression and DNA ploidy in fine-needle aspirates of 392 patients. The International journal of biological markers. 2003; 18:7-12.
28. Tsutsui S, Ohno S, Murakami S, Kataoka A, Kinoshita J and Hachitanda Y. Prognostic significance of the combination of biological parameters in breast cancer. Surgery today. 2003; 33:151-154.
29. Kute TE, Russell GB, Zbieranski N, Long R, Johnston S, Williams H, Stackhouse C, Wilkins L, Evans I, Berry P, Rimmer K and Tucker E. Prognostic markers in node-negative breast cancer: a prospective study. Cytometry B Clin Cytom. 2004; 59:24-31.
30. Michels JJ, Marnay J, Plancoulaine B and Chasle J. Flow cytometry in primary breast carcinomas: prognostic impact of S-phase fraction according to different analysis patterns. Cytometry B Clin Cytom. 2004; 59:32-39.
31. Moureau-Zabotto L, Bouchet C, Cesari D, Uzan S, Lefranc JP, Antoine M, Genestie C, Deniaud-Alexandre E, Bernaudin JF, Touboul E and Fleury-Feith J. Combined flow cytometry determination of S-phase fraction and DNA ploidy is an independent prognostic factor in node-negative invasive breast carcinoma: analysis of a series of 271 patients with stage I and II breast cancer. Breast cancer research and treatment. 2005; 91:61-71.
32. Pinto AE, Andre S, Pereira T, Silva G and Soares J. DNA flow cytometry but not telomerase activity as predictor of disease-free survival in pT1-2/N0/G2 breast cancer. Pathobiology. 2006; 73:63-70.
33. Gazic B, Pizem J, Bracko M, Cufer T, Borstnar S, Pohar-Marinsek Z and Us-Krasovec M. S-phase fraction determined on fine needle aspirates is an independent prognostic factor in breast cancer - a multivariate study of 770 patients. Cytopathology. 2008; 19:294-302.
34. Pinto AE, Pereira T, Santos M, Branco M, Dias A, Silva GL, Ferreira MC and Andre S. DNA ploidy is an independent predictor of survival in breast invasive ductal carcinoma: a long-term multivariate analysis of 393 patients. Annals of surgical oncology. 2013; 20:1530-1537.
35. Pinto AE, Pereira T, Silva GL and Andre S. Aneuploidy identifies subsets of patients with poor clinical outcome in grade 1 and grade 2 breast cancer. Breast. 2015; 24:449-455.
36. Silvestrini R. Relevance of DNA-ploidy as a prognostic instrument for solid tumors. Annals of oncology. 2000; 11:259-261.
37. Batsakis JG, Sneige N and el-Naggar AK. Flow cytometric (DNA content and S-phase fraction) analysis of breast cancer. Cancer. 1993; 71:2151-2153.
38. Fallenius AG, Franzen SA and Auer GU. Predictive value of nuclear DNA content in breast cancer in relation to clinical and morphologic factors. A retrospective study of 227 consecutive cases. Cancer. 1988; 62:521-530.
39. Pinto AE, Andre S, Nogueira M, Mendonca E and Soares J. Flow cytometric DNA hypertetraploidy is associated with unfavourable prognostic features in breast cancer. Journal of clinical pathology. 1997; 50:591-595.
40. Szasz AM, Li Q, Eklund AC, Sztupinszki Z, Rowan A, Tokes AM, Szekely B, Kiss A, Szendroi M, Gyorffy B, Szallasi Z, Swanton C and Kulka J. The CIN4 chromosomal instability qPCR classifier defines tumor aneuploidy and stratifies outcome in grade 2 breast cancer. PloS one. 2013; 8:e56707.
41. Goldhirsch A, Winer EP, Coates AS, Gelber RD, Piccart-Gebhart M, Thurlimann B, Senn HJ and Panel m. Personalizing the treatment of women with early breast cancer: highlights of the St Gallen International Expert Consensus on the Primary Therapy of Early Breast Cancer 2013. Annals of oncology. 2013; 24:2206-2223.
42. Senkus E, Kyriakides S, Ohno S, Penault-Llorca F, Poortmans P, Rutgers E, Zackrisson S, Cardoso F and Committee EG. Primary breast cancer: ESMO Clinical Practice Guidelines for diagnosis, treatment and follow-up. Annals of oncology. 2015; 26:v8-30.
43. Salmina K, Jankevics E, Huna A, Perminov D, Radovica I, Klymenko T, Ivanov A, Jascenko E, Scherthan H, Cragg M and Erenpreisa J. Up-regulation of the embryonic self-renewal network through reversible polyploidy in irradiated p53-mutant tumour cells. Experimental cell research. 2010; 316:2099-2112.
44. Lagadec C, Vlashi E, Della Donna L, Dekmezian C and Pajonk F. Radiation-induced reprogramming of breast cancer cells. Stem cells. 2012; 30:833-844.
45. Gerashchenko BI, Salmina K, Eglitis J, Huna A, Grjunberga V and Erenpreisa J. Disentangling the aneuploidy and senescence paradoxes: a study of triploid breast cancers non-responsive to neoadjuvant therapy. Histochemistry and cell biology. 2016; 145:497-508.
46. Mirzayans R, Andrais B, Kumar P and Murray D. The Growing Complexity of Cancer Cell Response to DNA-Damaging Agents: Caspase 3 Mediates Cell Death or Survival? International journal of molecular sciences. 2016; 17.
47. Ivshina AV, George J, Senko O, Mow B, Putti TC, Smeds J, Lindahl T, Pawitan Y, Hall P, Nordgren H, Wong JE, Liu ET, Bergh J, Kuznetsov VA and Miller LD. Genetic reclassification of histologic grade delineates new clinical subtypes of breast cancer. Cancer research. 2006; 66:10292-10301.
48. Sotiriou C and Pusztai L. Gene-expression signatures in breast cancer. The New England journal of medicine. 2009; 360:790-800.
49. Reis-Filho JS, Westbury C and Pierga JY. The impact of expression profiling on prognostic and predictive testing in breast cancer. Journal of clinical pathology. 2006; 59:225-231.
50. Ioannidis JP, Allison DB, Ball CA, Coulibaly I, Cui X, Culhane AC, Falchi M, Furlanello C, Game L, Jurman G, Mangion J, Mehta T, Nitzberg M, Page GP, Petretto E and van Noort V. Repeatability of published microarray gene expression analyses. Nature genetics. 2009; 41:149-155.
51. Bagwell CB, Clark GM, Spyratos F, Chassevent A, Bendahl PO, Stal O, Killander D, Jourdan ML, Romain S, Hunsberger B, Wright S and Baldetorp B. DNA and cell cycle analysis as prognostic indicators in breast tumors revisited. Clin Lab Med. 2001; 21:875-895, x.
52. Moher D, Liberati A, Tetzlaff J, Altman DG and Group P. Preferred reporting items for systematic reviews and meta-analyses: the PRISMA statement. Bmj. 2009; 339:b2535.
53. DerSimonian R and Laird N. Meta-Analysis in Clinical Trials Revisited. Contemporary clinical trials. 2015.
54. DerSimonian R and Laird N. Meta-analysis in clinical trials. Control Clin Trials. 1986; 7:177-188.
55. Egger M, Davey Smith G, Schneider M and Minder C. Bias in meta-analysis detected by a simple, graphical test. Bmj. 1997; 315:629-634.