
INTRODUCTION
The ligands for the NKG2D immunoreceptor include one group of retinoic acid early transcript-1 (Rae-1), H60, and Mult1 in rodents, four UL-16 binding proteins and the MHC class I-related chain A and B (MICA/B) in humans. These ligands bind the NKG2D receptor expressed on natural killer cells, γδ T cells, and CD8+ T cells, and play an important role in activating innate immunity [1, 2]. MICA/B proteins are not expressed in normal epithelial cells except at low levels in variable areas of the intestinal epithelium of healthy individuals [3–5]. MICA/B expression is increased in melanoma, breast, colon, hepatocellular, and prostate cancers and some leukemias [4, 6–8], due in part to oncogene mutations [9–13]. For example, activation of the MAP kinase pathway by oncogene mutations such as RAS or BRAF induces MICA/B expression in thyroid tumor cell lines [12]. Ras activation induces the expression of murine NKG2D ligand expression [14]. DNA damage by exposure to radiation and genotoxic drugs induces NKG2D ligand expression in tumor and fibroblast cells [13, 15, 16]. Mechanistic studies suggest that ROS plays a critical role in DNA damage-induced NKG2D ligand expression in part through E2F transcriptionl regulation [17–20]. Alternatively, presence of DNA in the cytoplasm and activation of STING in DNA-damaged cells leads to the activation of IRF-3 transcription factor and induction of NKG2D ligand expression [21, 22].
Xanthine oxidoreductase (XOR) is a rate-limiting enzyme in the purine catabolic pathway [23]. Uric acid, one of its end products, has been identified as a novel “danger signal” that activates innate immunity [24–26]. Uric acid produced in apoptotic or necrotic cells induces the expression of the co-stimulatory molecules CD80 and CD86 in dendritic cells and promote dendritic cell maturation [24–26]. Recent studies demonstrated that XOR expression is decreased in several types of malignancy, including breast, colon, gastric, lung cancers [27–31]. How XOR expression contributes to an aggressive tumor behavior and a shorter survival remains unclear [28]. XOR is not only a differentiation marker but also plays an important role in promoting the inflammatory state [32]. Gibbings et al. [33] reported that XOR expression is increased in the inflammatory mononuclear phagocytes and plays an important role in CINC-1 (Cytokine-Induced Neutrophil Chemoattractant-1) secretion and differentiation of mononuclear phagocytes into the M2 phenotype of macrophages. Here we report that XOR plays a crucial role in activating the MAP kinase pathway and inducing NKG2D ligand expression in tumor cells undergoing genotoxic stress, and that XOR is required for gemcitabine-mediated antitumor activity in a syngeneic mouse breast cancer model.
RESULTS
Genotoxic stress leads to increased uric acid and ROS production
Uric acid is a novel “danger” signal that is capable of alerting the immune system [34]. XOR, a rate-limiting enzyme that catalyzes xanthine to produce uric acid and ROS, is differentially expressed in a variety of malignancies [27–30]. We first confirmed XOR expression in the cytoplasm of HeLa and HT29 cells by immunofluorescence staining (Figure 1A). Western blot analysis revealed the expression of XOR as an approximately 150-kDa protein. Genotoxic stress did not significantly alter the levels of XOR expression in HT29 and HeLa cells (Figure 1B). Furthermore, XOR levels did not change over different times in genotoxic drug-treated HT29 (Figure 1D) and HeLa cells (Figure 1C).
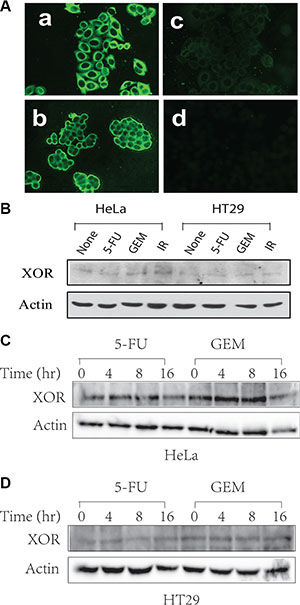
Figure 1: XOR expression in HeLa and HT29 cells. (A) IF staining of XOR. HeLa (a) and HT29 (b) cells were analyzed for XOR expression by IF staining with an anti-XOR antibody. (c) The specificity of the antibody on HeLa cells was confirmed by pre-mixing anti-XOR antibody (1:50 in 200 μl) with purified XOR (2 μg/200 μl). Normal rabbit IgG was included as a negative control (d). (B–D) Genotoxic stress does not alter XOR expression. HeLa and HT29 cells were left untreated or treated with 5-FU (10 μM), gemcitabine (2 μM) or radiation (40 Gy) for 24 hr (B) or treated with 5-FU (10 μM) or gemcitabine (2 μM) in HeLa (C) and HT29 cells (D) for the indicated time. Cell lysates were prepared in NP-40 lysis buffer and analyzed for XOR expression by Western blot with a rabbit anti-XOR antiserum.
Uric acid accumulates in tumor tissue following genotoxic drug treatment [35]. Here we tested if uric acid accumulated in HeLa and HT29 cells after genotoxic stress, including 5-FU, gemcitabine or radiation. As shown in Figure 2A, intracellular uric acid levels were elevated at least by 50% in two tumor cell lines after exposure. Allopurinol, an analog of hypoxanthine and a specific XOR inhibitor, completely blocked the accumulation of uric acid in the cells treated with 5-FU, gemcitabine, or radiation. Similar observation was made with RCAS-Neu, a murine breast cancer cell line (Figure 2B). Intracellular ROS levels were slightly elevated in HT29 cells when analyzed at 4 hr (Figure 2C) and significantly elevated 12 hr (Figure 2D) after exposure to 5-FU, gemcitabine, or radiation (red line) (Figure 2D), compared to the fluorescence level in untreated cells (black line) as a control. The shift of the histogram curve indicates the increase of ROS levels in cells treated with genotoxic drugs and radiation. Allopurinol had litter effect on inhibiting ROS production at 4 hr but completely inhibited ROS production (green line) at 12 hr after HT29 cells were exposed to 5-FU, gemcitabine, or radiation. Similar observations were made with HeLa cells (data not shown).
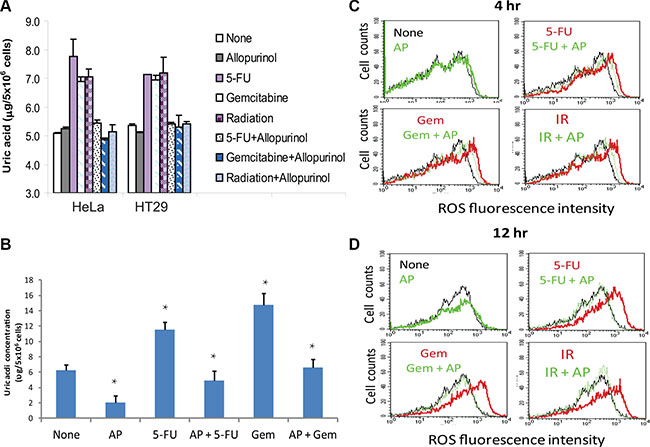
Figure 2: Allopurinol inhibits uric acid and ROS production. (A) Uric acid production in HeLa and HT29 cells. Cells were left untreated or treated with 5-FU (10 μM), gemcitabine (2 μM) or radiation (40 Gy) in the absence or presence of allopurinol for 24 hr. Intracellular uric acid concentrations were determined by analyzing cell extracts with a uric acid kit. (B) Uric acid production in RCAS-Neu cells. Cells were left untreated or treated with 5-FU (10 μM) or gemcitabine (2 μM) in the absence or presence of allopurinol for 24 hr. Uric acid was analyzed as described in Materials and Methods. The data in (A) and (B) represent the mean + standard deviation in triplicate from one of three experiments with similar results. (C and D) ROS production. HT29 cells were similarly treated and analyzed for ROS production by FACS analysis of DCF-DA-loaded cells at 4 (C) or 12 (D) hr. Black line, no treatment; Red line, genotoxic stress treatment; Green line, allopuinol alone or plus genotoxic stress treatment.
XOR is required for genotoxic stress-induced MICA/B expression
Genotoxic stress or DNA damage leads to increased NKG2D ligand expression [13, 36–39]. Consistent with these observations, we found that the levels of MICA and MICB transcripts were increased in HeLa and HT29 cells exposed to 5-FU (10 μM), gemcitabine (2 μM), and radiation (40 Gy) (Figure 3A). Allopuinol alone had no effect on MICA and MICB mRNA expression but blocked genotoxic stress-induced MICA and MICB mRNA expression (Figure 3B).
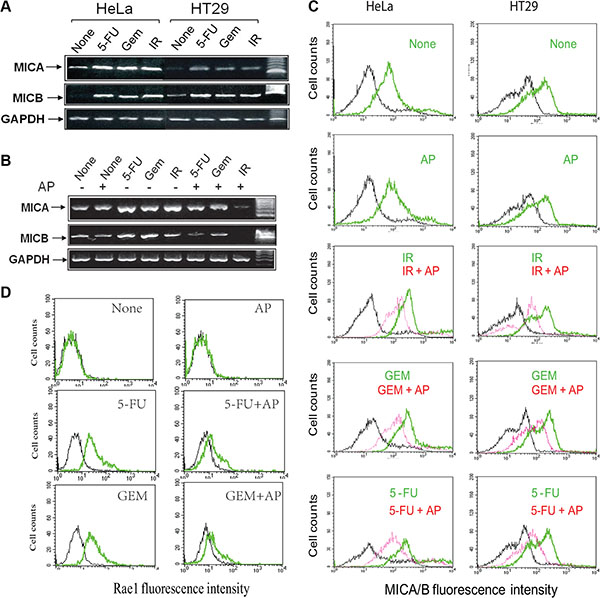
Figure 3: Allopurinol inhibits genotoxic stress-induced NKG2D ligand expression. (A) HeLa and HT29 cells were left untreated, or treated with 5-FU (10 μM), gemcitabine (2 μM) or radiation (40 Gy) for 16 hr and analyzed for mRNA levels of MICA, MICB, and GAPDH by RT-PCT. (B) Allopurinol blocks genotoxic stress-induced MICA/B gene expression. HT29 cells were left untreated or treated with allopurinol (250 μg/ml) for 1 hr, followed by treatment with 5-FU (10 μM) and gemcitabine (2 μM) for 24 hr or radiation (40 Gy). Cells were harvested and analyzed for MICA/B and GAPDH mRNA by RT-PCT. (C) Allopurinol blocks genotoxic stress-induced MICA/B expression. HeLa and HT29 cells were treated as in Figure 3B and analyzed for cell surface MICA/B levels by FACS. Black line, isotype control; Green line, MICA/B in the cells treated with gemcitabine, 5-FU, or radiation alone; Red line, MICA/B in the cells treated with gemcitabine, 5-FU, or radiation in the presence of allopurinol. (D) Allopurinol blocks genotoxic stress-induced Rae I expression. RCAS-Neu cells were treated as in Figure 3B and analyzed for Rae I levels by FACS.
We next conducted FACS analysis to examine MICA/B expression. As shown in Figure 3C, untreated control HeLa and HT29 cells (marked as None) expressed modest levels of MICA/B (green line). Antibody isotype control was shown in a black line in all histograms. 5-FU, gemcitabine (GEM), or radiation (IR) significantly increased MICA/B expression, as shown by the green line representing MICA/B-positive cells that significantly shifted to right side, compared to untreated control. Allopurinol had no effect on basal level MICA/B expression but blocked MICA/B expression in the cells exposed to 5-FU, gemcitabine, or radiation (red line) (Figure 3C).
RCAS-Neu cells, a murine breast cancer cell line, did not express Rae I (labeled as a green line) (comparing with isotype control, labeled as a black line) (Figure 3D) (left upper histogram). Consistently, 5-FU (10 μM) and gemcitabine (2 μM) increased Rae I expression (Figure 3D, left middle and bottom histograms respectively). AP blocked 5-FU- and gemcitabine-induced Rae I expression in RCAS-Neu cells (Figure 3D).
To verify the role of XOR in mediating genotoxic stress-induced MICA/B expression in tumor cells, we tested if XOR suppression also blocked genotoxic stress-induced MICA/B expression. XOR expression was readily detectable by immunofluorescene staining in control-miRNA- but not in XOR- miRNA-transfected HeLa cells (Figure 4A). Suppression of XOR expression was confirmed by Western blot (Figure 4B, inset). Uric acid production (Figure 4B) and MICA/B expression (Figure 4C) were increased in control-miRNA- but not XOR-miRNA-transfected HeLa cells treated with 5- FU, gemcitabine, and radiation (Figure 4B). Similar results were observed with HT29 cells transfected with control-miRNA and XOR-miRNA (data not shown). Knockdown of XOR in RCAS-Neu cells, as revealed by Western blot (Figure 4D), also led to the suppression of genotoxic stress-induced Rae I expression (Figure 4E).
Role of ROS in regulating MICA/B expression
We next tested whether induction of MICA/B expression in tumor cells under genotoxic stress was due to ROS production. N-acytelcysteine (NAC), an ROS scavenger, did not inhibit the induction of MICA/B expression in HT29 cells exposed to 5-FU or gemcitabine, but partially inhibited radiation-induced MICA/B expression in HT29 cells (Figure 5). NAC was able to completely scavenge ROS in HT29 cells exposed to 5-FU, gemcitabine or radiation (data not shown).
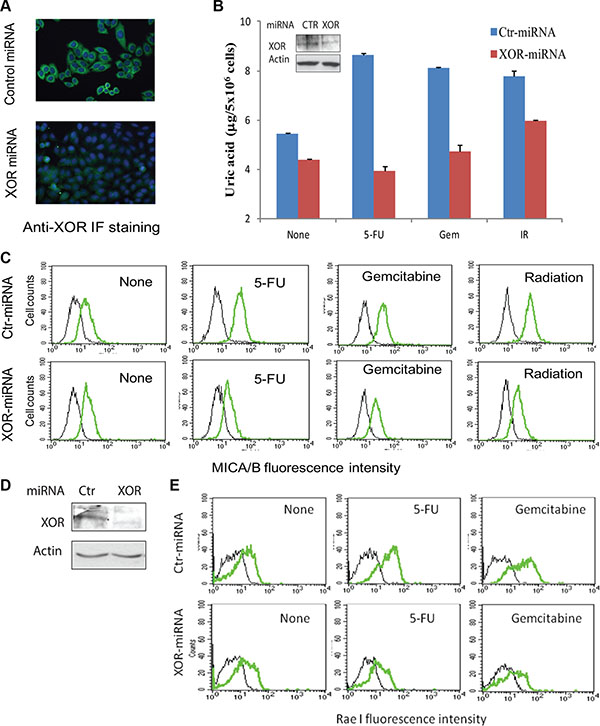
Figure 4: XOR suppression inhibits genotoxic stress-induced uric acid production and NKG2D ligand expression. (A) Immunofluorescence (IF) staining of XOR. HeLa cells stably transfected with control miRNA (Ctr-miRNA) or XOR-miRNA were analyzed for XOR expression by IF staining with an anti-XOR antibody as described in Figure 1A. Nuclei was stained with DAPI. (B and C) XOR knockdown blocks uric acid production and MICA/B expression. Ctr-miRNA and XOR-miRNA-transfected cells were exposed to 5-FU (10 μM), gemcitabine (2 μM), or radiation (40 Gy). Cells were harvested at 24 hr and analyzed for intracellular uric acid levels using a uric acid assay kit (B) or for MICA/B expression by FACS (C). Black line, isotype control; Green line, MICA/B. Inset in (B): XOR expression analyzed by Western blot. Actin was included as a loading control. (D) Western blot analysis of XOR expression in Ctr-miRNA- and XOR-miRNA-transfected RCAS-Neu cells. (E) XOR knockdown blocks genotoxic stress-induced Rae I expression. Ctr-miRNA- and XOR-miRNA-transfected RCAS-Neucells were exposed to 5-FU (10 μM) or gemcitabine (2 μM) and analyzed for Rae I expression 16 hr later by FACS analysis.
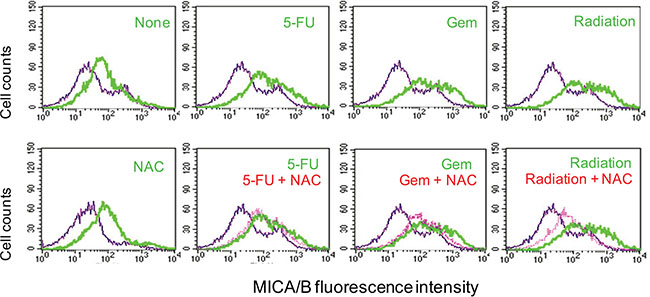
Figure 5: Effect of NAC on MICA/B expression. HT29 cells were preincubated with NAC (10 mM) for 1 hr and then left unstimulated or stimulated with 5-FU (10 μM), gemcitabine (2 μM), or radiation (40 Gy). Cells were harvested 16 hr later and then analyzed by FACS for MICA/B expression. Blue line, isotype control; Green line, MICA/B; Red line, MICA/B in the cells treated with NAC plus 5-FU, gemcitabine or radiation.
Uric acid induces NKG2D ligand expression
We next tested whether exogenous uric acid was able to induce MICA/B expression. Due to its acidity and poor solubility [40], uric acid was used in its sodium form, monosodium urate (MSU). MICA/B expression was induced in HeLa and HT29 cells (Figure 6A, upper panel) exposed to MSU (blue line) for 16 hr, compared to untreated control (red line). Isotype control is shown in a green line). MSU did not induce MHC class I expression in either cell line (Figure 6A, bottom panel). HT29 cells treated with MSU (250 μg/ml) expressed more MICA/B at 12 hr than at 24 and 48 hr (Figure 6B, bottom panels).
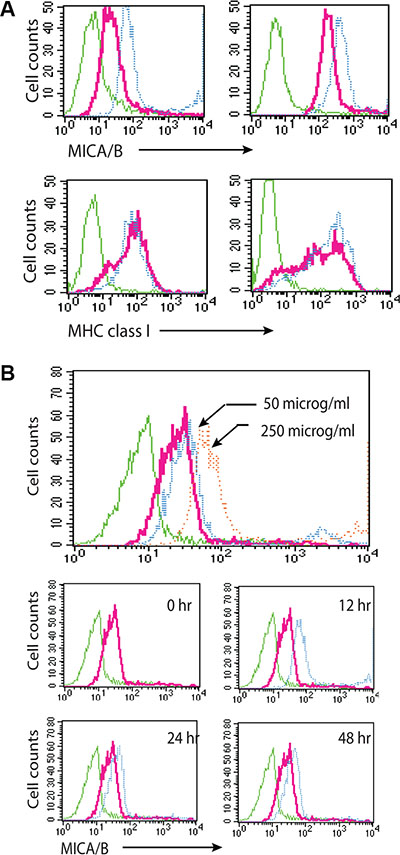
Figure 6: Uric acid induces MICA/B expression. (A) Induction of MICA/B expression by MSU in HT29 and HeLa cells. Cells grown in 6-well plates were stimulated with MSU or allopurinol and stained for MICA/B and MHC class I expression. (B) Time course and dose response of induction of MIC/B expression by MSU. Induction of MICA/B expression by MSU in HT29 cells incubated for 16 hr with 50 or 250 μg/ml MSU (upper histogram) or with 250 μg/ml MSU for the indicated time (middle and bottom histograms). Green line, isotype control for untreated cells; Red line, MICA/B in unstimulated cells; Blue line, MICA/B in MSU-treated cells. There was no difference in the isotype fluorescence between untreated and MSU-treated cells. MICA/B fluorescence in MSU-treated cells was overlayed on that of untreated control for comparison.
Uric acid-induced MICA/B expression is mediated by MAP kinase activation
Constitutive MAPK activation due to oncogene mutations such as RAS and BRAF plays an important role in inducing MICA/B expression [12, 14, 41]. MSU dramatically induced ERK1/2 phosphorylation in HeLa and HT29 cells peaked at 30–60 min after MSU addition (Figure 7A, left panel) and in a dose-dependent manner (Figure 7A, right panel). PD98059 (50 μM) and U0126 (2 μM) inhibited the expression of MSU-induced MICA/B expression in HT29 and HeLa cells (Figure 7B). The inhibitor of p38 MAP kinase, SB202180 (2 μM), also inhibited MSU-induced MICA/B expression, though p38 activation was not detected in these two cell lines (data not shown), probably due to the low sensitivity of the antibody against p38. PD98059 plus SB202180 did not block MICA/B expression more than either inhibitor alone. SP600125 (20 μM), an inhibitor of JNK, did not inhibit MICA/B expression in MSU- stimulated HT29 and HeLa cells.
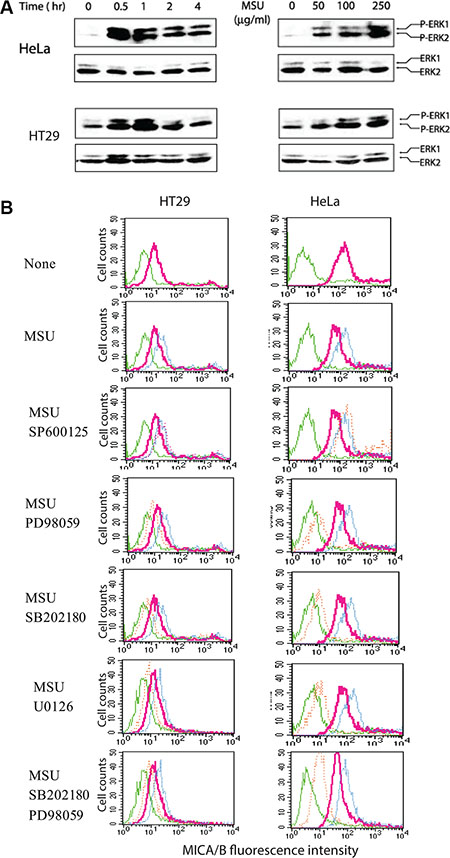
Figure 7: Activation of the MAP kinase pathway is required for uric acid-induced MICA/B expression. (A) MSU induces ERK1/2 phosphorylation. HeLa and HT29 cells starved overnight in the serum-free medium were left unstimulated or stimulated with MSU (250 μg/ml) for the indicated time (left panel) or for 30 min with the indicated concentrations (right panel). Cells were harvested and analyzed for ERK1/2 phosphorylation by Western blot with an antibody against phosphorylated and total ERK1/2 (A). (B) Inhibition of MSU-induced MICA/B expression by MAP kinase inhibitors. HeLa and HT29 cells were left unstimulated or stimulated with MSU (250 μg/ml) in the absence or presence of the indicated inhibitors for 16 hr. Cells were harvested and analyzed for MICA/B expression by FACS. Green line, isotype control; Red line, MICA/B in the cells with no inhibitors; Blue line, MICA/B in the cells treated with MSU; Orange line, MICA/B in the cells treated with MSU plus the indicated inhibitors.
Intracellular uric acid concentrations in MSU-treated cells
To determine if exogenous MSU used in our study was physiologically relevant, we tested if MSU was taken into the cytoplasm and reached the concentrations equivalent to that in the cells exposed to genotoxic stress. As shown in Figure 8A, intracellular uric acid concentrations reached up to 20 μg/5 × 106 cells at 4 hr after MSU addition (250 μg/ml). Intracellular uric acid levels were increased in HT29 and HeLa cells but only slightly increased in A375 cells. Interestingly, MSU only slightly induced MICA/B expression (Figure 8B) and ERK1/2 phosphorylation (Figure 8C) in A375 cells.
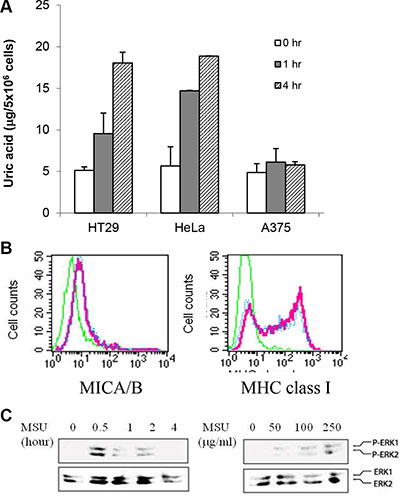
Figure 8: Increased intracellular uric acid levels in MSU-treated cells. (A) Uric acid uptake. HeLa, HT29, and A375 cells were treated with MSU (250 mg/ml) for 1 or 4 hr. Cell extracts were analyzed for intracellular uric acid concentrations. (B) Inability of MSU to induce MICA/B expression in A375 cells. A375 cells were treated with MSU (250 mg/ml) for 24 hr and analyzed for MICA/B or MHC class I expression by FACS. (C) Inability of MSU to induce MAP kinase activation in A375 cells. A375 cells were treated with MSU (250 mg/ml) for 30 min and analyzed for MAP kinase activation by Western blot with anti-phospho and total ERK antibodies.
Uric acid accumulation precedes genotoxic stress-induced MICA/B expression and MAP kinase activation
To further investigate the role of uric acid production in mediating genotoxic stress-induced MICA/B expression, we conducted a time-course assay to examine the correlation between uric acid accumulation and MICA/B expression. Both MICA/B expression and ROS levels was slightly increased at 4 and 8 hr but was boosted at 16 and 24 hr (Figure 9A and 9B). Uric acid started to accumulate at 8 hr but peaked at 16 hr in gemcitabine-treated cells and further increased in 5-FU-treated and irradiated cells at 24 and 32 hr (Figure 9C). 5-FU, gemcitabine, and irradiation induced uric acid accumulation in a dose-dependent manner (Figure 9C). Correspondingly, induction of ERK1/2 phosphorylation was detected at 16 hr in HT29 cells exposed to 5-FU, gemcitabine, and irradiation (Figure 9D). Induction of ERK1/2 phosphorylation in HT29 cells by 5-FU, gemcitabine, or radiation was also dose-dependent (Figure 9D).
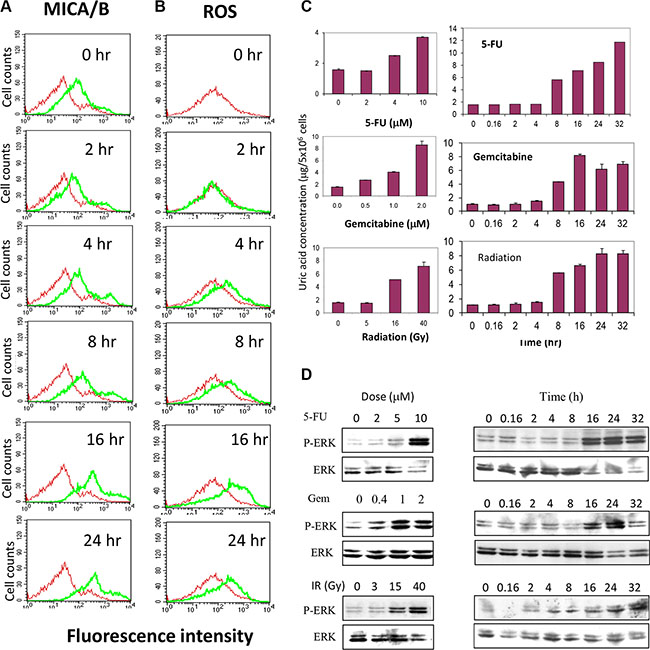
Figure 9: Temporal induction of MICA/B expression, MAP kinase activation, ROS and uric acid production. HT29 cells seeded in 6-well plates were treated with gemcitabine (2 μM) for the indicated time. Cells were harvested and analyzed for MICA/B expression (A) or ROS production (B). (C and D) Dose- and time-dependent uric acid production and ERK phosphorylation. HT29 cells seeded in 6-well plates were left unstimulated or stimulated with the indicated concentrations of 5-FU, gemcitabine, or radiation for 20 hr or treated with 5-FU (10 μM) and gemcibatine (2 μM) or after irradiation (40 Gy) for the indicated time. Intracellular uric acid concentrations were determined by analyzing the cell extracts with a uric acid kit (C). MAP kinase activation was analyzed by Western blot with anti-phospho and total ERK1/2 antibodies (D).
Uric acid accumulation is required for genotoxic stress-induced MAP kinase activation
We next tested whether inhibition of XOR activity by allopurinol led to the inhibition of ERK1/2 phosphorylation in tumor cells undergoing genotoxic stress. As shown in Figure 10A, ERK phosphorylation was induced in HeLa and HT29 cells when analyzed at 24 hr after exposure to 5-FU, gemcitabine, and radiation. Allopurinol completely blocked the induction of ERK1/2 phosphorylation in these cells (Figure 10A). We next tested if ROS had a role in genotoxic stress-induced MAPK activation. As shown in Figure 10B, NAC failed to suppress ERK phosphorylation in 5-FU- and gemcitabine-treated HT29 cells but partially inhibited the activation of EKR phosphorylation in HT29 cells exposed to radiation. Moreover, H2O2 (100 μM) weakly induced ERK phosphorylation in HT29 cells (Figure 10B).
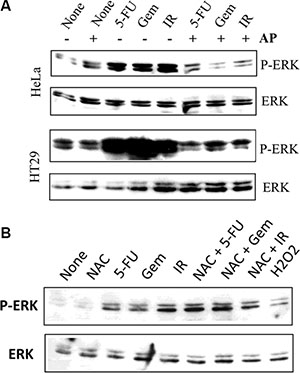
Figure 10: Allopurinol inhibits genotoxic stress-induced MAP kinase activation. (A) Allopurinol inhibits MAP kinase activation. HeLa and HT29 cells were left untreated or pretreated with allopurinol (250 μg/ml) for 1 hr, followed by stimulation with gemcitabine (2 μM), 5-FU (10 μM), or radiation (40 Gy). After incubation for 24 hr, cells were harvested and analyzed for ERK1/2 phosphorylation and total ERK with an anti-ERK1/2 antibody. (B) The effect of NAC on genotoxic stress-induced ERK phosphorylation. HT29 cells were exposed to 5-FU (10 μM), gemcibatine (2 μM), irradiation (40 Gy) or H2O2 (100 μM) for 16 hr in the absence or presence of 10 mM NAC. ERK1/2 phosphorylation was analyzed by Western blot. Equal loading of the cell lysates was confirmed by probing with an anti-ERK1/2 antibody in a separate membrane.
XOR plays an important role in genotoxic stress-mediated antitumor activity
Finally we conducted an orthotopic mouse model of breast cancer by injection of RCAS-Neu cells into the fat pad of the mammary glands. In untreated mice, Ctr-miRNA-transfected RCAS-Neu tumors grew slightly faster than XOR-miRNA-transfected tumors. Statistical analysis revealed that there was no significant difference (p = 0.056) in tumor growth rate between Ctr-miRNA and XOR-miRNA-transfected tumors (Figure 11A). Gemcitabine treatment significantly inhibited the growth of Ctr-miRNA-transfected RCAS-Neu tumors, compared to saline treated group (p = 0.011). Surprisingly, gemcitabine treatment had no effect on the growth of XOR-miRNA-transfected RCAS-Neu tumors (Figure 11A). Gemcitabine treatment significantly decreased the weight of Ctr-miRNA-transfected RCAS-Neu tumors but had no effect on the weight of XOR-miRNA-transfected RCAS-Neu tumors (Figure 11B), compared to their untreated counterparts. This experiment was repeated twice with almost identical results.
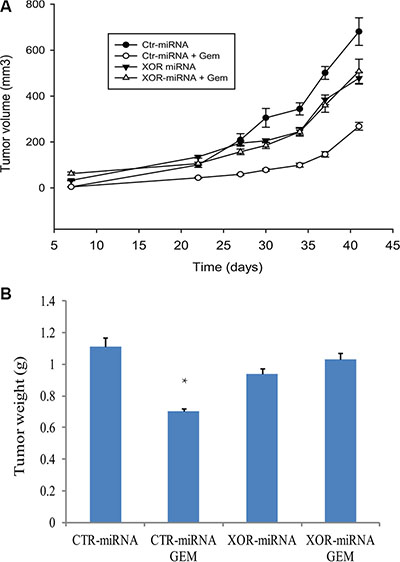
Figure 11: XOR knockdown ameliorates GEM-mediated antitumor activity. (A) Differential effect of gemcitabine on the growth of Ctr-miRNA- and XOR-miRNA-transfected RCAS-Neu tumors. Female FVB mice (6-7-wks-old; 6 mice/group) were treated with saline or gemcitabine on day 1, 7, 14 days after intraductal injection of Ctr-miRNA- or XOR-miRNA-transfected cells (5 × 10⁵ cells/mouse). Tumor volumes were calculated and statistically analyzed. The growth of Ctr-miRNA-transfected tumors: saline vs. gemcitabine, p = 0.011; The growth of XOR-miRNA-transfected tumors: saline vs. gemcitabine, p = 0.501; The growth between Ctr-miRNA- and XOR-miRNA-transfected tumors, p = 0.056. (B) Differential effect of gemcitabine on tumor weight. Mice were sacrificed on day 42 after tumor cell injection. Tumors were collected and weighed. The differences in tumor weight between various groups were analyzed by using a Student t test. ** The p value compared to untreated control, < 0.05.
DISCUSSION
Our study provides several lines of evidence showing that uric acid production was responsible for the genotoxic stress-induced NKG2/D ligand expression: 1) Inhibition of XOR activity by allopurinol or XOR expression by XOR miRNA abrogated the genotoxic stress-induced NKG2D ligand expression, MAP kinase activation, and uric acid production; 2) Exogenous uric acid induced MICA/B expression; 3) Intracellular uric acid concentrations in MSU-treated cells were comparable to that in the cells exposed to genotoxic stress; 4) A375 cells that failed to uptake uric acid did not respond to MSU to induce MICA/B expression and to activate the MAP pathway. Of note, induction of MICA/B expression in HT29 cells undergoing genotoxic stress lagged behind uric acid accumulation. It makes sense since increased MICA/B expression was likely due to the transcriptional regulation mediated by AP-1 through the MAP kinase activation.
Mechanistic study revealed that genotoxic stress induced MICA/B expression by uric acid-mediated MAP kinase activation. Several lines of evidence support this supposition: 1) Exogenous MSU rapidly activated the MAP kinase pathway (Figure 7A); The inhibition of the MAP kinase pathway blocked MSU-induced MICA/B expression; 2) Inhibition of uric acid production by allopurinol in tumor cells undergoing genotoxic stress inhibited MAP kinase activation (Figure 10) and MICA/B expression (Figure 3); 3) We and others showed that RAS and BRAF oncogene mutation and activation leads to increased MICA/B expression [12, 14]; 4) The promoters of both the MICA and MICB genes contain a putative AP-1 site [18]. AP-1 is involved in regulating mouse NKG2D ligand gene expression [42]. It should be noted that MSU also activates other signaling molecules such as the proline-rich tyrosine kinase 2, p38 MAP kinase pathway, and NF-κB [43]. NF-κB induces MICA/B expression in activated T cells [44–46]. The signaling molecules and the transcription factors other than the MAP kinase pathway-activated AP-1, such as NF-κB, may also contribute to MSU-induced MICA/B gene expression.
While our data collectively suggest that uric acid produced by XOR plays a critical role in mediating genotoxic stress-induced NKG2D ligand expression, several questions remain to be answered: 1) it is not clear if MSU enters cells through endocytosis by binding the cell membrane lipids in a receptor-independent manner [47] or through uric acid transporter such as GLUT9 or URAT1 [48]; 2) The mechanisms by which increased concentrations of intracellular uric acid activate the MAP kinase pathway are not clear; 3) It is also not clear if uric acid produced in DNA-damaged cells can form precipitates to act like uric acid crystals.
Prior studies have shown that ROS induces MICA/B expression by activating the promoters of the MICA and MICB genes [17–20]. Another study showed that ROS induces MICB and ULBP1 expression in human airway epithelial cells, in part by increasing the transcripts of MICB and ULBP1 and by increasing the translocation of these NKG2D ligands to the cell surface [49]. ROS production is a well observed phenomenon in tumor cells exposed to genotoxic drugs and radiation. We found that ROS scavenging did not block the induction of MICA/B expression in cells exposed to 5-FU or gemcitabine but partially blocked the induction of MICA/B expression in these cells exposed to radiation at 16 hr (Figure 5). Exogenous hydrogen peroxide had only a minor effect on MICA/B expression (data not shown). These observations suggest that ROS production plays a minor or redundant role in inducing MICA/B expression in the tumor cell lines used in our study. This is particularly true that in the early phase of genotoxic stress, MICA/B expression was slightly increased in the absence of uric acid production whereas ROS levels were increased, which was independent of XOR (Figure 9). ROS may play a critical role in inducing NKG2D ligand expression in XOR-negative tumor cells undergone genotoxic stress.
Patients with XOR-negative breast and lung cancers are associated with a poor prognosis [28, 31]. Fini et al. [50] reported that two of three XOR inhibitors, oxypurinol and Y-700, but not allopurinol, modestly but significantly promote the growth of MDA-231 breast cancer in a xenograft mouse model. We found that XOR-miRNA-transfected RCAS-Neu tumors did not grow significantly slower than Ctr-miRNA-transfected RCAS-Neu tumors (Figure 11A). Interestingly, gemcitabine treatment inhibited the growth of Ctr-miRNA-transfected but not XOR-miRNA-transfected RCAS-Neu breast tumors (Figure 11B). We speculate that gemcitabine-mediated antitumor activity in this syngeneic breast cancer model is mediated by the induction of antitumor immunity through increased NKG2D ligand expression. In support of this notion, ectopic expression of the murine NKG2D ligands Rae1β or H60 in tumor cell lines results in potent rejection of the tumor cells [51]; Inhibition of XOR activity by allopurinol blocks tumor rejection in a syngeneic mouse model [35]. Moreover, a recent study showed that the shed form of MULT1, a high-affinity NKG2D ligand, activates NK cells and causes tumor rejection in part by competitively reversing a global desensitization of NK cells imposed by engagement of membrane NKG2D ligands on tumor-associated cells [52]. These observations collectively suggest that increased NKG2D ligand expression following genotoxic drugs or radiation and the subsequent antitumor immunity may contribute to their therapeutic effects.
In summary, our study showed that genotoxic stress-induced NKG2D ligand expression in tumor cell lines was largely mediated by increased intracellular uric acid concentrations through XOR. Uric acid induced NKG2D ligand expression by activating the MAP kinase pathway. XOR plays an important role in gemcitabine-mediated antitumor activity in a murine breast cancer model.
MATERIALS AND METHODS
Reagents and cell lines
Uric acid, allopurinol, 5- fluorouracil, and N-acetylcysteine (NAC) were purchased from Sigma (St. Louis, MO). MSU crystals were prepared as previously described [53]. Briefly, supersaturated uric acid solutions (4–5 mg/ml) in 0.1 M borate (pH 8.5) were left at room temperature for 72 h. The precipitate of MSU crystals were spin down and followed by washing with alcohol and acetone once. MSU crystals were air-dried and reconstituted in saline. SB202180 and PD98059 were purchased from Calbiochem (San Diego, CA). U026, anti-phospho ERK1/2, and anti-ERK1/2 antibodies were purchased from Cell Signaling Technology, Inc. (Beverly, MA). SP600125 was purchased from Creswood Technology Group (Yonker, NY). 2,7- dichlorodihydrofluorescin diacetate (DCF-DA) was purchased from Molecular Probes, Inc. (Eugene, OR). Gemcitabine (Gemzar, Eli Lilly, Indianapolis, IN) was purchased as a lyophilized powder and reconstituted in saline at the concentration of 130 μM. Radiation was conducted by exposing cells to a 137Cs resource in a CIS Biointernational generator at a rate of 1.45 Gy per minute. Anti-MICA/B mAb (Clones 6D4) was produced as previously described [3, 5, 6, 54]. FITC conjugated anti- HLA-ABC class I antibody (clone W6/32) were purchased from Serotec Ltd., (Oxford, UK). FITC conjugated anti-Pan-Rae1 antibody was purchased from R&D Systems. HT29, a human colon cancer cell line (originally MRO87 cells), was kindly provided by Dr. Kenneth B. Ain (University of Kentucky Medical Center, KY). HeLa (a human cervical cancer cell line) and A375 (a human melanoma cell line) cells were purchased from the American Tissue Culture Collection (Manassas, VA). RCAS-Neu cells are a murine breast cancer cell line that is derived from a breast cancer induced in TVA transgenic mice through intraductal injection of an avian retroviral vector encoding a mutant rat Neu oncogene [55]. RCAS-Neu and HT29 cells were grown in complete RPMI 1640 medium containing 10% fetal bovine serum. HeLa and A375 cells were grown in DMEM with 10% fetal bovine serum.
RT-PCR
A forward primer 5- ATGCCCCAGTCC-TCCAGA GCTCAG-3 (start at nucleotide 453, A of the translation start codon ATG is designated as nucleotide 1) and a reverse primer 5′- GTGGCATCCCTGTGGTCACTCGTC- 3′ (end at nucleotide 1088) were used to amplify a 636- bp PCR fragment of the MICA gene. A forward primer 5′- GGCGTCAGGATGGGGTATCTTTGA- 3′ (start at nucleotide 716) and a reverse primer 5′- GGCAG GAGCAGTCGTGAGTTTGCC- 3′ (end at nucleotide 1429) were used to amplify a 714-bp PCR fragment of the MICB gene. Oligonucleotides 5′-TGAAGG- TCGGAGT CAACG-GATTTGGTC- 3′ and 5′- ATGGACTGTGGTC ATGAGTCC TTCCACG- 3′ were used to amplify a 527-bp GAPDH DNA fragment. The PCR reaction was set with an initial denaturation of 2 min at 94°C and subsequent denaturation for 45 s at 94°C, annealing for 45 s at 55°C, and extension for 1 min at 72°C. Thirty cycles were used to amplify the PCR product.
XOR knockdown
The XOR hairpin DNA oliognucleotides were synthesized and cloned into a microRNA expression vector, pcDNA6.2/GW-miR according to manufacturer’s instruction (Invitrogen, Carlsbad, CA). The sequences for oligonucleotides that target XOR mRNA were 5′- TGCTGTGATGATGTTCCCTCCAACGGGTTTT GGCCACTGACTGACCCGTTGGAGAACATCATCA- 3′ and 5′-CCTGTGATGATGTTCTCCAACGGGTCAGTCA GTGGCCAAAACCCGTTGGGGGAACATCATCAC- 3′. The sequences of the inserted oligonucleotides were verified by DNA sequencing. Two pairs of primers that target murine XOR RNA at nucleotide position 1261 and 1395 were cloned into the same vector. XOR miRNA targeting nucleotide position 1395 was used in whole study. The same expression vector encoding a miRNA sequence targeting β-galactosidase was included as a negative control. HeLa and HT29 cells were transfected with control or XOR miRNA and screened in the media containing blasticidin (10 μg/ml). Pools of stable colonies were analyzed for XOR expression by IF staining and Western blot.
Immuofluorescence (IF) staining
XOR expression was detected by IF staining with a rabbit anti-XOR rabbit antibody (Rockland Immunologicals, Inc., Bertsville, PA) (1:100) and examined under a fluorescence microscope. The pictures were taken with a digital camera connected to Olympus BX41TF fluorescence microscope.
Flow cytometric analysis
MICA/B expression was stained as previously described [12] and analyzed in a fluorescence-activated cell-sorter scanner (Becton Dickinson, Palo Alto, CA) and Cell Quest software.
Quantification of uric acid
Cells were lysed in the buffer containing Tris-HCl, 50 mM, pH 8.0; 2 mM EDTA, 1% Triton X-100 and followed by a 10-second homogenization. The lysates were incubated on ice for 30 min and then spun down at 2000 g for 15 min. The supernatants were collected and analyzed for uric acid concentration by using a uric acid kit (BioAssay Systems, Hayward, CA). The difference in uric acid concentrations from the cells with different treatment was statistically analyzed by using an unpaired Student t test.
ROS measurements
Cells were pretreated with 5-FU, gemcitabine, or radiation for the indicated lengths of time in the absence or presence of allopurinol or N-acytelcysteine (NAC) or gluthione which were added 1 hr prior to the exposure to MSU, 5-FU, gemcitabine, or radiation. Cells were harvested and then loaded with fluoroscein dye DCF-DA (20 nM) at 37ºC for 15 min, followed by FACS analysis for intracellular ROS levels.
Western blot
Cells were harvested and analyzed for MAP kinase activation by Western blot with an antibody against phosphor-ERK1/2. The membranes were stripped and reprobed with an anti-ERK1/2 antibody to ascertain equal loading of the cell lysates. XOR was detected with a rabbit antiserum (Lifespan BioScience, Inc., Seattle, WA). Actin was detected as a loading control with a monoclonal antibody (Santa Cruz Biotechnology, Inc., San Diego, CA).
Orthotopic breast cancer model
The study was carried out in strict accordance with the recommendations in the Guide for the Care and Use of Laboratory Animals of the National Institutes of Health. The protocol was approved by the Institutional Animal Care and Use Committee of Rush University Medical Center. Female FVB mice (6–7-wks-old; 6 mice/group) were inoculated with Ctr-miRNA- or XOR-miRNA-transfected RCAS-Neu cells (5 × 10⁵ cells in 50 μl/mouse) by injection into the fat pad and treated with saline or gemcitabine (160 mg/kg body weight) by intraperitoneal injection on day 1, 7, 14 days. Tumor volumes were determined by caliper measurement, twice a week, and calculated based on the formula: length × width2 × π ÷ 6. Mice were sacrificed on day 42. Tumors were collected and weighed. The differences in tumor volumes were statistically analyzed by using the one-way repeated measure ANOVA. The differences in tumor weight were analyzed by using an unpaired Student t test. The p value of < 0.05 was considered statistically significant.
Abbreviations
5-FU, 5-fluorouracil; AP, allopurinol; DCF-DA, 2,7-dichlorodihydrofluorescin diacetate; ERK, extracellular signal-regulated protein kinase; FACS, fluorescence-activated cell- sorter; Gem, gemcitabine; IR, ionizing radiation; MAP, mitogen-activated protein; MAPK, MAP kinase; MICA/B, major histocompatibility complex class I-related chain A and B; MHC, major histocompatibility complex; MSU, monosodium urate; NAC, N-acytelcysteine; NK, natural killer; ROS, reactive oxygen species; XOR, xanthine oxidoreductase.
ACKNOWLEDGMENTS
We thank Dr. Kenneth B. Ain (University of Kentucky Medical Center, KY) for kindly providing MRO87 tumor cell line, Dr. Veronika Groh (Fred Hutchinson Cancer Research Center, University of Washington, Seattle, WA) for kindly providing anti-MICA/B mAb (Clones 6D4), Ms. Xue Bai for technical help.
CONFLICTS OF INTEREST
The authors declare that there is no conflict of interest that could be perceived as prejudicing the impartiality of the research reported.
FUNDING
This work was supported in part by the Piccolo Family Foundation (to XX), the Susan G. Komen Breast Cancer Research Foundation (to XX), a start-up fund (XX) from the College of Veterinary Medicine, Yangzhou University, and the Priority Academic Program Development of Jiangsu Higher Education Institutions.
REFERENCES
1. Raulet DH. Roles of the NKG2D immunoreceptor and its ligands. Nat Rev Immunol. 2003; 3:781–90.
2. Eagle RA, Trowsdale J. Promiscuity and the single receptor: NKG2D. Nat Rev Immunol. 2007; 7:737–44.
3. Groh V, Bahram S, Bauer S, Herman A, Beauchamp M, Spies T. Cell stress-regulated human major histocompatibility complex class I gene expressed in gastrointestinal epithelium. Proc Natl Acad Sci USA. 1996; 93:12445–50.
4. Groh V, Rhinehart R, Secrist H, Bauer S, Grabstein KH, Spies T. Broad tumor-associated expression and recognition by tumor-derived gamma delta T cells of MICA and MICB. Proc Natl Acad Sci USA. 1999; 96:6879–84.
5. Groh V, Steinle A, Bauer S, Spies T. Recognition of stress-induced MHC molecules by intestinal epithelial gammadelta T cells. Science. 1998; 279:1737–40.
6. Groh V, Wu J, Yee C, Spies T. Tumour-derived soluble MIC ligands impair expression of NKG2D and T-cell activation. Nature. 2002; 419:734–8.
7. Pende D, Cantoni C, Rivera P, Vitale M, Castriconi R, Marcenaro S, Nanni M, Biassoni R, Bottino C, Moretta A, Moretta L. Role of NKG2D in tumor cell lysis mediated by human NK cells: cooperation with natural cytotoxicity receptors and capability of recognizing tumors of nonepithelial origin. Eur J Immunol. 2001; 31:1076–86.
8. Wu JD, Higgins LM, Steinle A, Cosman D, Haugk K, Plymate SR. Prevalent expression of the immunostimulatory MHC class I chain-related molecule is counteracted by shedding in prostate cancer. J Clin Invest. 2004; 114:560–8.
9. Boissel N, Rea D, Tieng V, Dulphy N, Brun M, Cayuela JM, Rousselot P, Tamouza R, Le Bouteiller P, Mahon FX, Steinle A, Charron D, Dombret H, et al. BCR/ABL oncogene directly controls MHC class I chain-related molecule A expression in chronic myelogenous leukemia. J Immunol. 2006; 176:5108–16.
10. Routes JM, Ryan S, Morris K, Takaki R, Cerwenka A, Lanier LL. Adenovirus serotype 5 E1A sensitizes tumor cells to NKG2D-dependent NK cell lysis and tumor rejection. J Exp Med. 2005; 202:1477–82.
11. Cebo C, Da Rocha S, Wittnebel S, Turhan AG, Abdelali J, Caillat-Zucman S, Bourhis JH, Chouaib S, Caignard A. The decreased susceptibility of Bcr/Abl targets to NK cell-mediated lysis in response to imatinib mesylate involves modulation of NKG2D ligands, GM1 expression, and synapse formation. J Immunol. 2006; 176:864–72.
12. Xu X, Rao G, Gaffud MJ, Ding HG, Maki G, Klingemann HG, Groh V, Spies T, Caillat-Zucman S, Gattuso P, Plate J, Prinz RA. Clinicopathologic significance of major histocompatibility complex class I-related chain A and B (MICA/B) expression in thyroid cancer. J Clin Endocrinol Metab. 2006; 91:2704–12.
13. Gasser S, Orsulic S, Brown EJ, Raulet DH. The DNA damage pathway regulates innate immune system ligands of the NKG2D receptor. Nature. 2005; 436:1186–90.
14. Liu XV, Ho SS, Tan JJ, Kamran N, Gasser S. Ras activation induces expression of raet1 family NK receptor ligands. J Immunol. 2012; 189:1826–34.
15. Morisaki T, Onishi H, Koya N, Kiyota A, Tanaka H, Umebayashi M, Ogino T, Nagamatsu I, Katano M. Combinatorial cytotoxicity of gemcitabine and cytokine-activated killer cells in hepatocellular carcinoma via the NKG2D-MICA/B system. Anticancer Res. 2011; 31:2505–10.
16. Xu X, Rao GS, Groh V, Spies T, Gattuso P, Kaufman HL, Plate J, Prinz RA. Major histocompatibility complex class I-related chain A/B (MICA/B) expression in tumor tissue and serum of pancreatic cancer: role of uric acid accumulation in gemcitabine-induced MICA/B expression. BMC Cancer. 2011; 11:194.
17. Yamamoto K, Fujiyama Y, Andoh A, Bamba T, Okabe H. Oxidative stress increases MICA and MICB gene expression in the human colon carcinoma cell line (CaCo-2). Biochim Biophys Acta. 2001; 1526:10–2.
18. Venkataraman GM, Suciu D, Groh V, Boss JM, Spies T. Promoter region architecture and transcriptional regulation of the genes for the MHC class I-related chain A and B ligands of NKG2D. J Immunol. 2007; 178:961–9.
19. Soriani A, Iannitto ML, Ricci B, Fionda C, Malgarini G, Morrone S, Peruzzi G, Ricciardi MR, Petrucci MT, Cippitelli M, Santoni A. Reactive oxygen species- and DNA damage response-dependent NK cell activating ligand upregulation occurs at transcriptional levels and requires the transcriptional factor E2F1. J Immunol. 2014; 193:950–60.
20. Morelli MB, Amantini C, Santoni M, Soriani A, Nabissi M, Cardinali C, Santoni A, Santoni G. Axitinib induces DNA damage response leading to senescence, mitotic catastrophe, and increased NK cell recognition in human renal carcinoma cells. Oncotarget. 2015; 6:36245–59. doi: 10.18632/oncotarget.5768.
21. Le Bert N, Lam AR, Ho SS, Shen YJ, Liu MM, Gasser S. STING-dependent cytosolic DNA sensor pathways regulate NKG2D ligand expression. Oncoimmunology. 2014; 3:e29259.
22. Lam AR, Le Bert N, Ho SS, Shen YJ, Tang ML, Xiong GM, Croxford JL, Koo CX, Ishii KJ, Akira S, Raulet DH, Gasser S. RAE1 ligands for the NKG2D receptor are regulated by STING-dependent DNA sensor pathways in lymphoma. Cancer Res. 2014; 74:2193–203.
23. Harrison R. Structure and function of xanthine oxidoreductase: where are we now? Free Radic Biol Med. 2002; 33:774–97.
24. Shi Y, Evans JE, Rock KL. Molecular identification of a danger signal that alerts the immune system to dying cells. Nature. 2003; 425:516–21.
25. Shi Y, Rock KL. Cell death releases endogenous adjuvants that selectively enhance immune surveillance of particulate antigens. Eur J Immunol. 2002; 32:155–62.
26. Shi Y, Zheng W, Rock KL. Cell injury releases endogenous adjuvants that stimulate cytotoxic T cell responses. Proc Natl Acad Sci USA. 2000; 97:14590–5.
27. Linder N, Haglund C, Lundin M, Nordling S, Ristimaki A, Kokkola A, Mrena J, Wiksten JP, Lundin J. Decreased xanthine oxidoreductase is a predictor of poor prognosis in early-stage gastric cancer. J Clin Pathol. 2006; 59:965–71.
28. Linder N, Lundin J, Isola J, Lundin M, Raivio KO, Joensuu H. Down-regulated xanthine oxidoreductase is a feature of aggressive breast cancer. Clin Cancer Res. 2005; 11:4372–81.
29. Linder N, Martelin E, Lapatto R, Raivio KO. Posttranslational inactivation of human xanthine oxidoreductase by oxygen under standard cell culture conditions. Am J Physiol Cell Physiol. 2003; 285:C48–55.
30. Linder N, Martelin E, Lundin M, Louhimo J, Nordling S, Haglund C, Lundin J. Xanthine oxidoreductase - clinical significance in colorectal cancer and in vitro expression of the protein in human colon cancer cells. Eur J Cancer. 2009; 45:648–55.
31. Kim AW, Batus M, Myint R, Fidler MJ, Basu S, Bonomi P, Faber LP, Wightman SC, Warren WH, McIntire M, Arvanitis LD, Gattuso P, Xu X, et al. Prognostic value of xanthine oxidoreductase expression in patients with non-small cell lung cancer. Lung Cancer. 2011; 7:186–90.
32. Battelli MG, Polito L, Bortolotti M, Bolognesi A. Xanthine oxidoreductase in cancer: more than a differentiation marker. Cancer Med. 2015.
33. Gibbings S, Elkins ND, Fitzgerald H, Tiao J, Weyman ME, Shibao G, Fini MA, Wright RM. Xanthine oxidoreductase promotes the inflammatory state of mononuclear phagocytes through effects on chemokine expression, peroxisome proliferator-activated receptor-{gamma} sumoylation, and HIF-1{alpha}. J Biol Chem. 2011; 286:961–75.
34. Rock KL, Kataoka H, Lai JJ. Uric acid as a danger signal in gout and its comorbidities. Nat Rev Rheumatol. 2013; 9:13–23.
35. Hu DE, Moore AM, Thomsen LL, Brindle KM. Uric acid promotes tumor immune rejection. Cancer Res. 2004; 64:5059–62.
36. Bedel R, Thiery-Vuillemin A, Grandclement C, Balland J, Remy-Martin JP, Kantelip B, Pallandre JR, Pivot X, Ferrand C, Tiberghien P, Borg C. Novel role for STAT3 in transcriptional regulation of NK immune cell targeting receptor MICA on cancer cells. Cancer Res. 2011; 71:1615–26.
37. Fine JH, Chen P, Mesci A, Allan DS, Gasser S, Raulet DH, Carlyle JR. Chemotherapy-induced genotoxic stress promotes sensitivity to natural killer cell cytotoxicity by enabling missing-self recognition. Cancer Res. 2010; 70:7102–13.
38. Hervieu A, Rebe C, Vegran F, Chalmin F, Bruchard M, Vabres P, Apetoh L, Ghiringhelli F, Mignot G. Dacarbazine-Mediated Upregulation of NKG2D Ligands on Tumor Cells Activates NK and CD8 T Cells and Restrains Melanoma Growth. J Invest Dermatol. 2013; 133:499–508.
39. Khallouf H, Marten A, Serba S, Teichgraber V, Buchler MW, Jager D, Schmidt J. 5-Fluorouracil and interferon-alpha immunochemotherapy enhances immunogenicity of murine pancreatic cancer through upregulation of NKG2D ligands and MHC class I. J Immunother. 2012; 35:245–53.
40. Shi Y, Mucsi AD, Ng G. Monosodium urate crystals in inflammation and immunity. Immunol Rev. 2010; 233:203–17.
41. Ho SS, Gasser S. NKG2D ligands link oncogenic RAS to innate immunity. Oncoimmunology. 2013; 2:e22244.
42. Nausch N, Florin L, Hartenstein B, Angel P, Schorpp-Kistner M, Cerwenka A. Cutting edge: the AP-1 subunit JunB determines NK cell-mediated target cell killing by regulation of the NKG2D-ligand RAE-1epsilon. J Immunol. 2006; 176:7–11.
43. Liu R, Liote F, Rose DM, Merz D, Terkeltaub R. Proline-rich tyrosine kinase 2 and Src kinase signaling transduce monosodium urate crystal-induced nitric oxide production and matrix metalloproteinase 3 expression in chondrocytes. Arthritis Rheum. 2004; 50:247–58.
44. Molinero LL, Fuertes MB, Girart MV, Fainboim L, Rabinovich GA, Costas MA, Zwirner NW. NF-kappa B regulates expression of the MHC class I-related chain A gene in activated T lymphocytes. J Immunol. 2004; 173:5583–90.
45. Cerboni C, Zingoni A, Cippitelli M, Piccoli M, Frati L, Santoni A. Antigen-activated human T lymphocytes express cell-surface NKG2D ligands via an ATM/ATR-dependent mechanism and become susceptible to autologous NK- cell lysis. Blood. 2007; 110:606–15.
46. Lin D, Lavender H, Soilleux EJ, O’Callaghan CA. NF-kappaB regulates MICA gene transcription in endothelial cell through a genetically inhibitable control site. J Biol Chem. 2012; 287:4299–310.
47. Ng G, Sharma K, Ward SM, Desrosiers MD, Stephens LA, Schoel WM, Li T, Lowell CA, Ling CC, Amrein MW, Shi Y. Receptor-independent, direct membrane binding leads to cell-surface lipid sorting and Syk kinase activation in dendritic cells. Immunity. 2008; 29:807–18.
48. Fini MA, Elias A, Johnson RJ, and Wright RM. Contribution of uric acid to cancer risk, recurrence, and mortality. Clinical & Translational Medicine. 2012; 1:16.
49. Borchers MT, Harris NL, Wesselkamper SC, Vitucci M, Cosman D. NKG2D ligands are expressed on stressed human airway epithelial cells. Am J Physiol Lung Cell Mol Physiol. 2006; 291:L222–31.
50. Fini MA, Monks J, Farabaugh SM, Wright RM. Contribution of xanthine oxidoreductase to mammary epithelial and breast cancer cell differentiation in part modulates inhibitor of differentiation-1. Mol Cancer Res. 2011; 9:1242–54.
51. Diefenbach A, Jensen ER, Jamieson AM, Raulet DH. Rae1 and H60 ligands of the NKG2D receptor stimulate tumour immunity. Nature. 2001; 413:165–71.
52. Deng W, Gowen BG, Zhang L, Wang L, Lau S, Iannello A, Xu J, Rovis TL, Xiong N, Raulet DH. Antitumor immunity. A shed NKG2D ligand that promotes natural killer cell activation and tumor rejection. Science. 2015; 348:136–9.
53. Shi Y, Parhar RS, Zou M, Baitei E, Kessie G, Farid NR, Alzahrani A, Al-Mohanna FA. Gene therapy of anaplastic thyroid carcinoma with a single-chain interleukin-12 fusion protein. Hum Gene Ther. 2003; 14:1741–51.
54. Groh V, Rhinehart R, Randolph-Habecker J, Topp MS, Riddell SR, Spies T. Costimulation of CD8alphabeta T cells by NKG2D via engagement by MIC induced on virus-infected cells. Nat Immunol. 2001; 2:255–60.
55. Du Z, Li Y. RCAS-TVA in the mammary gland: an in vivo oncogene screen and a high fidelity model for breast transformation? Cell Cycle. 2007; 6:823–6.