
Introduction
Although relatively rare, pancreatic tumors are highly lethal. Over 80% of patients present with advanced disease at the time of diagnosis and the five year survival is only 7% [1, 2]. This disease is currently the third leading cause of cancer deaths in the United States, sixth in Europe and seventh worldwide [3-5]. In contrast to most other cancers, mortality rates for pancreatic cancer are not improving [6, 7]. In the U.S., it is predicted to become the second leading cause of cancer-related deaths by 2030 [7]. Pancreatic cancer risk has been associated with smoking, obesity, diabetes and pancreatitis [8]. A small fraction of the familial aggregation of pancreatic cancer can be accounted for by rare, moderately or highly penetrant mutations [9]. Furthermore, genome-wide association studies (GWAS) have identified common variants at 13 loci associated with risk of pancreatic cancer in European populations and at 5 loci in Asian populations (at the GWAS threshold of P < 5.0x10⁻⁸), or a total of 18 loci [10-15].
Imputation has proven to be a powerful tool in genome-wide association studies (GWAS) by facilitating investigation of variants not directly assessed on genotyping arrays, the merging of GWAS datasets genotyped on different arrays, and fine-mapping of risk loci [16]. To discover additional pancreatic cancer susceptibility loci for individuals of European ancestry, we imputed three GWAS datasets including a total of 5,107 cases and 8,845 controls (PanScan I-III, Stage I) [12]. For replication of promising signals, we first genotyped an additional 1,912 cases and 3,763 controls (PANDoRA; Replication 1), and then further assessed promising signals in a second set of 4,164 cases and 3,792 controls (PanC4; Replication 2). We identified three new susceptibility signals that achieved genome-wide significance for pancreatic cancer risk.
Results
We conducted imputation of three published pancreatic cancer GWAS datasets performed in individuals of European ancestry, PanScan I, II and III [10-12] using the 1000G (Phase 1, version 3) reference dataset [17]. We included 9,132,527 genotyped or imputed SNPs with an imputation information (INFO) score >0.5 and minor allele frequency (MAF) >0.01, and performed a fixed effects meta-analysis to combine association results for a total of 5,107 pancreatic cancer cases and 8,845 control subjects [10-12]. Little evidence of systematic inflation due to population stratification was observed (λ = 1.02 for PanScan I+II and λ = 1.07 for PanScan III). We attempted replication of promising findings in two stages. In the first replication stage, we genotyped 15 promising variants in 1,912 pancreatic cancer cases and 3,763 control subjects from the PANcreatic Disease ReseArch (PANDoRA) consortium, a case-control consortium including studies from eight European countries [18]. In the second replication stage, we assessed the three most significant variants based on the meta-nanalyses results for PanScan I+II, PanScan III and PANDoRA using 4,164 pancreatic cancer cases and 3,792 controls from the Pancreatic Cancer Case-Control Consortium (PanC4), including studies from the U.S., Canada, Europe and Australia [15]. In total, the discovery and replication stages included 11,183 cases and 16,400 controls (Supplementary Table 1).
In the meta-analysis of PanScan I-III (Stage I), two new variants were identified at genome-wide significance (P < 5.0x10⁻⁸), one on chromosome 1q32.1 (rs2816938: P = 1.71x10⁻¹⁰, OR = 1.23 95% CI 1.15-1.31) and one on 8q24.21 (rs10094872, P = 3.55x10⁻⁸, OR = 1.18 95% CI 1.11-1.25) (Table 1, Supplemental Table 2). After adjusting the analysis on 1q32.1 for the previously reported GWAS SNP rs3790844 (r2 = 0.097 in 1000G EUR populations) [11], the association for rs2816938 remained statistically significant (PConditional = 3.06x10⁻⁶, OR = 1.17). This was also true for the signal at 8q24.21, marked by rs10094872, after adjusting for the GWAS SNP rs1561927 (r2 = 0.01 in 1000G EUR) [12] (PConditional = 1.09x10⁻⁷, OR = 1.16). The signal at 1q32.1 is located ~11 kb upstream of NR5A2, a gene that encodes a nuclear transcription factor known to play important roles in multiple aspects of pancreatic development and function [19, 20]. The SNP at 8q24.21 is located ~28 kb upstream of MYC, in a susceptibility locus previously reported for bladder cancer (tagged by rs9642880; r2 = 0.64 in 1000G EUR) [21-23] and ~850 kb upstream of a previously reported pancreatic cancer susceptibility locus [12].
Table 1: Association results for three new pancreatic cancer susceptibility signals
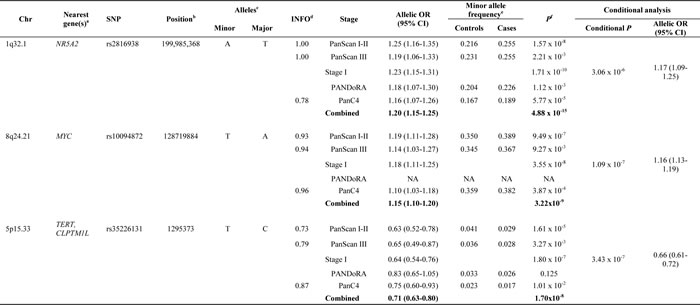
Results are shown from an unconditional logistic regression of the genotypes generated in PanScan I, II and III as well as the two replication studies. aClosest RefSeq gene(s). bPosition of SNP in NCBI genome build 37 (Hg19). cMinor and major alleles. dQuality of imputation metric. eMinor allele frequencies (MAF) are not listed for meta-analysis results. f1 d.f. score test; Chr: chromosome and band; OR, per-allele OR for the minor allele adjusted for for age, sex, study, arm and significant principal components for PanScan I+II; per-allele OR adjusted for age, sex, geographic region and significant principal components for PanScan III; per-allele OR adjusted for age, sex and study for PANDoRA; per-allele OR adjusted for age, sex, study and significant principal components for PanC4. The number of case and control subjects in the combined set of PanScan I, II, III, PANDoRA and PanC4 were: rs2816938 (11,158/16,343), rs10094872 (9,269/12,635) and rs35226131 (11,143/16,308). Text in bold indicates the combined meta-analysis results. NA: Note that the TaqMan assay for rs10094872 on chr8q24.21 failed manufacturing and was therefore not attempted in the PANDoRA samples.
A total of 15 promising variants (P < 5.0x10⁻⁶) were selected for replication in 1,912 pancreatic cancer cases and 3,763 control subjects from the European PANDoRA case-control consortium [18]. After a meta-analysis of PanScan I, II and III and PANDoRA results, the three most promising variants (Supplemental Table 2) were carried forward to replication in PanC4 [15]. The meta-analysis of PanScan I-III with PANDoRA and PanC4 confirmed the signals on chr1q32.1 (P = 4.88x10⁻¹⁵, OR = 1.20 95% CI 1.15-1.25) and chr8q24.21 (P = 3.22x10⁻⁹, OR = 1.15 95% CI 1.10-1.20). In addition, a new signal in the multicancer region on chr5p15.33, upstream of TERT, was detected (rs35226131, P = 1.70x10⁻⁸, OR = 0.71 95% CI 0.63-0.80) (Table 1). After conditioning the analysis in PanScan I, II and III on the two reported pancreatic cancer susceptibility loci at 5p15.33, rs36115365 [24] (tagging the fine-mapped signal for rs401681 [11] in CLPTM1L) and rs2736098 [12] (tagging the signal in TERT), the signal was still near GWAS significant (PUnconditional = 1.80x10⁻⁷, OR = 0.64; PConditional = 3.43x10⁻⁷, OR = 0.66). This SNP (rs35226131) is located ~200bps upstream of the transcriptional start site (TSS) of TERT, and marks the least common of the three loci with a MAF of 0.036 in the 1000G EUR populations. The LD between rs35226131 and the previously reported signals is low (r2 = 0.009 for rs36115365 and r2 = 0.011 fo rs2736098) in 1000G EUR.
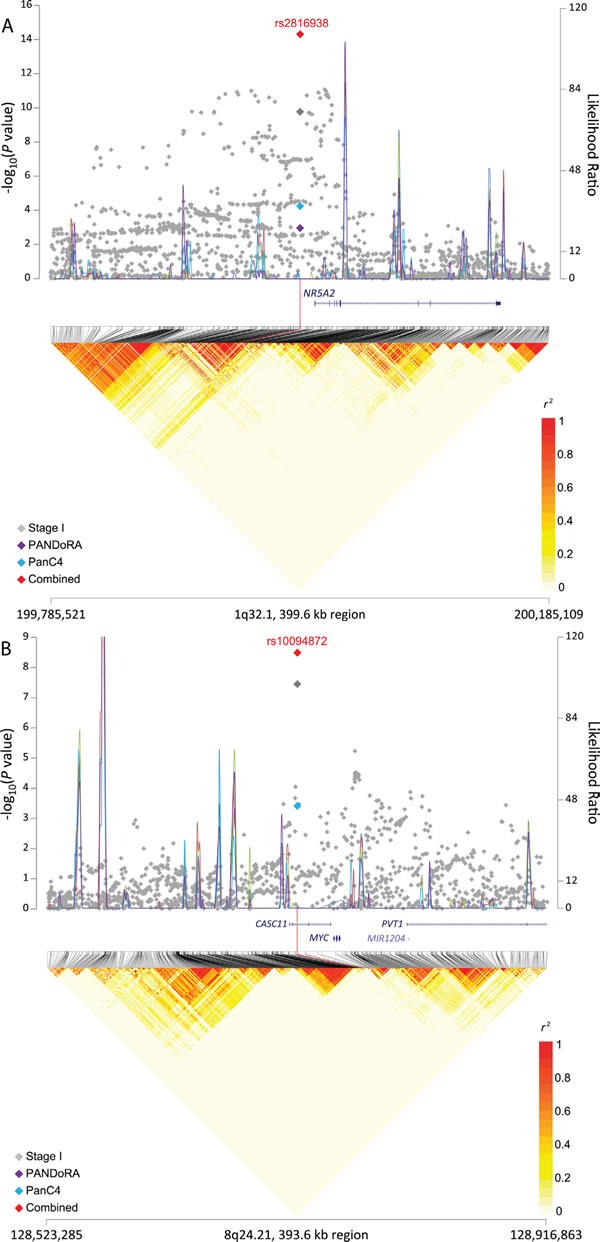
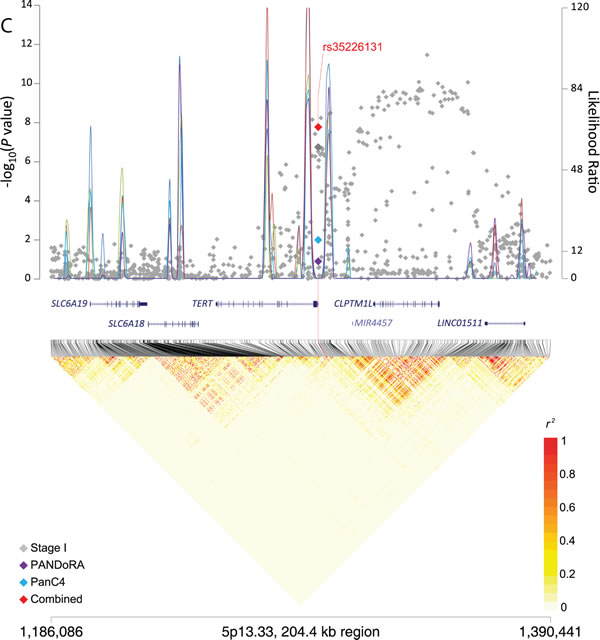
Figure 1: Regional plots for three signals associated with pancreatic cancer risk. The −log10(P value) (Y left axis) for Stage I (PanScan I-III, in gray), PANDoRA (purple) and PanC4 (light blue) was plotted on the genomic coordinates (X axis; NCBI genome build 37). Superimposed blue lines depicts likelihood ratio statistics (right Y axis) estimating putative recombination hotspots in the region. This was performed 5 times, each time utilizing 100 random EUR samples from the 1000 Genomes population (EUR, n = 503) (Y right axis). The combined data for Stage I, PANDoRA and PanC4 for three regions: panel A. rs2816938 (1q32.1), panel B. rs10094872 (8q24.21), and panel C: rs3226131 (5p13.33) are shown in red.
Bioinformatic analysis of susceptibility alleles and differential expression analysis
In order to take the first steps towards understanding the functional ramifications at these three new susceptibility signals, we conducted in silico bioinformatic analyses using HaploReg and RegulomeDB [25, 26]. Supporting evidence for putative regulatory function on gene expression was seen for the three loci, particularly for chr1q32.1 and 5p15.33, with open chromatin, modified histones and transcription factor binding in multiple tissues, including those derived from the pancreas and other gastrointestinal tissues (Supplemental Table 3). At chr5p15.33, one of the four variants highly correlated with rs35226131 is a missense variant in the second exon of TERT (rs61748181: r2 = 1, D’ = 1 in 1000G EUR) whereby the minor allele, associated with reduced risk of pancreatic cancer, changes amino acid 279 from alanine to threonine (A279T).
We assessed expression quantitative trait loci (eQTL) for the three variants in GTEx [27] and the nearest genes (NR5A2 for 1q32.1; TERT and CLPTM1L for 5p14.33; MYC and PVT1 for 8q24.21; Supplementary Table 4) in histologically normal post-mortem pancreatic tissue samples (n = 149). The minor allele of the SNP that marks the signal on 8q24.21 (rs10094872) and was associated with increased risk of pancreatic cancer, was associated with decreased PVT1 expression (β = -0.23, P = 0.0053) (Supplemental Figure 1). Nominally significant eQTLs (P < 0.05) were not seen for MYC (P = 0.29) or for the SNPs on chr5p15.33 (P = 0.91 for CLPTM1L; TERT was not expressed) or 1q32.1 (P = 0.68 for NR5A2). We furthermore assessed differential expression of the same genes in pancreatic cell lines (n = 9) and pancreatic ductal adenocarcinoma (PDAC) samples (n = 8) as compared with histologically normal pancreatic tissue samples (n = 10) by RNAseq [28] (Supplemental Tables 5-7). The most notable differences were seen for NR5A2 on chr1q32.1 where mRNA expression was markedly lower in pancreatic tumor samples (average fold change -7.6, P = 5.7x10⁻⁸) and cell lines (average fold change -32.7, P = 1.5x10⁻¹⁴) than in histologically normal pancreatic tissue samples (Supplemental Table 7). We further validated this finding in an independent set of paired histologically normal and tumor derived (PDAC) pancreatic tissue samples from 20 individuals by RT-qPCR for three NR5A2 isoforms and noted decreased expression in tumors for the majority of pairs (average fold change for paired samples was -78.5 for isoform 1, P = 2.0x10⁻³; -95.7 fold for isoform 2, P = 7.5x10⁻⁴; -31.3 fold for isoform 3, P = 1.5x10⁻³) (Figure 2).
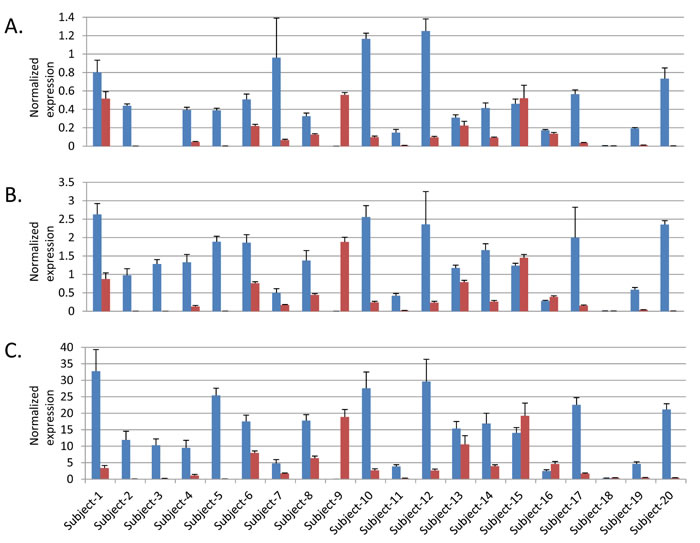
Figure 2: Expression of three NR5A2 isoforms in paired histologically normal and tumor derived pancreatic tissue samples. Blue bars indicate expression in histologically normal samples and red in tumor derived samples. A. NR5A2 isoform 1, B. NR5A2 isoform 2 and C. NR5A2 isoform 3. Note that no expression was seen for isoform 1 in either the normal or tumor derived sample from Subject 3. Error bars represent standard deviation from four replicates.
Technical validation of imputed SNPs
To assess imputation quality, we performed TaqMan genotyping in 678 samples from PanScan I and III (see Materials and Methods). The correlation (r2) between the imputed genotypes and those measured by TaqMan was 0.98 for rs2816938 (1q32.1), 0.90 for rs10094872 (8q24.21) and 0.37 for rs35226131 (5p15.33). Due to the lower correlation between imputed and directly assayed genotypes for rs35226131, we performed a second validation in an additional 875 samples, including both rs35226131 as well as the perfectly correlated coding SNP on 5p15.33 mentioned above, rs61748181. The imputed-genotyped r2 for rs35226131 improved to 0.44 in the second validation set, and was 0.55 for rs61748181. Genotype concordance for the most likely imputed genotypes and directly assayed genotypes (see Materials and Methods) for rs35226131 improved from 86.4% in the first validation set to 94.4% in the second set, and was 96.2% for rs61748181 in the second set. Since rs61748181 was directly genotyped in one of the replication studies (PanC4), we performed a meta-analysis of PanScan I-III (OR = 0.62 95% CI 0.52-0.75, P = 5.37x10⁻⁷) and PanC4 (OR = 0.67 95% CI 0.55-0.85, P = 1.91x10⁻⁴) data. This revealed a highly significant association for rs61748181 (OR = 0.64 95% CI 0.56-0.74, P = 1.28x10⁻¹⁰) that was stronger than that seen for rs35226131 (OR = 0.68 95% CI 0.59-0.79, P = 1.91x10⁻⁸). These results suggest that the association results at this potentially new pancreatic cancer risk locus are reliable.
Discussion
In this study, we performed imputation across three pancreatic cancer GWAS datasets, namely PanScan I, II and III [10-12], using 1000G reference data. Through replication of promising variants in individuals from two independent pancreatic cancer case-control consortia, PANDoRA and PanC4, we identified three new GWAS significant risk signals for pancreatic cancer. They are independent signals in previously established pancreatic cancer risk loci on chromosomes 1q32.1, 5p15.33 and 8q24.21, as per conditional analysis, supporting their importance for pancreatic cancer risk.
The signal on 1q32.1 is located in NR5A2, a gene that encodes nuclear receptor subfamily 5 group A member 2 (NR5A2), a transcription factor important for pancreatic development and adult function in the pancreas, liver, intestine and ovary, where it regulates cholesterol synthesis, bile acid homeostasis and steroidogenesis [19, 20]. NR5A2 is an important regulator of exocrine function in the adult pancreas where it maintains homeostasis and promotes regeneration of acinar cells after inflammation caused by chemically induced pancreatitis, and protects the pancreas from KRAS driven pre-neoplastic changes [29-31]. Other studies have indicated a growth inducing role for NR5A2 in pancreatic cancer [32, 33]. Highly correlated variants (r2>0.7) span ~25 kb on chr1q32.1 from ~11 kb upstream of the TSS to within the second intron of the gene. We observed significantly lower mRNA expression of NR5A2 in the majority of pancreatic tumors and cell lines tested compared with histologically normal pancreatic tissue samples, indicating a possible role for reduced NR5A2 expression in pancreatic cancer. Although an expression QTL was not observed in GTEx data, the relationship between the two currently known pancreatic cancer risk loci on 1q32.1 and NR5A2 expression remains to be studied in greater detail.
The tag SNP on 8q24.21 is located ~28 kb upstream of MYC at an established bladder cancer risk locus [21-23] that is ~850 kb upstream of our previously reported pancreatic cancer susceptibility locus [12]. Multiple independent susceptibility loci on 8q24.21, distributed over a 2 Mb region, are known to influence risk of bladder, breast, prostate, colorectal, lung, ovarian, pancreatic, renal cancer, glioma and chronic lymphocytic leukemia (CLL) [34-38]. Deregulated expression of MYC, a transcription factor that regulates multiple aspects of cell growth and proliferation, occurs in a broad range of human tumors [39]. Although the proximity of rs10094872 to MYC indicates that it may be the most likely target gene, 8q24.21 is known for long range chromosomal interactions, and additional candidate genes, including PVT1 (183 kb), POU5F1B (290 kb), CCAT2 (305 kb) and MIR1205-MIR1208 (253-442 kb), could be involved [40-44]. Several of the 8q24.21 risk loci interact with the MYC and PVT1 promoters through long range chromosomal interaction, and allele-specific effects on gene expression have been reported for both genes [42, 45]. An expression QTL for MYC has been described for the bladder cancer risk locus in histologically normal bladder samples from Chinese subjects, albeit from a very small set [46], but not in adipose or blood tissue samples from European subjects [22]. We noted an eQTL for rs10094872 and PVT1 expression in pancreatic tissue samples in GTEx, indicating that PVT1 may be a target gene for this locus. Replication of these findings is required in independent sample sets. PVT1 encodes a long noncoding RNA that is often amplified and upregulated along with MYC across multiple cancers. Recently, it has been shown to increase MYC protein levels and potentiate its activity [47]. In pancreatic cancer, PVT1 expression is associated with gemcitabine sensitivity in human pancreatic cancer cells and may be associated with poor prognosis [47-49].
The signal on chr5p15.33 lies in another multicancer susceptibility region reported by GWAS for bladder cancer, breast cancer, chronic lymphocytic leukemia, glioma, lung cancer, melanoma, non-melanoma skin cancer, ovarian cancer, pancreatic cancer, prostate cancer and testicular germ cell cancer [11, 12, 23, 37, 50-60]. For the 6 independent susceptibility loci that have been identified in the TERT-CLPTM1L gene region, the same alleles are associated with an increased risk for some cancers but decreased risk of others [24, 60, 61]. Two independent pancreatic cancer susceptibility loci have previously been identified on chr5p15.33 through GWAS [11, 12, 24]. The first one, described in PanScan II [11] was marked by an intronic SNP (rs401681) in CLPTM1L that has since been fine-mapped to rs451360 (and a set of highly correlated variants including rs36115365) [24]. A second independent signal on 5p15.33 was identified in PanScan III, tagged by a synonymous SNP (rs2736098) in the second exon of TERT [12]. Recently, a third risk locus, marked by rs2853677, was identified in this genomic region through a candidate gene analysis of the TERT and TERC genes [62]; however this variant did not attain GWAS significance in our study (PanScan I-III, P = 4.2x10⁻⁴). The TERT gene encodes the catalytic subunit of telomerase, known for its critical role in maintaining telomere ends and the increased telomerase activity frequently seen in human cancers [63-65]. Telomere-independent functions for TERT include regulation of gene expression, cell survival, epithelial to mesenchymal transition (EMT) and mitochondrial function [66]. The neighboring gene encodes cleft lip and palate associated transmembrane 1 like (CLPTM1L) protein that promotes growth and survival in pancreatic and lung cancer, respectively, and is overexpressed in some cancers [67-69]. The SNP (rs35226131) that marks the new risk signal on 5p15.33 reported here, and highly correlated variants, are located in the TERT promoter (~200-500 bp upstream of the TSS) and could potentially influence its expression. Additionally, it is perfectly correlated with a nonsynonomous variant in TERT (rs61748181, A279T) that was recently reported as a novel lung adenocarcinoma risk locus by deep sequencing and direct genotyping of 5,164 cases and 5,716 controls of European ancestry [70]. The threonine substitution at this amino acid in TERT negatively influences telomere length and proliferation in esophageal cancer cell lines compared with alanine, and leads to reduced Wnt signaling through destabilization of complexes containing TERT, transcription activator BRG-1 and β-catenin [71]. As the TERT-279T variant is protective for pancreatic cancer in our study, and for lung cancer [70], the underlying mechanism at this locus may relate to increased TERT activity via canonical and/or non-canonical TERT pathways. This hypothesis needs to be formally investigated by future molecular studies.
In conclusion, through imputation of three existing GWAS datasets and replication in two independent case-control consortia, we identified three new susceptibility signals for pancreatic cancer in populations of European ancestry. They are located in genomic regions previously reported by GWAS of pancreatic cancer, further supporting their importance for pancreatic cancer risk. Further work is required to identify target genes and explain the underlying biological mechanisms.
Materials and Methods
Study participants
Participants were drawn from the Pancreatic Cancer Cohort Consortium and the Pancreatic Cancer Case-Control Consortium (PanC4) and include individuals from 17 cohort and 11 case-control studies genotyped in three previous GWAS phases, namely PanScan I, PanScan II and PanScan III [10-12]. Two replication cohorts were included, the PANDoRA consortium [18] (Replication I) and the Pancreatic Cancer Case-Control Consortium (PanC4) [15] (Replication 2). Cases were defined as individuals diagnosed with adenocarcinoma of the pancreas.
Each study obtained informed consent from study participants and approval from its Institutional Review Board (IRB) including IRB certification permitting data sharing in accordance with the NIH Policy for Sharing of Data Obtained in NIH Supported or Conducted Genome-Wide Association Studies (GWAS). The PanScan and PanC4 GWAS data are available through dbGAP (accession numbers phs000206.v5.p3 and phs000648.v1.p1, respectively).
Genotyping, imputation and association analysis
GWAS genotyping was performed at the Cancer Genomics Research Laboratory (CGR) of the National Cancer Institute (NCI) of the National Institutes of Health (NIH) using the Illumina HumanHap series arrays (Illumina HumanHap550 Infinium II, Human 610-Quad) for PanScan I-II, and the Illumina Omni series arrays (OmniExpress, Omni1M, Omni2.5 and Omni5M) for PanScan III [10-12]. The 1000 Genomes (1000G) Phase 1, Release 3 [17] reference dataset was used to impute the PanScan I-III GWAS datasets using IMPUTE2 [72] as previously described [12, 24]. Due to the large overlap of variants on genotyping arrays for PanScan I and II, these datasets were imputed and analyzed together. The PanScan III data was imputed and analyzed separately. For quality control, variants were excluded based on: 1) completion rate < 90%; 2) MAF < 0.01; 3) Hardy-Weinberg Proportion P value < 1x10⁻⁶; 4) low quality imputation score (IMPUTE 2 INFO score < 0.5). After quality control, 9,132,527 SNPs in 5,107 pancreatic cancer cases and 8,845 controls of European ancestry were included in the analysis. The association analysis was performed using SNPTEST [73] based on probabilistic genotypes from IMPUTE2 [72] using the same adjustments for study, geographical region, age, sex and population substructure as were used in PanScan [10-12]. The score test of the log additive genetic effect was used. A meta-analysis of data from PanScan I & II with PanScan III was performed using the fixed-effects inverse-variance method based on β estimates and standard errors. Heterogeneity was not observed for the SNPs identified as GWAS significant or suggestive in the combined study (Pheterogeneity ≥0.30)
The estimated inflation of the test statistic, λ, was 1.02 for PanScan I+II and 1.07 for PanScan III, respectively (using variants with MAF>0.01 and INFO>0.5) [74].
Replication
Fifteen variants giving promising signals (P < 5.0x10⁻⁶) were selected for replication in the PANDoRA consortium (Replication 1) [18]. Genotyping was performed by custom TaqMan genotyping assays (Applied Biosystems) at the German Cancer Research Center (DKFZ) in Heidelberg, Germany in 3,343 pancreatic cancer cases and 4,998 controls, of which 2,820 cases and 3,909 controls had complete demographic and clinical data and did not overlap with other study samples. Duplicate quality control samples (n = 541 pairs) showed 99.67% genotype concordance. Samples on a few plates were not genotyped for all variants. Unfortunately these plates contained more cases than controls. We excluded 908 cases and 146 controls, either with low genotyping completion rate ( < 80%) or not genotyped, resulting in a total of 1,912 cases and 3,763 controls in the final analyses. The association analysis for PANDoRA was adjusted for age, gender and study in the same manner as previously described [12].
Three variants from the meta-analysis of PanScan and PANDoRA were then selected for a second replication in the Pancreatic Cancer Case-Control Consortium (PanC4) [15] (Replication 2). Genotyping for PanC4 had previously been performed at the Johns Hopkins Center for Inherited Disease Research (CIDR) using the IlluminaHumanOmniExpressExome-8v1 array followed by imputation using 100G Phase 3, version 1 [75] and IMPUTE2. Association analysis was performed in 4,164 pancreatic cancer cases and 3,792 control subjects of European ancestry as previously described [15]. Variants at 3 chromosomal locations were extracted from the results and meta-analyses conducted as described above. Heterogeneity between studies was assessed using the Cochran’s Q-test. IMPUTE2 information scores were 0.78 (rs2816938), 0.96 (rs10094872) and 0.87 (rs35226131) for the three reported variants.
Recombination hotspots for association plots were generated as previously described using SequenceLDhot (10-12). The recombination hotspot inference was performed 5 times, each time utilizing a hundred random sampled EUR from the 1000 Genomes (EUR, n = 503). The linkage disequilibrium heatmap was prepared using the 1000 Genomes Phase 3 EUR data (n = 505, CEU+FIN+GBR+IBS+TSI), and snp.plotter R software package [76].
Validation of imputation accuracy
Imputation accuracy was assessed by direct TaqMan genotyping or Sanger sequencing. TaqMan genotyping assays (ABI, Foster City, CA) were optimized for three SNPs (rs2816938 on 1q32.1, rs35226131 on 5p15.33 and rs10094872 on 8q24.21) in the independent regions. In an analysis of 678 samples from PanScan I and III [10, 12, 77], the allelic r2 measured between imputed and assayed genotypes [78] were 0.98, 0.37 and 0.90, respectively. A second validation in an additional 875 samples from PanScan I included two perfectly correlated SNPs on 5p15.33, rs35226131 and rs61748181; the allelic r2 in this set was 0.44 and 0.55, respectively. We also assessed concordance between the most likely imputed genotypes and directly measured genotypes as follows: samples with imputed allelic dosage ranging from 0-0.5 were designated as being of the homozygous common genotype; samples ranging from 0.51-1.5 as being of the heterozygous genotype and samples ranging from 1.51-2.0 as being of the rare homozygous genotype.
Bioinformatic analysis of functional potential
HaploReg v4.1 (http://www.broadinstitute.org/mammals/haploreg/haploreg.php) was used to annotate functional and regulatory potential of the most significant germline variants at each locus as well as highly correlated variants (r2>0.7) that mark each of the regions identified [25]. RegulomeDB (http://regulomedb.org/) was used to assess and score regulatory potential of variants in each locus [26]. Expression quantitative trait locus (eQTL) effects were assessed using the Genotype-Tissue Expression Project (GTEx) database (http://www.gtexportal.org/home/) for pancreatic tissues (n = 149 samples) [27].
Analysis of gene expression
Gene expression was assessed for five genes that are closest to the reported variants on chromosomes 1q32.1 (NR5A2), 5p15.33 (TERT and CLPTM1L), and 8q24.21 (MYC and PVT1). We first assessed differential expression of these genes in pancreatic tumor samples (PDAC, n = 8), histologically normal (non-malignant) pancreatic tissue samples (n = 10), and pancreatic cell lines (n = 9) by RNA-sequencing as described previously [28]. We compared gene expression in tumors and cell lines to histologically normal pancreatic tissue samples by EdgeR analysis [28]. P-values represent an exact test of the differential expression of each gene in histologically normal and tumor derived samples using normalized read counts in EdgeR.
We also assessed the expression of one of these genes (NR5A2) in a second independent tissue sample set that included 20 fresh frozen paired histologically normal pancreatic samples (adjacent to tumor) and pancreatic ductal adenocarcinoma (PDAC) tumor samples. RNA samples were isolated from fresh frozen tissues and reverse transcribed to cDNA as previously described [28]. Three NR5A2 isoforms (isoform 1: NM_205860, isoform 2: NM_003822, and isoform 3: uc009wzh.3) were tested using TaqMan gene expression assays (Thermo Fisher Scientific, isoform 1: Hs00894632_m1, isoform2: Hs00892375_m1 and a custom assay, for isoform 3 forward primer: 5’CTTTTCGCCGGAGTTGAAT3’; reverse primer: 5’GTCCGGAAGCCCAGCA3’; probe: 5’ CTGTGCTGCCCGTGTCC3’) and a 7900HT system (ABI). Each reaction was run in triplicate and analyzed according to the ΔΔCt method using B2M (Hs99999907_m1), GAPDH (Hs99999905_m1) and PPIA (Hs99999904_m1) as housekeeping genes. P-values represent two-sided T-tests of the difference in expression between histologically normal and tumor derived samples.
All tissue samples were obtained from the Mayo Clinic in Rochester, MN. The project was approved by the Institutional Review Boards of the Mayo Clinic and the NIH. Nine pancreatic cancer cell lines (AsPC-1, BxPC-3, Hs766T, SU.86.86, SW1990, CFPAC-1, Capan-1, PANC-1, MIA PaCa-2) were purchased from ATCC and cultured as recommended (http://www.ATCC.com). The cell lines were tested for authentication with a panel of short tandem repeats (STR) using the Identifiler kit (Life Technologies) and compared with the ATCC and the DSMZ (German Collection of Microorganisms and Cell Cultures) STR Profile Databases. All cell lines matched the listed profiles.
Acknowledgments
The authors acknowledge the contribution of the staff of the Cancer Genomics Research Laboratory (CGR) at the National Cancer Institute, NIH, for their help throughout the project. This work was supported by the Intramural Research Program of the US National Institutes of Health (NIH), National Cancer Institute. The content of this publication does not necessarily reflect the views or policies of the Department of Health and Human Services, nor does mention of trade names, commercial products, or organizations imply endorsement by the U.S. Government. Additional acknowledgements for individual participating studies are listed in the Supplemental Materials.
conflicts of interest
The authors do not have any potential conflicts of interest.
References
1. Society AC. Cancer Facts and Figures. Int J BiolSci. 2016; 12:273-282.
2. Vincent A, Herman J, Schulick R, Hruban RH and Goggins M. Pancreatic cancer. Lancet. 2011; 378:607-620.
3. Torre LA, Bray F, Siegel RL, Ferlay J, Lortet-Tieulent J and Jemal A. Global cancer statistics, 2012. CA Cancer J Clin. 2015; 65:87-108.
4. Ferlay J, Steliarova-Foucher E, Lortet-Tieulent J, Rosso S, Coebergh JW, Comber H, Forman D and Bray F. Cancer incidence and mortality patterns in Europe: estimates for 40 countries in 2012. Eur J Cancer. 2013; 49:1374-1403.
5. Siegel RL, Miller KD and Jemal A. Cancer statistics, 2016. CA Cancer J Clin. 2016; 66:7-30.
6. Malvezzi M, Bertuccio P, Levi F, La Vecchia C and Negri E. European cancer mortality predictions for the year 2014. Annals of oncology. 2014; 25:1650-1656.
7. Rahib L, Smith BD, Aizenberg R, Rosenzweig AB, Fleshman JM and Matrisian LM. Projecting cancer incidence and deaths to 2030: the unexpected burden of thyroid, liver, and pancreas cancers in the United States. Cancer Res. 2014; 74:2913-2921.
8. Stolzenberg-Solomon RZ and Amundadottir LT. Epidemiology and Inherited Predisposition for Sporadic Pancreatic Adenocarcinoma. Hematol Oncol Clin North Am. 2015; 29:619-640.
9. Klein AP. Genetic susceptibility to pancreatic cancer. Molecular carcinogenesis. 2012; 51:14-24.
10. Amundadottir L, Kraft P, Stolzenberg-Solomon RZ, Fuchs CS, Petersen GM, Arslan AA, Bueno-de-Mesquita HB, Gross M, Helzlsouer K, Jacobs EJ, LaCroix A, Zheng W, Albanes D, Bamlet W, Berg CD, Berrino F, et al. Genome-wide association study identifies variants in the ABO locus associated with susceptibility to pancreatic cancer. Nat Genet. 2009; 41:986-990.
11. Petersen GM, Amundadottir L, Fuchs CS, Kraft P, Stolzenberg-Solomon RZ, Jacobs KB, Arslan AA, Bueno-de-Mesquita HB, Gallinger S, Gross M, Helzlsouer K, Holly EA, Jacobs EJ, Klein AP, LaCroix A, Li D, et al. A genome-wide association study identifies pancreatic cancer susceptibility loci on chromosomes 13q22.1, 1q32.1 and 5p15.33. Nat Genet. 2010; 42:224-228.
12. Wolpin BM, Rizzato C, Kraft P, Kooperberg C, Petersen GM, Wang Z, Arslan AA, Beane-Freeman L, Bracci PM, Buring J, Canzian F, Duell EJ, Gallinger S, Giles GG, Goodman GE, Goodman PJ, et al. Genome-wide association study identifies multiple susceptibility loci for pancreatic cancer. Nat Genet. 2014; 46:994-1000.
13. Wu C, Miao X, Huang L, Che X, Jiang G, Yu D, Yang X, Cao G, Hu Z, Zhou Y, Zuo C, Wang C, Zhang X, Yu X, Dai W, Li Z, et al. Genome-wide association study identifies five loci associated with susceptibility to pancreatic cancer in Chinese populations. Nat Genet. 2012; 44:62-66.
14. Low SK, Kuchiba A, Zembutsu H, Saito A, Takahashi A, Kubo M, Daigo Y, Kamatani N, Chiku S, Totsuka H, Ohnami S, Hirose H, Shimada K, Okusaka T, Yoshida T, Nakamura Y, et al. Genome-wide association study of pancreatic cancer in Japanese population. PloS one. 2010; 5:e11824.
15. Childs EJ, Mocci E, Campa D, Bracci PM, Gallinger S, Goggins M, Li D, Neale RE, Olson SH, Scelo G, Amundadottir LT, Bamlet WR, Bijlsma MF, Blackford A, Borges M, Brennan P, et al. Common variation at 2p13.3, 3q29, 7p13 and 17q25.1 associated with susceptibility to pancreatic cancer. Nat Genet. 2015; 47:911-916.
16. Marchini J and Howie B. Genotype imputation for genome-wide association studies. Nat Rev Genet. 2010; 11:499-511.
17. 1000 Genomes Consortium. A map of human genome variation from population-scale sequencing. Nature. 2010; 467:1061-1073.
18. Campa D, Rizzato C, Capurso G, Giese N, Funel N, Greenhalf W, Soucek P, Gazouli M, Pezzilli R, Pasquali C, Talar-Wojnarowska R, Cantore M, Andriulli A, Scarpa A, Jamroziak K, Delle Fave G, et al. Genetic susceptibility to pancreatic cancer and its functional characterisation: the PANcreatic Disease ReseArch (PANDoRA) consortium. Digestive and liver disease. 2013; 45:95-99.
19. Fayard E, Auwerx J and Schoonjans K. LRH-1: an orphan nuclear receptor involved in development, metabolism and steroidogenesis. Trends in cell biology. 2004; 14:250-260.
20. Kelly VR, Xu B, Kuick R, Koenig RJ and Hammer GD. Dax1 up-regulates Oct4 expression in mouse embryonic stem cells via LRH-1 and SRA. Mol Endocrinol. 2010; 24:2281-2291.
21. Rafnar T, Sulem P, Thorleifsson G, Vermeulen SH, Helgason H, Saemundsdottir J, Gudjonsson SA, Sigurdsson A, Stacey SN, Gudmundsson J, Johannsdottir H, Alexiusdottir K, Petursdottir V, Nikulasson S, Geirsson G, Jonsson T, et al. Genome-wide association study yields variants at 20p12.2 that associate with urinary bladder cancer. Hum Mol Genet. 2014; 23:5545-5557.
22. Kiemeney LA, Thorlacius S, Sulem P, Geller F, Aben KK, Stacey SN, Gudmundsson J, Jakobsdottir M, Bergthorsson JT, Sigurdsson A, Blondal T, Witjes JA, Vermeulen SH, Hulsbergen-van de Kaa CA, Swinkels DW, Ploeg M, et al. Sequence variant on 8q24 confers susceptibility to urinary bladder cancer. Nat Genet. 2008; 40:1307-1312.
23. Rothman N, Garcia-Closas M, Chatterjee N, Malats N, Wu X, Figueroa JD, Real FX, Van Den Berg D, Matullo G, Baris D, Thun M, Kiemeney LA, Vineis P, De Vivo I, Albanes D, Purdue MP, et al. A multi-stage genome-wide association study of bladder cancer identifies multiple susceptibility loci. Nat Genet. 2010; 42:978-984.
24. Wang Z, Zhu B, Zhang M, Parikh H, Jia J, Chung CC, Sampson JN, Hoskins JW, Hutchinson A, Burdette L, Ibrahim A, Hautman C, Raj PS, Abnet CC, Adjei AA, Ahlbom A, et al. Imputation and subset-based association analysis across different cancer types identifies multiple independent risk loci in the TERT-CLPTM1L region on chromosome 5p15.33. Hum Mol Genet. 2014; 23:6616-6633.
25. Ward LD and Kellis M. HaploReg: a resource for exploring chromatin states, conservation, and regulatory motif alterations within sets of genetically linked variants. Nucleic Acids Res. 2012; 40:D930-934.
26. Boyle AP, Hong EL, Hariharan M, Cheng Y, Schaub MA, Kasowski M, Karczewski KJ, Park J, Hitz BC, Weng S, Cherry JM and Snyder M. Annotation of functional variation in personal genomes using RegulomeDB. Genome Res. 2012; 22:1790-1797.
27. GTEx Consortium. The Genotype-Tissue Expression (GTEx) pilot analysis: Multitissue gene regulation in humans. Science. 2015; 348:648-660.
28. Hoskins JW, Jia J, Flandez M, Parikh H, Xiao W, Collins I, Emmanuel MA, Ibrahim A, Powell J, Zhang L, Malats N, Bamlet WR, Petersen GM, Real FX and Amundadottir LT. Transcriptome analysis of pancreatic cancer reveals a tumor suppressor function for HNF1A. Carcinogenesis. 2014; 35:2670-2678.
29. Holmstrom SR, Deering T, Swift GH, Poelwijk FJ, Mangelsdorf DJ, Kliewer SA and MacDonald RJ. LRH-1 and PTF1-L coregulate an exocrine pancreas-specific transcriptional network for digestive function. Genes & development. 2011; 25:1674-1679.
30. Flandez M, Cendrowski J, Canamero M, Salas A, Del Pozo N, Schoonjans K and Real FX. Nr5a2 heterozygosity sensitises to, and cooperates with, inflammation in KRasG12V-driven pancreatic tumourigenesis. Gut. 2014; 63:647-55.
31. von Figura G, Morris JPt, Wright CV and Hebrok M. Nr5a2 maintains acinar cell differentiation and constrains oncogenic Kras-mediated pancreatic neoplastic initiation. Gut. 2014; 63:656-664.
32. Benod C, Vinogradova MV, Jouravel N, Kim GE, Fletterick RJ and Sablin EP. Nuclear receptor liver receptor homologue 1 (LRH-1) regulates pancreatic cancer cell growth and proliferation. Proc Natl Acad Sci U S A. 2011; 108:16927-16931.
33. Lin Q, Aihara A, Chung W, Li Y, Huang Z, Chen X, Weng S, Carlson RI, Wands JR and Dong X. LRH1 as a driving factor in pancreatic cancer growth. Cancer letters. 2014; 345:85-90.
34. Sur I, Tuupanen S, Whitington T, Aaltonen LA and Taipale J. Lessons from functional analysis of genome-wide association studies. Cancer Res. 2013; 73:4180-4184.
35. Gudmundsson J, Sulem P, Gudbjartsson DF, Masson G, Petursdottir V, Hardarson S, Gudjonsson SA, Johannsdottir H, Helgadottir HT, Stacey SN, Magnusson OT, Helgason H, Panadero A, van der Zanden LF, Aben KK, Vermeulen SH, et al. A common variant at 8q24.21 is associated with renal cell cancer. Nature communications. 2013; 4:2776.
36. Park SL, Chang SC, Cai L, Cordon-Cardo C, Ding BG, Greenland S, Hussain SK, Jiang Q, Liu S, Lu ML, Mao JT, Morgenstern H, Mu LN, Ng LJ, Pantuck A, Rao J, et al. Associations between variants of the 8q24 chromosome and nine smoking-related cancer sites. Cancer Epidemiol Biomarkers Prev. 2008; 17:3193-3202.
37. Shete S, Hosking FJ, Robertson LB, Dobbins SE, Sanson M, Malmer B, Simon M, Marie Y, Boisselier B, Delattre JY, Hoang-Xuan K, El Hallani S, Idbaih A, Zelenika D, Andersson U, Henriksson R, et al. Genome-wide association study identifies five susceptibility loci for glioma. Nat Genet. 2009; 41:899-904.
38. Goode EL, Chenevix-Trench G, Song H, Ramus SJ, Notaridou M, Lawrenson K, Widschwendter M, Vierkant RA, Larson MC, Kjaer SK, Birrer MJ, Berchuck A, Schildkraut J, Tomlinson I, Kiemeney LA, Cook LS, et al. A genome-wide association study identifies susceptibility loci for ovarian cancer at 2q31 and 8q24. Nat Genet. 2010; 42:874-879.
39. Dang CV, O‘Donnell KA, Zeller KI, Nguyen T, Osthus RC and Li F. The c-Myc target gene network. Semin Cancer Biol. 2006; 16:253-264.
40. Pomerantz MM, Ahmadiyeh N, Jia L, Herman P, Verzi MP, Doddapaneni H, Beckwith CA, Chan JA, Hills A, Davis M, Yao K, Kehoe SM, Lenz HJ, Haiman CA, Yan C, Henderson BE, et al. The 8q24 cancer risk variant rs6983267 shows long-range interaction with MYC in colorectal cancer. Nat Genet. 2009; 41:882-884.
41. Dryden NH, Broome LR, Dudbridge F, Johnson N, Orr N, Schoenfelder S, Nagano T, Andrews S, Wingett S, Kozarewa I, Assiotis I, Fenwick K, Maguire SL, Campbell J, Natrajan R, Lambros M, et al. Unbiased analysis of potential targets of breast cancer susceptibility loci by Capture Hi-C. Genome Res. 2014; 24:1854-1868.
42. Ahmadiyeh N, Pomerantz MM, Grisanzio C, Herman P, Jia L, Almendro V, He HH, Brown M, Liu XS, Davis M, Caswell JL, Beckwith CA, Hills A, Macconaill L, Coetzee GA, Regan MM, et al. 8q24 prostate, breast, and colon cancer risk loci show tissue-specific long-range interaction with MYC. Proc Natl Acad Sci U S A. 2010; 107:9742-9746.
43. Breyer JP, Dorset DC, Clark TA, Bradley KM, Wahlfors TA, McReynolds KM, Maynard WH, Chang SS, Cookson MS, Smith JA, Schleutker J, Dupont WD and Smith JR. An expressed retrogene of the master embryonic stem cell gene POU5F1 is associated with prostate cancer susceptibility. Am J Hum Genet. 2014; 94:395-404.
44. Ling H, Spizzo R, Atlasi Y, Nicoloso M, Shimizu M, Redis RS, Nishida N, Gafa R, Song J, Guo Z, Ivan C, Barbarotto E, De Vries I, Zhang X, Ferracin M, Churchman M, et al. CCAT2, a novel noncoding RNA mapping to 8q24, underlies metastatic progression and chromosomal instability in colon cancer. Genome Res. 2013; 23:1446-1461.
45. Meyer KB, Maia AT, O’Reilly M, Ghoussaini M, Prathalingam R, Porter-Gill P, Ambs S, Prokunina-Olsson L, Carroll J and Ponder BA. A functional variant at a prostate cancer predisposition locus at 8q24 is associated with PVT1 expression. PLoS Genet. 2011; 7:e1002165.
46. Wang M, Zhang W, Yuan L, Fu G, Wei Q and Zhang Z. Common genetic variants on 8q24 contribute to susceptibility to bladder cancer in a Chinese population. Carcinogenesis. 2009; 30:991-996.
47. Tseng YY, Moriarity BS, Gong W, Akiyama R, Tiwari A, Kawakami H, Ronning P, Reuland B, Guenther K, Beadnell TC, Essig J, Otto GM, O’Sullivan MG, Largaespada DA, Schwertfeger KL, Marahrens Y, et al. PVT1 dependence in cancer with MYC copy-number increase. Nature. 2014; 512:82-86.
48. Colombo T, Farina L, Macino G and Paci P. PVT1: a rising star among oncogenic long noncoding RNAs. Biomed Res Int. 2015; 2015:304208.
49. Huang C, Yu W, Wang Q, Cui H, Wang Y, Zhang L, Han F and Huang T. Increased expression of the lncRNA PVT1 is associated with poor prognosis in pancreatic cancer patients. Minerva Med. 2015; 106:143-149.
50. Turnbull C, Rapley EA, Seal S, Pernet D, Renwick A, Hughes D, Ricketts M, Linger R, Nsengimana J, Deloukas P, Huddart RA, Bishop DT, Easton DF, Stratton MR and Rahman N. Variants near DMRT1, TERT and ATF7IP are associated with testicular germ cell cancer. Nat Genet. 2010; 42:604-607.
51. Haiman CA, Chen GK, Vachon CM, Canzian F, Dunning A, Millikan RC, Wang X, Ademuyiwa F, Ahmed S, Ambrosone CB, Baglietto L, Balleine R, Bandera EV, Beckmann MW, Berg CD, Bernstein L, et al. A common variant at the TERT-CLPTM1L locus is associated with estrogen receptor-negative breast cancer. Nat Genet. 2011; 43:1210-1214.
52. Berndt SI, Skibola CF, Joseph V, Camp NJ, Nieters A, Wang Z, Cozen W, Monnereau A, Wang SS, Kelly RS, Lan Q, Teras LR, Chatterjee N, Chung CC, Yeager M, Brooks-Wilson AR, et al. Genome-wide association study identifies multiple risk loci for chronic lymphocytic leukemia. Nat Genet. 2013; 45:868-876.
53. Wang Y, Broderick P, Webb E, Wu X, Vijayakrishnan J, Matakidou A, Qureshi M, Dong Q, Gu X, Chen WV, Spitz MR, Eisen T, Amos CI and Houlston RS. Common 5p15.33 and 6p21.33 variants influence lung cancer risk. Nat Genet. 2008; 40:1407-1409.
54. McKay JD, Hung RJ, Gaborieau V, Boffetta P, Chabrier A, Byrnes G, Zaridze D, Mukeria A, Szeszenia-Dabrowska N, Lissowska J, Rudnai P, Fabianova E, Mates D, Bencko V, Foretova L, Janout V, et al. Lung cancer susceptibility locus at 5p15.33. Nat Genet. 2008; 40:1404-1406.
55. Landi MT, Chatterjee N, Yu K, Goldin LR, Goldstein AM, Rotunno M, Mirabello L, Jacobs K, Wheeler W, Yeager M, Bergen AW, Li Q, Consonni D, Pesatori AC, Wacholder S, Thun M, et al. A genome-wide association study of lung cancer identifies a region of chromosome 5p15 associated with risk for adenocarcinoma. Am J Hum Genet. 2009; 85:679-691.
56. Rafnar T, Sulem P, Stacey SN, Geller F, Gudmundsson J, Sigurdsson A, Jakobsdottir M, Helgadottir H, Thorlacius S, Aben KK, Blondal T, Thorgeirsson TE, Thorleifsson G, Kristjansson K, Thorisdottir K, Ragnarsson R, et al. Sequence variants at the TERT-CLPTM1L locus associate with many cancer types. Nat Genet. 2009; 41:221-227.
57. Stacey SN, Sulem P, Masson G, Gudjonsson SA, Thorleifsson G, Jakobsdottir M, Sigurdsson A, Gudbjartsson DF, Sigurgeirsson B, Benediktsdottir KR, Thorisdottir K, Ragnarsson R, Scherer D, Hemminki K, Rudnai P, Gurzau E, et al. New common variants affecting susceptibility to basal cell carcinoma. Nat Genet. 2009; 41:909-914.
58. Yang X, Yang B, Li B and Liu Y. Association between TERT-CLPTM1L rs401681[C] allele and NMSC cancer risk: a meta-analysis including 45,184 subjects. Arch Dermatol Res. 2013; 305:49-52.
59. Beesley J, Pickett HA, Johnatty SE, Dunning AM, Chen X, Li J, Michailidou K, Lu Y, Rider DN, Palmieri RT, Stutz MD, Lambrechts D, Despierre E, Lambrechts S, Vergote I, Chang-Claude J, et al. Functional polymorphisms in the TERT promoter are associated with risk of serous epithelial ovarian and breast cancers. PloS one. 2011; 6:e24987.
60. Kote-Jarai Z, Saunders EJ, Leongamornlert DA, Tymrakiewicz M, Dadaev T, Jugurnauth-Little S, Ross-Adams H, Al Olama AA, Benlloch S, Halim S, Russel R, Dunning AM, Luccarini C, Dennis J, Neal DE, Hamdy FC, et al. Fine-mapping identifies multiple prostate cancer risk loci at 5p15, one of which associates with TERT expression. Hum Mol Genet. 2013; 22:2520-8.
61. Bojesen SE, Pooley KA, Johnatty SE, Beesley J, Michailidou K, Tyrer JP, Edwards SL, Pickett HA, Shen HC, Smart CE, Hillman KM, Mai PL, Lawrenson K, Stutz MD, Lu Y, Karevan R, et al. Multiple independent variants at the TERT locus are associated with telomere length and risks of breast and ovarian cancer. Nat Genet. 2013; 45:371-384.
62. Campa D, Rizzato C, Stolzenberg-Solomon R, Pacetti P, Vodicka P, Cleary SP, Capurso G, Bueno-de-Mesquita HB, Werner J, Gazouli M, Butterbach K, Ivanauskas A, Giese N, Petersen GM, Fogar P, Wang Z, et al. TERT gene harbors multiple variants associated with pancreatic cancer susceptibility. Int J Cancer. 2015; 137:2175-83.
63. Bodnar AG, Ouellette M, Frolkis M, Holt SE, Chiu CP, Morin GB, Harley CB, Shay JW, Lichtsteiner S and Wright WE. Extension of life-span by introduction of telomerase into normal human cells. Science. 1998; 279:349-352.
64. Hahn WC, Counter CM, Lundberg AS, Beijersbergen RL, Brooks MW and Weinberg RA. Creation of human tumour cells with defined genetic elements. Nature. 1999; 400:464-468.
65. Kim NW, Piatyszek MA, Prowse KR, Harley CB, West MD, Ho PL, Coviello GM, Wright WE, Weinrich SL and Shay JW. Specific association of human telomerase activity with immortal cells and cancer. Science. 1994; 266:2011-2015.
66. Ding D, Zhou J, Wang M and Cong YS. Implications of telomere-independent activities of telomerase reverse transcriptase in human cancer. The FEBS journal. 2013; 280:3205-3211.
67. Yamamoto K, Okamoto A, Isonishi S, Ochiai K and Ohtake Y. A novel gene, CRR9, which was up-regulated in CDDP-resistant ovarian tumor cell line, was associated with apoptosis. Biochem Biophys Res Commun. 2001; 280:1148-1154.
68. James MA, Wen W, Wang Y, Byers LA, Heymach JV, Coombes KR, Girard L, Minna J and You M. Functional characterization of CLPTM1L as a lung cancer risk candidate gene in the 5p15.33 locus. PloS one. 2012; 7:e36116.
69. Jia J, Bosley AD, Thompson A, Hoskins JW, Cheuk A, Collins I, Parikh H, Xiao Z, Ylaya K, Dzyadyk M, Cozen W, Hernandez BY, Lynch CF, Loncarek J, Altekruse SF, Zhang L, et al. CLPTM1L promotes growth and enhances aneuploidy in pancreatic cancer cells. Cancer Res. 2014; 74:2785-2795.
70. Kachuri L, Amos CI, McKay JD, Johansson M, Vineis P, Bueno-de-Mesquita HB, Boutron-Ruault MC, Johansson M, Quiros JR, Sieri S, Travis RC, Weiderpass E, Le Marchand L, Henderson BE, Wilkens L, Goodman GE, et al. Fine mapping of chromosome 5p15.33 based on a targeted deep sequencing and high density genotyping identifies novel lung cancer susceptibility loci. Carcinogenesis. 2016; 37:96-105.
71. Zhang Y, Calado R, Rao M, Hong JA, Meeker AK, Dumitriu B, Atay S, McCormick PJ, Garfield SH, Wangsa D, Padilla-Nash HM, Burkett S, Zhang M, Kunst TF, Peterson NR, Xi S, et al. Telomerase variant A279T induces telomere dysfunction and inhibits non-canonical telomerase activity in esophageal carcinomas. PloS one. 2014; 9:e101010.
72. Howie BN, Donnelly P and Marchini J. A flexible and accurate genotype imputation method for the next generation of genome-wide association studies. PLoS Genet. 2009; 5:e1000529.
73. Marchini J, Howie B, Myers S, McVean G and Donnelly P. A new multipoint method for genome-wide association studies by imputation of genotypes. Nat Genet. 2007; 39:906-913.
74. de Bakker PI, Ferreira MA, Jia X, Neale BM, Raychaudhuri S and Voight BF. Practical aspects of imputation-driven meta-analysis of genome-wide association studies. Hum Mol Genet. 2008; 17:R122-128.
75. Howie B, Marchini J and Stephens M. Genotype Imputation with Thousands of Genomes. G3: Genes, Genomes, Genetics. 2011; 1:457-470.
76. Luna A and Nicodemus KK. snp.plotter: an R-based SNP/haplotype association and linkage disequilibrium plotting package. Bioinformatics. 2007; 23:774-776.
77. Berndt S YM, Wang Z, Jacobs K, Sampson J, Margaret Tucker M, Chanock C. Pegasus GWAS. Nature Genetics, in preparation. 2013.
78. Browning BL and Browning SR. A unified approach to genotype imputation and haplotype-phase inference for large data sets of trios and unrelated individuals. Am J Hum Genet. 2009; 84:210-223.