
INTRODUCTION
Among all cancers, hepatocellular carcinoma (HCC) is the most prevalent inflammation-associated human cancer with more than 90% of all cases arising in the context of chronic hepatic injury and inflammation. Interestingly, inflammatory infiltrates and overexpression of acute phase inflammatory response genes at the molecular level are also present in inflammatory hepatocellular adenomas (IHCA), benign liver tumors with risk for malignant transformation [1, 2]. Therefore, a functional understanding of pro-inflammatory signaling pathways and inflammation-associated cellular mechanisms involved in the transition from adenomatous liver lesions or chronic liver injury to hepatocyte transformation will be crucial to develop new therapeutic approaches.
Interleukin 6 (IL-6) is one of the best-characterized pro-tumorigenic cytokines. It signals through several well-described pathways, in particular the Janus kinase (JAK)-signal transducer and activator of transcription 3 (STAT3) pathway, the Src homology 2 (SH2)-containing protein tyrosine phosphatase-2 (SHP-2)-Ras-Raf-MEK-extracellular signal-regulated kinase (ERK) pathway and the phosphoinositide-3-kinase (PI3K)-Akt pathway [3]. Activation of the downstream signaling target STAT3 has been identified in several human malignancies, including myeloma, prostate cancer, melanoma, ovarian cancer, renal cell carcinoma, and breast cancer [4]. As leading mechanism for STAT3 activation in inflammation-associated tumors, activation of the signal transducer gp130 via the pro-inflammatory cytokine IL-6 has been discussed [5]. To this regard, IL-6 has been identified as an independent risk factor for tumor development in patients with chronic hepatitis B [6, 7]. In the case of premalignant adenomatous liver lesions, somatic gain-of-function mutations in the gp130 gene (IL6ST) were found in 60% of analyzed IHCA [8]. The detected mutations resulted in ligand-independent activation of gp130 and constitutive STAT3 phosphorylation. In HCC, gp130 mutations always occur together with β-catenin-activating mutations, suggesting a cooperative effect in the malignant transformation of hepatocytes [2]. However, the functional role of ligand-independent IL-6 signaling in the transformation process of hepatocytes (e.g., in the transition from IHCA to HCC) and the underlying cellular mechanisms are not entirely understood. Besides inflammatory cytokines, oxidative stress, characterized by the generation of reactive oxygen species (ROS), also plays a central role in inflammation-mediated transformation. For example, accelerated hepatocarcinogenesis following liver resection in Mdr2-/- mice, a model for inflammation-associated liver cancer, was associated with increased ROS levels and a higher frequency of DNA-double strand breaks (DSB) [9].
In this study we utilized untransformed proliferating telomerase-immortalized human fetal hepatocytes (FH-hTERT), as the currently only available human hepatocyte cell culture model, to explore the cellular mechanisms promoting ROS-induced transformation in the context of activated IL-6 signaling.
RESULTS
Activation of gp130-signaling
In this study, we mimicked permanent IL-6 signaling by stable transfection of FH-hTERT with a constitutively active signal transducer gp130 construct (L-gp130). Following antibiotic selection, seven single cell-clones were isolated and expanded. To verify robust gp130-mediated signal transduction in these clones, we analyzed phosphorylation of STAT3. In comparison to FH-hTERT transfected with the empty vector pcDNA3.1 (in the following labeled as mock-transfected), three of the seven clones (L-gp130 clone #1, #2, and #3) showed an increased band intensity for pSTAT3 (Figure 1A). Additionally, we evaluated pERK1/2 and detected an increased band intensity in the three clones (Figure 1B).
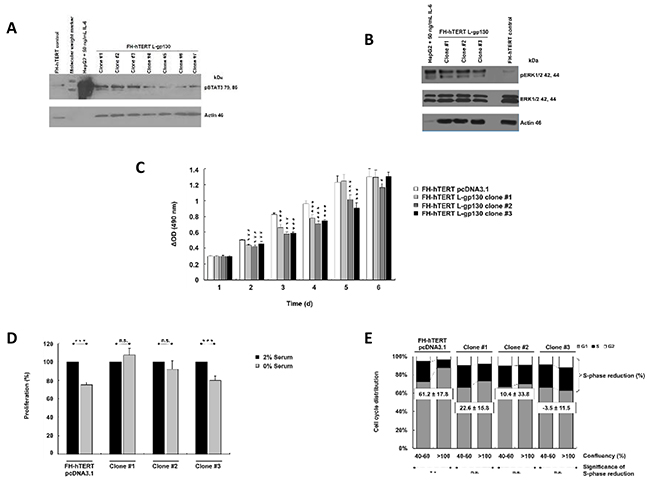
Figure 1: Constitutive activation of IL-6 signaling and phenotype characterization. A. Phosphorylation of STAT3 and B. ERK1/2 were evaluated by immunoblotting with up to 40 µg protein per lane. HepG2 cells (5 µg per lane) treated with 50 ng/ml IL-6 for 10 min served as positive control. β-Actin and ERK1/2 were visualized as loading control. C. Cell proliferation was monitored by colorimetric measurement of cell density at different time points after seeding. Depicted are means ± SD (error bars). D. To investigate serum dependence, cells were cultured with 0 or 2% serum. Cell density was determined at day 3 after seeding by colorimetric assay. Bar graphs represent the average cell proliferation ± SD (error bars) of six wells relative to 2% serum (= 100%). E. Cell cycle profiles of near-confluent (40-60%) and super-confluent (>100%) cultures were obtained by flow cytometry. Histograms were analyzed by FlowJo to attain the different fractions of the cell cycle. Bar graphs show cell cycle distribution and calculated S-phase reduction (in % of super-confluent cultures; negative S-phase reduction indicates an increase). P-values are as indicated, P ≤0.05 (*), P ≤0.01 (**), P ≤0.001 (***), and not significant (n.s.).
Phenotype characterization of L-gp130 clones
To characterize functional consequences induced by the activation of gp130-mediated signaling, we monitored cellular growth properties. Contrary to our assumption, L-gp130 clones did not show an accelerated cellular growth in comparison to mock-transfected FH-hTERT (Figure 1C). The clones even displayed a decelerated growth pattern. Serum-free culture conditions significantly reduced cellular growth in the control cells and clone #3, with a 20-30% reduction in cell density compared to cells cultured with 2% serum (Figure 1D). However, we detected no significant growth reduction for clone #1 and #2, and therefore, serum dependence was abolished in these clones. To detect changes in contact inhibition, we compared S-phase fractions in confluent cultures with log-proliferating cultures. In mock-transfected cells, the S-phase fraction was reduced by more than 60% in confluent cultures, confirming effective growth inhibition by cell-to-cell contacts. However, in L-gp130 clone #1 and #2, contact inhibition was strongly reduced, and in clone #3 completely eliminated with an increased S-phase fraction (Figure 1E). The divergent growth response following gp130 activation may be due to the magnitude of pathway activation in each L-gp130 clone. To investigate anchorage-independent growth, an established in vitro marker for a malignant phenotype, we scored colony formation in soft agar. The results are listed in Table 1. Immediately after stable transfection and selection (passage 8), no colony formation was observed in L-gp130 clones #1 to #3. Interestingly, all three clones expanded in long-term culture developed the ability to generate colonies in soft agar beyond approximately passage 60-65. In contrast, no colony growth was scored for mock-transfected FH-hTERT. Corresponding to the colony assay data, tumor formation was observed in athymic nude mice transplanted with L-gp130 clones (passage 8) after a latency period of 2-3 months. Tumors formed in 67% of clone #1 and in 33% of clone #3 transplantation sites. As expected, no tumor formation was detected in mice transplanted with mock-transfected FH-hTERT during a 1-year observation period (Table 2).
Table 1: Anchorage-independent growth
Cell clone |
Passage 8 |
Passage >60-65 |
|||
|---|---|---|---|---|---|
Cells seeded |
15,000 |
5,000 |
10,000 |
20,000 |
|
FH-hTERT control |
0 |
0 |
1 ± 1 |
0 |
|
Clone #1 |
0 |
16 ± 4 |
45 ± 7 |
118 ± 18 |
|
Clone #2 |
0 |
28 ± 9 |
67 ± 8 |
143 ± 9 |
|
Clone #3 |
0 |
27 ± 6 |
63 ± 7 |
137 ± 11 |
|
Mean ± SD.
Table 2: Tumor formation in athymic nude mice
Clone |
Sites |
Tumors (%) |
Weeks |
|---|---|---|---|
FH-hTERT control |
6 |
0 |
NA |
Clone #1 |
6 |
4 (66.7) |
8.5 ± 0.7 |
Clone #2 |
6 |
0 |
NA |
Clone #3 |
6 |
2 (33.3) |
10.3 ± 0 |
NA, not applicable. Mean ± SD.
Challenge with oxidative stress
In chronic hepatitis, gene alterations are driven by ROS. To elucidate downstream mechanisms driving the transformation process, we challenged our L-gp130 clone #1 to #3 in early expansion culture with oxidative stress and monitored phenotype changes by soft agar assay. Challenge with oxidative stress accelerated the transformation process occurring in long-term culture (see above) and colony formation was detected rapidly after treatment with hydrogen peroxide/DL-buthionine-[S,R]-sulfoximine (H2O2/BSO) (Figure 2A). In order to dissect the underlying gp130- and ROS-induced mechanisms, we measured ROS levels. As expected, FH-hTERT expressing the non-structural hepatitis C virus protein NS5A showed higher ROS levels, even without additional ROS challenge (Figure 2B). In contrast, our untreated L-gp130 clones showed ROS levels comparable to untreated mock-transfected FH-hTERT. Remarkably, challenge with H2O2/BSO resulted in up to 3-fold higher ROS levels in our clones #1 to #3 compared to treated control cells (Figure 2B). To test if these higher ROS levels result in more DNA damage, we visualized DSB by immunofluorescent staining for γ-H2AX (Figure 2C). Without ROS challenge, clone #1 to #3 with active gp130 showed similar quantities of γ-H2AX foci in comparison to mock-transfected cells (Figure 2D). After H2O2/BSO treatment, however, we observed an up to 6-fold increase in the number of γ-H2AX foci in our L-gp130 clones. Next, we monitored cell cycle arrest after induction of oxidative stress by testing the expression of P21, which is a transcriptional target of p53 and plays a crucial role in mediating cell cycle arrest in cells with DSB. Compared to untreated control cells, untreated L-gp130 clones showed lower expression of the regulator P21. However, similar to the control cells P21 expression was upregulated in response to higher ROS levels in all three L-gp130 clones. Moreover, although H2O2/BSO treated clones displayed significantly higher ROS levels resulting in more DSB (see above), expression of P21 was lower compared to treated mock-transfected FH-hTERT (Figure 3A). Determination of S-phase fractions by BrdU-incorporation of treated and untreated cells confirmed the lack of P21-mediated cell cycle arrest. Representative plots are shown in Figure 3B. Without treatment, S-phase fractions of all L-gp130 clones were between 30-40% (Figure 3C). Following H2O2/BSO treatment, FH-hTERT control cells displayed a reduction in the S-phase fraction compared to untreated control cells, which indicates robust cell cycle arrest induced by oxidative stress. In sharp contrast, our L-gp130 clones did not show a reduced S-phase fraction, but rather exhibited an enhanced proliferation following H2O2/BSO treatment.
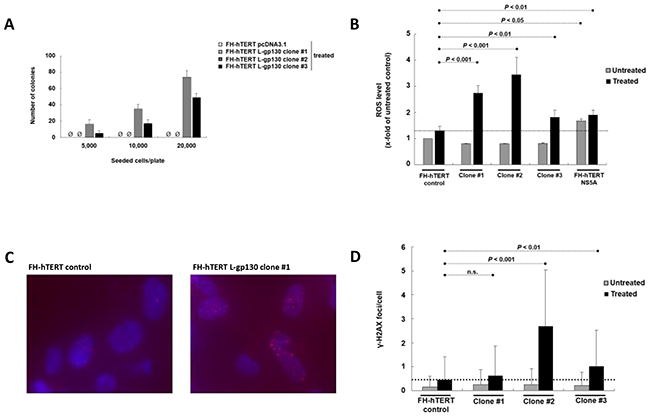
Figure 2: Challenge with oxidative stress and consequences of higher ROS levels. A. Colony formation induced by oxidative stress. Number of colonies per 5000, 10,000, and 20,000 seeded cells on 60-mm tissue culture dishes after 4 weeks. Treatment with H2O2/BSO was performed 12 h before seeding. B. Levels of ROS with and without induction of oxidative stress. ROS levels of untreated cells ( ) are compared to ROS levels after H2O2/BSO treatment for 90 min (■). In comparison to treated mock-transfected FH-hTERT (dashed line), H2O2/BSO treatment resulted in higher ROS levels in L-gp130 clones. FH-hTERT NS5A served as an additional positive control. C. γ-H2AX foci were visualized by fluorescent staining. The photographs show representative pictures of L-gp130-positive cells and FH-hTERT control after challenge with ROS. D. Quantitative analysis of γ-H2AX foci formation expressed as average amount of foci per cell ± SD (error bars).
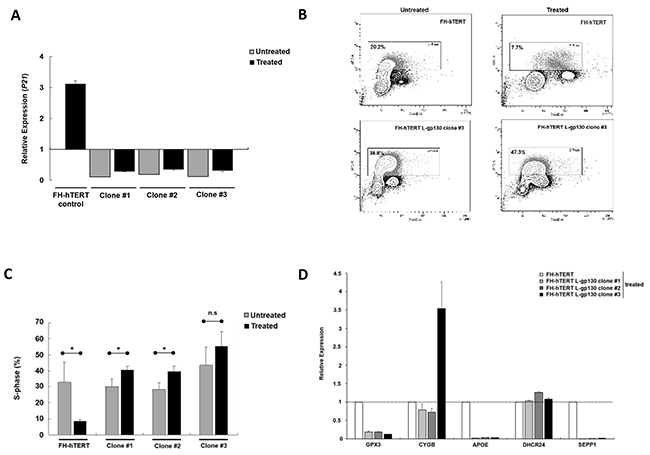
Figure 3: Mechanisms of ROS-induced transformation. A. Levels of P21. RNA was extracted after 8 h treatment and relative expression levels were determined by qPCR with a basket housekeeper as internal control and mock-transfected FH-hTERT as calibrator (expression level = 1). Bar graphs represent average expression levels ± SD (error bars). B. Flow cytometric measurement of total DNA and incorporated BrdU. Representative BrdU APC-A vs. DNA 7-AAD-A plots (FSC-A vs. SSC-A gated cell population) showing G0/G1, S, and G2/M fractions from treated and untreated control and L-gp130-positive cells. Cells in S-phase are framed. C. Cell proliferation under oxidative stress determined by BrdU incorporation assay. Depicted are average S-phase fractions ± SD (error bars) of treated (■) and untreated () clones and control cells. P-values are as indicated, P ≤0.05 (*), P ≤0.01 (**), P ≤0.001 (***), and not significant (n.s.). D. Changes in gene expression post ROS exposure. Relative expression of GPX3, CYGB, APOE, DHCR24, and SEPP1 in L-gp130 clones in comparison to FH-hTERT control (expression level=1).
Antioxidative stress response
In order to understand the higher ROS levels in our clones following H2O2/BSO treatment, we profiled the expression of various genes related to oxidative stress and the response mechanisms employing PCR array technology. The assay revealed an upregulation of glutathione peroxidase 3 (GPX3) and cytoglobin (CYGB) in all three L-gp130 clones in comparison to mock-transfected cells (Supplementary Figures S1A and S1C). Expression of the antioxidant apolipoprotein E (APOE) was 10-fold downregulated (Supplementary Figure S1D), and 24-dehydrocholesterol reductase (DHCR24) and selenoprotein P (SEPP1), oxidative stress responsive genes, were also considerably altered in the three clones (Supplementary Figure S1H). Relevant genes detected by this PCR array, were further monitored by quantitative real-time PCR (qPCR) in our L-gp130 clones with and without additional ROS challenge (Figure 3D). Despite H2O2/BSO treatment, all three L-gp130 clones showed lower expression levels for GPX3, APOE, and SEPP1, compared to treated FH-hTERT control cells. In addition, expression of CYGB was much higher in clone #3 than in the control cells. Expression levels of DHCR24 were similar in all treated cells. Furthermore, we measured the expression of NQO1, coding for NAD(P)H dehydrogenase (quinone) 1. NQO1 is a transcriptional target of the master antioxidant regulator nuclear factor (erythroid-derived 2)-like 2 (NRF2). We quantified the expression of NQO1 in all three L-gp130 clones without ROS-challenge. Two clones showed slightly higher NQO1 expression in comparison to untreated FH-hTERT control cells (Supplementary Figure S2); however, we could not detect a uniform and reproducible alteration in NQO1 expression (as marker for NRF2 activation) in our gp130-activated clones.
DISCUSSION
Under normal conditions, activation of STAT3 (downstream of gp130) induces cyclin D1, D2, and B1, as well as c-myc, and downregulates the expression of P21, thus promoting entry into the cell cycle [10]. Furthermore, IL-6 (upstream of gp130) is essential to control cell proliferation in healthy hepatocytes [11]. However, and in contrast to these findings, proliferation was not enhanced in our immortalized hepatocyte clones FH-hTERT following constitutive gp130 activation, although STAT3 was activated and P21 expression was lower than expected. In line with our observation, Santer et al. demonstrated an anti-proliferative effect of IL-6 in prostate cancer cell lines [12]. Thus, our data indicate that the growth-promoting effect of gp130 may be restricted to otherwise quiescent cells, e.g. hepatocytes in liver inflammation. In our study, constitutive gp130 activation induced a less serum-sensitive cell growth, and decreased contact inhibition. Interestingly, colony formation in soft agar, an established in vitro indicator for malignant transformation, was not present after transfection with L-gp130, but developed in all three clones during long-term expansion culture. Corresponding to the colony assay data, tumors formed in mice transplanted with Lgp-130 clones. In summary, all three analyzed L-gp130 clones displayed a pre-malignant phenotype; however, a transformed phenotype (colony formation) was not observed immediately after transfection with gp130 construct. These findings confirm the feasibility of our model for the investigation of gp130- and ROS-associated mechanisms promoting the transformation processes in proliferating hepatocytes. Furthermore and in accordance with our findings, transgenic animals with overexpression of IL-6 and IL-6R under the control of a liver-specific promoter develop nodules of hepatocellular hyperplasia identical to human nodular hyperplasia of an inflammatory background [13]. Over the time, these lesions progress into large liver adenomas, but not HCC. Regarding human HCC, tumors with gp130 mutations always display an additional activating mutation of the β-catenin pathway, indicating that additional hits are required for malignant transformation of hepatocytes with forced gp130 activation [8].
Alterations in redox balance and oxidative stress levels are a hallmark of carcinogenesis [14]. ROS activate various signaling cascades that regulate cell growth and transformation [15]. Furthermore, oxidative stress causes DNA damage by inducing the formation of DNA adducts, such as 8-oxo-2′-deoxyguanosine [16]. Along this line, patients with chronic hepatitis showed an increased production of ROS and higher levels of 8-oxo-2′-deoxyguanosine in hepatocytes with high risk for transformation [17]. Moreover, elevated oxidative stress was reported in the Mdr2-/- mice in the chronic inflammatory stages, indicating that oxidative stress plays a pivotal driving role in hepatocyte transformation [18]. To investigate the oncogenic potential of oxidative stress in human hepatocytes with activated IL-6 signaling, we induced ROS by treating our clones with H2O2/BSO. Challenge with oxidative stress strikingly accelerated the transformation process observed in long-term culture and colony formation was detected rapidly after H2O2/BSO treatment. Furthermore, after challenge with oxidative stress, ROS levels were up to 3-fold higher in L-gp130 clones compared to treated mock-transfected FH-hTERT (control cells without gp130 activation). These higher ROS levels were associated with an increased frequency of DNA damage, as demonstrated by staining for DSB. In general, DSB activate the DNA damage response machinery that in turn leads to cell cycle arrest, DNA repair, and apoptosis. To examine DSB-induced cell cycle control mechanisms in our L-gp130 clones, P21 expression was measured by qPCR and S-phase fractions were determined by the measurement of BrdU incorporation. Surprisingly, L-gp130 clones did not enter cell cycle arrest despite higher ROS and DSB levels and even displayed an enhanced proliferation. Fuke and colleagues have shown that inhibition of JAK/STAT3 signaling in HepG2 cells (with constitutive STAT3 activation) exerts an antiproliferative effect on the cell-cycle while p16 and p21 are upregulated [19]. Moreover, Phesse and co-workers have observed that partial suppression of JAK/STAT3 signaling in APC-mutant mice is sufficient to diminish tumor growth by reducing Bmi-1 dependent repression of p21 and p16 [20]. Based on our data and these reports, impairment of p21 activation in our cell clones may directly be triggered by gp130 overexpression. However, further investigations are required to fully characterize this interaction. Nevertheless, our findings corroborate the key observations regarding the role of IL-6 in chronic liver inflammation and hepatocarcinogenesis in murine liver cancer models. For example, in the Mdr2-/- model, hepatocytes with genomic instability are much more likely to escape from cell cycle arrest following partial hepatectomy with consecutive IL-6-mediated regenerative stress [9]. In our cell clones, decreased cell cycle arrest due to gp130 activation promotes the accumulation of unrepaired DSB, thus facilitating transformation.
To identify the gp130-related mechanism leading to higher ROS levels in our clones, we profiled the expression of various genes related to oxidative stress and the associated response mechanisms. Despite similar ROS levels without treatment, we detected a significantly altered expression of GPX3, CYGB, APOE, DHCR24, and SEPP1 in our L-gp130 clones. GPX3 belongs to the family of glutathione peroxidases, the most important ROS scavengers [21], and its expression is suppressed in a variety of cancers. A strong suppression is reported for prostate cancer, thyroid cancer, colorectal cancer, gastric cancer, and breast cancer [22, 23]. Interestingly, GPX3 expression was higher in clear cell epithelial ovarian carcinoma tissue compared to healthy control, suggesting a tumor-specific activity of GPX3 [24]. The expression of GPX3 in the transformation of hepatocytes has not been studied so far. APOE is a glycoprotein and a ligand for the LDL receptor or the remnant receptor involved in lipid metabolism [25]. Yokoyama et al. reported increased APOE protein levels in 88% of HCC patients, but without upregulation in APOE gene expression and serum levels, thus suggesting an accumulation by impaired secretion [26]. In our gp130-activated clones, a robust decrease in APOE expression was observed after H2O2/BSO treatment. SEPP1 acts as a selenium transport protein, a heavy-metal chelator, and an antioxidant [27]. In normal mucosa, SEPP1 is highly expressed whereas a significant reduction or loss of SEPP1 expression is detected, for instance, in colon cancer [28]. SEPP1 is also suppressed in a subset of human prostate tumors, mouse tumors, and several prostate cancer cell lines [29]. CYGB expression was slightly downregulated in two out of three L-gp130 clones after challenge with oxidative stress. CYGB overexpression protects the human neuronal cell line TE671 from pro-oxidant RO19-8022-induced DNA damage [30]. Moreover, in vitro and in vivo overexpression of CYGB in rat hepatic stellate cells protects these cells against oxidative stress [31]. A downregulation has been reported in several human cancers, in particular head and neck cancer, ovarian cancer, and breast cancer [32]. Furthermore, loss of CYGB in Cygb-/- mice increased their susceptibility to diethylnitrosamine-induced tumorgenesis, indicating a tumor suppressive function of CYGB [32]. High levels of the oxidoreductase DHCR24 mediate resistance against oxidative stress and prevent apoptotic cell death [33]. Induction of DHCR24 by hepatitis C virus also impairs apoptosis induced by oxidative stress and inhibits p53 [34]. In our immortalized clones, we observed a slightly increased DHCR24 expression after ROS treatment as a result of gp130 activation. Additionally, we measured NQO1 expression, one of the target genes of NRF2, regarded as the principal regulator of cytoprotective and antioxidant genes. Recently, a meta-analysis has suggested that NQO1 variant alleles and genotypes are significantly related to an increased risk of hepatocarcinogenesis [35]. In our cell clones, we could not detect a universal and reproducible alteration of NQO1 expression as a consequence of gp130 activation. Therefore, these data do not suggest a direct interaction between gp130 and NRF2.
In summary, our data demonstrate that permanent genetically driven IL-6 pathway activation (by gain-of-function mutations in gp130), directly impairs oxidative stress response, causing higher ROS levels and subsequently a higher frequency of DSB. In addition, enhanced cell cycle turnover driven by gp130 pushes pre-malignant cells with genetic alterations through additional cell cycle rounds and leads to the accumulation of unrepaired DSB, finally resulting in the transformation of our L-gp130 clones (and cells in IHCA). This finding explains the rather high frequency of gp130 mutations in HCC that have developed from IHCA or dysplastic intrahepatic nodules in chronic liver inflammation.
MATERIAL AND METHODS
Cell lines
Immortalized FH-hTERT cells were used at population doubling 35-40 [36]. HepG2 cells (obtained from ATCC, HB-8065) were cultured as control human HCC cell line. FH-hTERT stably transfected with the hepatitis C virus non-structural protein NS5A served as an additional control.
Plasmids and transfection
To mimic activated IL-6 signaling, FH-hTERT were stably transfected with the constitutively active L-gp130 construct [37]. The empty vector pcDNA3.1 (Invitrogen, Karlsruhe, Germany) was transfected as vector control. Cells were nucleofected using Nucleofector Solution V (Amaxa, Köln, Germany) and program T30, and subsequently selected with 200 μg/ml Zeocin (Invitrogen) for L-gp130 and 200 μg/ml Geneticin (Invitrogen) for the empty vector control.
Selection of single-cell clones
We derived single cell-clones with stable expression of L-gp130 by seeding 100 cells of the transfected culture on 60-mm tissue culture dishes. During the following 2-3 weeks, seven single-cell clones were picked with cloning rings (Sigma-Aldrich, Seelze, Germany) and expanded for further characterization.
Immunoblot to determine downstream pathway activation
Proteins were extracted and quantified with the BCA Protein Assay Kit (Pierce Biotechnology, Rockford, IL, USA). Primary antibody solution detecting pSTAT3 (1:1000; #9131; Cell Signaling Technology, Danvers, MA, USA) or pERK1/2 (1:1000; #9101; Cell Signaling Technology) were incubated at 4°C overnight. Incubation with the secondary antibody solution conjugated with horseradish peroxidase was performed for 1 h at room temperature. Visualization was achieved by enhanced chemiluminescence. Actin (1:2000; #sc-1616; Santa Cruz Biotechnology, Santa Cruz, CA, USA), STAT3 (1:1000; #9132; Cell Signaling Technology), and ERK1/2 (1:1000; #4695; Cell Signaling Technology) served as loading controls.
Cell proliferation and serum dependence
Proliferation was monitored as described [38]. To investigate serum dependence, cells were seeded and serum was omitted or changed to 2% in the following medium changes.
Contact inhibition
Cell-cycle profiles of near-confluent (40-60%) and super-confluent cultures (culture for >1 day after reaching 100% confluency) were obtained by FACS evaluation as described [39], employing the operator-independent analysis software FlowJo 7.5 (FlowJo, LLC; Ashland, OR, USA).
Anchorage-independent growth
Soft agar colony assays were performed as previously summarized [36].
Tumor formation in nude mice
To investigate malignant transformation in vivo, L-gp130 clones were transplanted in approximately 10-week-old athymic nude mice (NMRI-Foxn1nu, female, 21-25 g body weight; Charles River Laboratories, Sulzfeld, Germany). Animal protocols were approved by the local review board (protocol number 6/12) and the experiments were performed as described before [38].
Induction and quantification of oxidative stress
To induce oxidative stress, we treated the cells with 400 µM H2O2 and 5 µM BSO, a glutathione depleting agent (Sigma-Aldrich). If not mentioned otherwise, treatment was completed after 12 h. ROS levels were measured by FACS analysis using carboxy-H2DCFDA (Invitrogen). In brief, 0.25 x 10⁶ cells were seeded in tissue culture flasks (T25, 25 cm2) and cultured until 80-90% confluency and washed with HBSS. After incubation with 25 µM carboxy-H2DCFDA diluted in HBSS for 30 min at 37°C, ROS treatment was performed for 60-90 min.
Detection of DNA double strand breaks
To quantify DSB after H2O2/BSO treatment, we visualized γH2AX foci by fluorescent staining according to Koch et al. [40]. For quantitative analysis, foci were counted with a Zeiss Axioplan 2 imaging microscope (Zeiss, Oberkochen, Germany) using a 63-fold magnification. One hundred cells per slide and experiment were evaluated blindly.
Incorporation of BrdU
To detect the effect of oxidative stress on DNA synthesis, proliferation was determined with the APS BrdU Flow Kit (BD Biosciences, Heidelberg, Germany). Cells were plated at a density of 0.35 x 10⁶ cells per T25 and cultured until 70-80% confluency. Following the indicated treatment, cells were incubated for 45 min at 37°C with BrdU at a final concentration of 10 µM in cell culture medium. Fixation and staining was performed according to the manufacturer’s protocol. Finally, S-phase fractions were determined using a FACSCanto flow cytometer (BD Biosciences).
Gene expression analysis
RNA was extracted with NucleoSpin RNA II Kit (Machery-Nagel, Bethlehem, PA, USA) and reverse transcribed with Transcriptor First Strand cDNA Synthesis Kit (Roche Diagnostics, Penzberg, Germany). After diluting the cDNA synthesis reaction with ddH2O (1:5.55), expression profiling was executed with the Human Oxidative Stress and Antioxidant Defense RT2 Profiler PCR Array (SABiosciences, Frederick, MD, USA) on an ABI Prism 7900H thermal cycler (Applied Biosystems, CA, USA). Expression levels were determined by comparative quantification (2-ΔΔCt) employing mock-transfected FH-hTERT as calibrator (expression level = 1). Results were confirmed by qPCR for GPX3, CYGB, APOE, DHCR24, and SEPP1, following challenge with oxidative stress. We also measured NQO1 expression by qPCR in untreated clones as described below. Gene expression of P21 was detected to monitor cell cycle arrest after 8 h H2O2/BSO treatment. We employed validated primer sets for the specified genes (Qiagen, Hilden, Germany) in combination with the QuantiTect SYBR Green PCR Master Mix (Qiagen) and a basket housekeeper containing glyceraldehyde-3-phosphate dehydrogenase (GAPDH), ribosomal protein L13a (RPL13A), beta-2-microglobulin (B2M), and TATA box binding protein (TBP). The basket housekeeper was amplified and the mean cycle number at threshold (Ct) was used for comparative quantification. Expression levels were determined by an efficiency-corrected model and by using FH-hTERT control cells as calibrator (expression level = 1) as described [39].
Statistical analysis
All experiments were performed with two to three repetitions. Data are presented as means ± standard deviation (SD). The unpaired Student´s t-test was used for statistical analysis and P values less than 0.05 were considered statistically significant.
ACKNOWLEDGMENTS
This work was supported by the Deutsche Forschungsgemeinschaft [SFB 841 project C5 HW, SFB 841 project C1 SRJ].
CONFLICTS OF INTEREST
The authors declare no conflict of interest.
REFERENCES
1. Bioulac-Sage P, Rebouissou S, Thomas C, Blanc JF, Saric J, Sa Cunha A, Rullier A, Cubel G, Couchy G, Imbeaud S, Balabaud C, Zucman-Rossi J. Hepatocellular adenoma subtype classification using molecular markers and immunohistochemistry. Hepatology. 2007; 46: 740-748.
2. Zucman-Rossi J, Jeannot E, Nhieu JT, Scoazec JY, Guettier C, Rebouissou S, Bacq Y, Leteurtre E, Paradis V, Michalak S, Wendum D, Chiche L, Fabre M, et al. Genotype-phenotype correlation in hepatocellular adenoma: new classification and relationship with HCC. Hepatology. 2006; 43: 515-524.
3. Kishimoto T. IL-6: from its discovery to clinical applications. International immunology. 2010; 22: 347-352.
4. Bromberg J. Stat proteins and oncogenesis. The Journal of clinical investigation. 2002; 109: 1139-1142.
5. Grivennikov S, Karin M. Autocrine IL-6 signaling: a key event in tumorigenesis?, Cancer cell. 2008; 13: 7-9.
6. Nakagawa H, Maeda S, Yoshida H, Tateishi R, Masuzaki R, Ohki T, Hayakawa Y, Kinoshita H, Yamakado M, Kato N, Shiina S, Omata M. Serum IL-6 levels and the risk for hepatocarcinogenesis in chronic hepatitis C patients: an analysis based on gender differences. International journal of cancer. 2009; 125: 2264-2269.
7. Wong VW, Yu J, Cheng AS, Wong GL, Chan HY, Chu ES, Ng EK, Chan FK, Sung JJ, Chan HL. High serum interleukin-6 level predicts future hepatocellular carcinoma development in patients with chronic hepatitis B. International journal of cancer. 2009; 124: 2766-2770.
8. Rebouissou S, Amessou M, Couchy G, Poussin K, Imbeaud S, Pilati C, Izard T, Balabaud C, Bioulac-Sage P, Zucman-Rossi J. Frequent in-frame somatic deletions activate gp130 in inflammatory hepatocellular tumours. Nature. 2009; 457: 200-204.
9. Barash H, R Gross E, Edrei Y, Ella E, Israel A, Cohen I, Corchia N, Ben-Moshe T, Pappo O, Pikarsky E, Goldenberg D, Shiloh Y, Galun E, et al. Accelerated carcinogenesis following liver regeneration is associated with chronic inflammation-induced double-strand DNA breaks. Proceedings of the National Academy of Sciences of the United States of America. 2010; 107: 2207-2212.
10. Ara T, Declerck YA, Interleukin-6 in bone metastasis and cancer progression. European journal of cancer. 2010; 46: 1223-1231.
11. Cressman DE, Greenbaum LE, DeAngelis RA, Ciliberto G, Furth EE, Poli V, Taub R. Liver failure and defective hepatocyte regeneration in interleukin-6-deficient mice. Science. 1996; 274: 1379-1383.
12. Santer FR, Malinowska K, Culig Z, Cavarretta IT. Interleukin-6 trans-signalling differentially regulates proliferation, migration, adhesion and maspin expression in human prostate cancer cells. Endocrine-related cancer. 2010; 17: 241-253.
13. Maione D, Di Carlo E, Li W, Musiani P, Modesti A, Peters M, Rose-John S, Della Rocca C, Tripodi M, Lazzaro D, Taub R, Savino R, Ciliberto G. Coexpression of IL-6 and soluble IL-6R causes nodular regenerative hyperplasia and adenomas of the liver. The EMBO journal. 1998; 17: 5588-5597.
14. Glasauer A, Chandel NS. Targeting antioxidants for cancer therapy. Biochemical pharmacology. 2014; 92: 90-101.
15. Finkel T, Holbrook NJ. Oxidants, oxidative stress and the biology of ageing. Nature. 2000; 408: 239-247.
16. Shigenaga MK, Gimeno CJ, Ames BN. Urinary 8-hydroxy-2′-deoxyguanosine as a biological marker of in vivo oxidative DNA damage. Proceedings of the National Academy of Sciences of the United States of America. 1989; 86: 9697-9701.
17. Kitada T, Seki S, Iwai S, Yamada T, Sakaguchi H, Wakasa K. In situ detection of oxidative DNA damage, 8-hydroxydeoxyguanosine, in chronic human liver disease. Journal of hepatology. 2001; 35: 613-618.
18. Katzenellenbogen M, Pappo O, Barash H, Klopstock N, Mizrahi L, Olam D, Jacob-Hirsch J, Amariglio N, Rechavi G, Mitchell LA, Kohen R, Domany E, Galun E, et al. Multiple adaptive mechanisms to chronic liver disease revealed at early stages of liver carcinogenesis in the Mdr2-knockout mice. Cancer research. 2006; 66: 4001-4010.
19. Fuke H, Shiraki K, Sugimoto K, Tanaka J, Beppu T, Yoneda K, Yamamoto N, Ito K, Masuya M, Takei Y. Jak inhibitor induces S phase cell-cycle arrest and augments TRAIL-induced apoptosis in human hepatocellular carcinoma cells. Biochem Biophys Res Commun. 2007; 363: 738-44.
20. Phesse TJ, Buchert M, Stuart E, Flanagan DJ, Faux M, Afshar-Sterle S, Walker F, Zhang HH, Nowell CJ, Jorissen R, Tan CW, Hirokawa Y, Eissmann MF, et al. Partial inhibition of gp130-Jak-Stat3 signaling prevents Wnt-β-catenin-mediated intestinal tumor growth and regeneration. Sci Signal. 2014; 7: ra 92.
21. Takahashi K, Avissar N, Whitin J, Cohen H. Purification and characterization of human plasma glutathione peroxidase: a selenoglycoprotein distinct from the known cellular enzyme. Archives of biochemistry and biophysics. 1987; 256: 677-686.
22. Agnani D, Camacho-Vanegas O, Camacho C, Lele S, Odunsi K, Cohen S, Dottino P, Martignetti JA. Decreased levels of serum glutathione peroxidase 3 are associated with papillary serous ovarian cancer and disease progression. Journal of ovarian research. 2011; 4: 18.
23. Nakagawa H, Maeda S, Yoshida H, Tateishi R, Masuzaki R, Ohki T, Hayakawa Y, Kinoshita H, Yamakado M, Kato N, Shiina S, Omata M. Serum IL-6 levels and the risk for hepatocarcinogenesis in chronic hepatitis C patients: an analysis based on gender differences. International journal of cancer. 2009; 125: 2264-2269.
24. Saga Y, Ohwada M, Suzuki M, Konno R, Kigawa J, Ueno S, Mano H. Glutathione peroxidase 3 is a candidate mechanism of anticancer drug resistance of ovarian clear cell adenocarcinoma. Oncology reports. 2008; 20: 1299-1303.
25. Mahley RW. Apolipoprotein E: cholesterol transport protein with expanding role in cell biology. Science. 1988; 240: 622-630.
26. Yokoyama Y, Kuramitsu Y, Takashima M, Iizuka N, Terai S, Oka M, Nakamura K, Okita K, Sakaida I. Protein level of apolipoprotein E increased in human hepatocellular carcinoma. International journal of oncology. 2006; 28: 625-631.
27. Papp LV, Lu J, Holmgren A, Khanna KK. From selenium to selenoproteins: synthesis, identity, and their role in human health. Antioxidants & redox signaling. 2007; 9: 775-806.
28. Al-Taie OH, Uceyler N, Eubner U, Jakob F, Mork H, Scheurlen M, Brigelius-Flohe R, Schottker K, Abel J, Thalheimer A, Katzenberger T, Illert B, Melcher R, et al. Expression profiling and genetic alterations of the selenoproteins GI-GPx and SePP in colorectal carcinogenesis. Nutrition and cancer. 2004; 48: 6-14.
29. Calvo A, Xiao N, Kang J, Best CJ, Leiva I, Emmert-Buck MR, Jorcyk C, Green JE. Alterations in gene expression profiles during prostate cancer progression: functional correlations to tumorigenicity and down-regulation of selenoprotein-P in mouse and human tumors. Cancer research. 2002; 62: 5325-5335.
30. Hodges NJ, Innocent N, Dhanda S, Graham M. Cellular protection from oxidative DNA damage by over-expression of the novel globin cytoglobin in vitro. Mutagenesis. 2008; 23: 293-298.
31. Xu R, Harrison PM, Chen M, Li L, Tsui TY, Fung PC, Cheung PT, Wang G, Li H, Diao Y, Krissansen GW, Xu S, Farzaneh F. Cytoglobin overexpression protects against damage-induced fibrosis. Molecular therapy. 2006; 13: 1093-1100.
32. Thuy le TT, Morita T, Yoshida K, Wakasa K, Iizuka M, Ogawa T, Mori M, Sekiya Y, Momen S, Motoyama H, Ikeda K, Yoshizato K, Kawada N. Promotion of liver and lung tumorigenesis in DEN-treated cytoglobin-deficient mice. The American journal of pathology. 2011; 179: 1050-1060.
33. Saito M, Kohara M, Tsukiyama-Kohara K. Hepatitis C virus promotes expression of the 3beta-hydroxysterol delta24-reductase through Sp1. Journal of medical virology. 2012; 84: 733-746.
34. Nishimura T, Kohara M, Izumi K, Kasama Y, Hirata Y, Huang Y, Shuda M, Mukaidani C, Takano T, Tokunaga Y, Nuriya H, Satoh M, Saito M, et al. Hepatitis C virus impairs p53 via persistent overexpression of 3beta-hydroxysterol Delta24-reductase. The Journal of biological chemistry. 2009; 284: 36442-36452.
35. Fan Y, Hu D, Feng B, Wang W. The NQO1 C609T polymorphism and hepatocellular carcinoma risk. Tumour Biol. 2014; 35: 7343-50.
36. Wege H, Le HT, Chui MS, Liu L, Wu J, Giri R, Malhi H, Sappal BS, Kumaran V, Gupta S, Zern MA. Telomerase reconstitution immortalizes human fetal hepatocytes without disrupting their differentiation potential. Gastroenterology. 2003; 124: 432-44.
37. Stuhlmann-Laeisz C, Lang S, Chalaris A, Krzysztof P, Enge S, Eichler J, Klingmuller U, Samuel M, Ernst M, Rose-John S, Scheller J. Forced dimerization of gp130 leads to constitutive STAT3 activation, cytokine-independent growth, and blockade of differentiation of embryonic stem cells. Molecular biology of the cell. 2006; 17: 2986-2995.
38. Heim D, Cornils K, Schulze K, Fehse B, Lohse AW, Brummendorf TH, Wege H. Retroviral insertional mutagenesis in telomerase-immortalized hepatocytes identifies RIPK4 as novel tumor suppressor in human hepatocarcinogenesis. Oncogene. 2015; 34: 364-372.
39. Wege H, Heim D, Lutgehetmann M, Dierlamm J, Lohse AW, Brummendorf TH. Forced activation of beta-catenin signaling supports the transformation of hTERT-immortalized human fetal hepatocytes. Molecular cancer research. 2011; 9: 1222-1231.
40. Koch K, Wrona A, Dikomey E, Borgmann K. Impact of homologous recombination on individual cellular radiosensitivity. Radiotherapy and oncology. 2009; 90: 265-272.