
Introduction
Cancer, which is an extremely complex and multifaceted disease involving multiple steps, is a leading cause of death worldwide. During last decades, considerable advancements have taken place in the development of better therapeutic interventions for cancer; however, chemo-resistance and disease recurrence have resulted in minimal disease outcome and poor survival rates [1]. Cancer stem cells (CSCs) are a small population of cells within a tumor and play a crucial role in cancer progression and recurrence. Because of their ability for self-renewal, they may initiate tumor growth and promote metastasis; thereby leading to aggressive forms of the disease. [2-6]. Hence, CSCs represent the most attractive and promising targets in clinical oncology [7].
Cluster of differentiation (CD) 44, a well-recognized CSC marker [8, 9], is a multistructural and multifunctional transmembrane glycoprotein that belongs to a family of cell adhesion receptors and is widely expressed in most mammalian cells [10, 11]. The gene for CD44 is complex (aprox 50 Kb), located on human chromosome 11p13, comprising 20 exons out of which 10 exons (exon 6-15) are involved in alternative splicing of CD44 to generate many standard (CD44s) and variant isoforms (CD44v) of varying sizes [12, 13]. Although CD44 is the major receptor for hyaluronan (HA), the main component of the extracellular matrix, it can also bind with MMPs, collagens and osteopontin. It is involved in maintenance of cell-cell/extracellular matrix (ECM) interactions, cell adhesion, cell trafficking and migration etc. [14-17]. In addition, it mediates multiple vital biological processes such as angiogenesis, cell proliferation, cell differentiation and presentation of cytokines, chemokines and growth factors to the corresponding receptors, docking of proteases as well as cell survival signaling that are closely associated with neoplastic transformation and tumor progression [18-20].
Several evidences have firmly established the role of CD44 in cell differentiation, epithelial -mesenchymal transition (EMT), invasion and metastatic spread in various human cancers [21-25]. In addition, CD44 aberrations have been shown to confer apoptosis resistance [26]. It was found to act like a tumor promoter in some cancers while it functioned as a tumor-suppressor in others [27]. Increased or decreased expression of CD44s or CD44v molecules has been reported in various cancers and shown to be associated with increased tumor aggressiveness, metastasis, early tumor recurrence and chemo- or radio- resistance, as well as poor prognosis [28-31]. Further, CD44 targeting by monoclonal antibodies and blocking peptides has been established as a promising therapeutic approach for cancer [32-34].
Considering the important role of CD44 in carcinogenesis, several studies have explored the role of genetic variants of CD44 in cancer susceptibility, prognosis and chemotherapeutic response in various human cancers [35-38]. However, the results are controversial and the power of each study was restricted due to low sample size, necessitating further clarification of its role in cancer predisposition. Hence, we performed a meta-analysis of all eligible case-control studies to better interpret the associations between common SNPs of the CD44 gene (rs13347 C>T, rs10836347 C>T, rs11821102 G>A, rs713330 T>C, rs187115 T>C) and cancer risk.
Results
According to the search strategies mentioned above, we found a total of 13 case-control studies investigating the association of CD44 polymorphisms (rs13347 C>T, rs10836347 C>T, rs11821102 G>A, rs713330 T>C, rs187115 T>C) with cancer susceptibility [36, 38-49]. However, the study by Qiu et al. [49] in Chinese gastric patients lacked genotyping details for each of the studied SNP, hence excluded. Therefore, we included only 12 potential case-control studies in the present meta-analysis and the characteristics of each eligible study are presented in Table 1. Since all studies were performed in Asian populations and are limited for cancer types, we performed subgroup analysis only based on study design (population based; PB, hospital based; HB), cancer types (gastrointestinal cancer; GIC, Head and neck cancer; HNC, and other cancer) and genotyping methods (Taqman or others).
Table 1: Studies Included in CD44 Meta-Analysis
Author |
Country /Ethnicity |
Cancer type |
Design |
Case total |
WW |
WV |
VV |
Control total |
WW |
WV |
VV |
pHWE |
Genotyping Method |
CD44 rs13347 |
|||||||||||||
Jiang et al., 2012 |
China/Asian |
BRC |
PB |
1853 |
813 |
850 |
190 |
1992 |
1146 |
727 |
119 |
0.7949 |
MassArray |
Tulsyan et al., 2013 |
India/Asian |
BRC |
HP |
258 |
191 |
60 |
7 |
241 |
178 |
57 |
6 |
0.5773 |
Taqman |
Xiao et al., 2013 |
China/Asian |
NPC |
PB |
906 |
386 |
418 |
102 |
943 |
606 |
297 |
40 |
0.6367 |
MassArray |
Sharma et al., 2014 |
India/Asian |
GBC |
HP |
405 |
293 |
104 |
8 |
200 |
154 |
42 |
4 |
0.5716 |
Taqman |
Chou et al., 2014 |
Taiwan/Asian |
OC |
HP |
599 |
287 |
262 |
50 |
561 |
295 |
223 |
43 |
0.9241 |
Taqman |
Chou et al., 2014 |
Taiwan/Asian |
HCC |
HP |
203 |
110 |
72 |
21 |
561 |
295 |
223 |
43 |
0.9241 |
Taqman |
Lou et al., 2014 |
China/Asian |
NPC |
HP |
272 |
104 |
126 |
42 |
489 |
288 |
174 |
27 |
0.9147 |
Sequencing |
Weng et al., 2015 |
Taiwan/Asian |
BC |
HP |
275 |
138 |
111 |
26 |
275 |
143 |
117 |
15 |
0.1527 |
Taqman |
Wu et al., 2015 |
China/Asian |
CRC |
PB |
946 |
416 |
441 |
89 |
989 |
578 |
348 |
63 |
0.2788 |
MALDI-TOF |
Wu et al., 2015 |
China/Asian |
AML |
PB |
421 |
163 |
196 |
62 |
461 |
254 |
171 |
36 |
0.3398 |
MALDI-TOF |
Liu et al., 2015 |
China/Asian |
NSCLC |
HP |
234 |
179 |
51 |
4 |
468 |
337 |
121 |
10 |
0.8227 |
Taqman |
Verma et al., 2016 |
India/Asian |
BC |
HP |
240 |
152 |
73 |
15 |
270 |
140 |
104 |
26 |
0.30443 |
Taqman |
CD44 rs11821102 |
|||||||||||||
Jiang et al., 2012 |
China/Asian |
BRC |
PB |
1049 |
912 |
125 |
12 |
1157 |
997 |
151 |
9 |
0.2193 |
MassArray |
Xiao et al., 2013 |
China/Asian |
NPC |
PB |
906 |
796 |
100 |
10 |
943 |
805 |
129 |
9 |
0.1383 |
MassArray |
Chou et al., 2014 |
Taiwan/Asian |
OC |
HP |
599 |
531 |
63 |
5 |
561 |
481 |
75 |
5 |
0.283 |
Taqman |
Chou et al., 2014 |
Taiwan/Asian |
HCC |
HP |
203 |
173 |
29 |
1 |
561 |
481 |
75 |
5 |
0.283 |
Taqman |
Lou et al., 2014 |
China/Asian |
NPC |
HP |
280 |
252 |
27 |
1 |
496 |
439 |
54 |
3 |
0.3489 |
Sequencing |
Weng et al., 2015 |
Taiwan/Asian |
BC(TCC) |
HP |
275 |
234 |
39 |
2 |
275 |
222 |
50 |
3 |
0.9217 |
Taqman |
Wu et al., 2015 |
China/Asian |
CRC |
PB |
946 |
815 |
119 |
12 |
989 |
843 |
131 |
15 |
0.0003 |
MALDI-TOF |
Wu et al., 2015 |
China/Asian |
AML |
PB |
421 |
370 |
50 |
1 |
461 |
398 |
59 |
4 |
0.2792 |
MALDI-TOF |
CD44 rs10836347 |
|||||||||||||
Jiang et al., 2012 |
China/Asian |
BRC |
PB |
1049 |
906 |
139 |
4 |
1157 |
995 |
156 |
6 |
0.9657 |
MassArray |
Xiao et al., 2013 |
China/Asian |
NPC |
PB |
906 |
785 |
118 |
3 |
943 |
792 |
147 |
4 |
0.3064 |
MassArray |
Chou et al., 2014 |
Taiwan/Asian |
OC |
HP |
599 |
522 |
73 |
4 |
561 |
487 |
69 |
5 |
0.1524 |
Taqman |
Chou et al., 2014 |
Taiwan/Asian |
HCC |
HP |
203 |
180 |
23 |
0 |
561 |
487 |
69 |
5 |
0.1524 |
Taqman |
Lou et al., 2014 |
China/Asian |
NPC |
HP |
278 |
249 |
27 |
2 |
495 |
438 |
55 |
2 |
0.8462 |
Sequencing |
Wu et al., 2015 |
China/Asian |
CRC |
PB |
946 |
821 |
120 |
5 |
989 |
851 |
129 |
9 |
0.102 |
MALDI-TOF |
Wu et al., 2015 |
China/Asian |
AML |
PB |
421 |
364 |
55 |
2 |
461 |
404 |
55 |
2 |
0.9304 |
MALDI-TOF |
CD44 rs713330 |
|||||||||||||
Jiang et al., 2012 |
China/Asian |
BRC |
PB |
1049 |
865 |
172 |
12 |
1157 |
950 |
194 |
13 |
0.3851 |
MassArray |
Xiao et al., 2013 |
China/Asian |
NPC |
PB |
906 |
732 |
164 |
10 |
943 |
751 |
180 |
12 |
0.7441 |
MassArray |
Chou et al., 2014 |
Taiwan/Asian |
OC |
HP |
599 |
507 |
88 |
4 |
561 |
467 |
86 |
8 |
0.0857 |
Taqman |
Chou et al., 2014 |
Taiwan/Asian |
HCC |
HP |
203 |
167 |
36 |
0 |
561 |
467 |
86 |
8 |
0.0857 |
Taqman |
Weng et al., 2015 |
Taiwan/Asian |
BC(TCC) |
HP |
275 |
231 |
42 |
2 |
275 |
223 |
49 |
3 |
0.8669 |
Taqman |
Wu et al., 2015 |
China/Asian |
AML |
PB |
421 |
341 |
74 |
6 |
461 |
371 |
87 |
3 |
0.3854 |
MALDI-TOF |
CD44 rs187115 |
|||||||||||||
Sharma et al., 2014 |
India/Asian |
GBC |
HP |
405 |
248 |
126 |
31 |
200 |
125 |
61 |
14 |
0.0939 |
Taqman |
Chou et al., 2014 |
Taiwan/Asian |
OC |
HP |
599 |
336 |
227 |
36 |
561 |
403 |
143 |
15 |
0.5904 |
Taqman |
Chou et al., 2014 |
Taiwan/Asian |
HCC |
HP |
203 |
123 |
66 |
14 |
561 |
403 |
143 |
15 |
0.5904 |
Taqman |
Weng et al., 2015 |
Taiwan/Asian |
BC(TCC) |
HP |
275 |
178 |
87 |
10 |
275 |
204 |
68 |
3 |
0.3056 |
Taqman |
Liu et al., 2015 |
China/Asian |
NSCLC |
HP |
234 |
133 |
86 |
15 |
468 |
336 |
119 |
13 |
0.5322 |
Taqman |
Verma et al., 2016 |
India/Asian |
BC |
HP |
240 |
101 |
97 |
42 |
270 |
127 |
101 |
42 |
0.0053 |
Taqman |
BRC- Breast Cancer, NPC- Nasopharyngeal Carcinoma, GBC- Gallbladder Cancer, OC- Oral Cancer, HCC- Hepatocellular Carcinoma, BC (TCC)- Bladder Cancer (Transitional Cell Carcinoma), CRC- Colorectal Cancer, AML- Acute Myeloid Leukemia, NSCLC- Non-Small Cell Lung Cancer, MALDI-TOF-MS- Matrix Assisted Laser Desorption/Ionization Time of Flight, W - Wild allele, V - Variant allele.
Quality assessment
According to the Newcastle-Ottawa quality assessment scale (NOS), the quality of all recruited case-control studies and their total quality scores are summarized in Table 2. The quality scores ranged from 6 to 8 and the average score of case-control studies was 7.08. Thus, our NOS results indicated that most of these studies (9) in our meta-analysis were of high quality (NOS score 7 or 8) and only three studies with NOS score of 6 were classified into intermediate quality.
Table 2: Newcastle-Ottawa Scale Based Quality Assessment of Studies Included in CD44 Meta-Analysis
Author Name |
Selection |
Comparability |
Exposure |
Total scores |
||||||
1 |
2 |
3 |
4 |
1 |
2 |
1 |
2 |
3 |
||
Jiang et al., 2012 |
* |
* |
* |
* |
* |
* |
* |
* |
- |
8 |
Tulsyan et al., 2013 |
* |
* |
- |
* |
* |
* |
* |
* |
- |
7 |
Xiao et al., 2013 |
* |
* |
* |
* |
* |
* |
* |
* |
- |
8 |
Sharma et al., 2014 |
* |
* |
- |
* |
* |
* |
* |
* |
- |
7 |
Chou et al., 2014 |
* |
* |
- |
* |
* |
* |
* |
* |
- |
7 |
Chou et al., 2014 |
* |
* |
- |
* |
* |
* |
* |
* |
- |
7 |
Lou et al., 2014 |
* |
* |
- |
* |
* |
* |
* |
- |
6 |
|
Weng et al., 2015 |
* |
* |
- |
* |
* |
* |
* |
- |
6 |
|
Wu et al., 2015 |
* |
* |
* |
* |
* |
* |
* |
* |
- |
8 |
Wu et al., 2015 |
* |
* |
* |
* |
* |
* |
* |
- |
8 |
|
Liu et al., 2015 |
* |
* |
- |
* |
* |
* |
* |
* |
- |
6 |
Verma et al., 2016 |
* |
* |
- |
* |
* |
* |
* |
* |
- |
7 |
Selection: (1) Adequate definition of cases (yes, with independent validation, one star); (2) representativeness of the cases (if yes, one star); (3) selection of controls (one star for community controls,); (4) definition of controls (if no history of disease, one star). Comparability: comparability of cases and controls on the basis of design or analysis: (1) ethnicity matched (if yes, one star); (2) analysis age adjusted (if yes, one star). Exposure: (1) ascertainment of exposure (if in reliable method, one star); (2), same method of ascertainment for cases and controls (if yes, one star); (3) non-response rate (same rate for both group, one star).
CD44 rs13347
For CD44 rs13347 meta-analysis, a total of 12 articles [36, 38-48] with 6612 multiple cancer cases and 7450 controls were found to be eligible. The minor allele frequency (MAF) for rs13347 polymorphism varied from 13-29%. Overall, the variant allele and all genotypic models having at least one variant allele of rs13347 polymorphism were found to significantly increase the overall cancer risk compared with the wild allele/genotype. (T vs. C: OR = 1.30, 95% CI = 1.09-1.56, p = <0.004; CT vs. CC: OR = 1.29, 95% CI = 1.05-1.58, p = 0.015; TT vs. CC: OR = 1.77, 95% CI = 1.28-2.44, p = <0.000, CT+TT vs. CC: OR = 1.34, 95% CI = 1.08-1.67, p = <0.009, Table 3, Figure 2. and 3.). For this SNP, we used random effect model as the present meta-analysis revealed significant heterogeneity in all genotypic models. The removal of Lou et al. [39], Jiang et al. [42], Wu et al. [41, 48], and Xiao et al. [40] were found to remove heterogeneity for hetero as well as variant models (CT vs. CC: ph = 0.085, I2 = 46.057; TT vs. CC: ph = 0.288, I2 = 1o.17) while removal of above studies together with Verma et al. [47] was found to remove heterogeneity at allele level and in dominant model (T vs. C: ph = 0.576, I2 = 0.000; CT+TT vs. CC: ph = 0.386, I2 = 4.764) However, it was found to significantly change the pooled results. In our sensitivity analysis, we did not find any obvious change in the corresponding pooled ORs after removing one study each time for a genetic model, thereby confirming reliability of our results.
Table 3: Meta-Analysis Result for CD44 Polymorphism
|
Subgroup |
N |
Case/ Control |
V vs. W allele |
VW vs. WW |
VV vs. WW |
VW+VV vs. WW |
||||||||
OR (95% CI) |
p/pcorr |
ph/I2 |
OR (95% CI) |
p/pcorr |
ph/I2 |
OR (95% CI) |
p/pcorr |
ph/I2 |
OR (95% CI) |
p/pcorr |
ph/I2 |
|||
CD44 rs13347 |
||||||||||||||
Overall |
12 |
6612/7450 |
1.30 (1.09-1.56) |
0.004/ 0.032 |
0.000/ 89.625 |
1.29 (1.05-1.58) |
0.015/ 0.047 |
0.000/ 85.803 |
1.77 (1.28-2.44) |
0.000/ 0.018 |
0.000/ 77.90 |
1.34 (1.08-1.67) |
0.009/ 0.041 |
0.000/ 88.919 |
HB subgroup |
8 |
2486/3065 |
1.09 (0.86-1.38) |
0.483 |
0.000/ 84.365 |
1.05 (0.82-1.34) |
`0.712 |
0.000/ 74.741 |
1.31 (0.80-2.15) |
0.290 |
0.000/ 74.534 |
1.08 (0.82-1.42) |
0.578 |
0.000/ 81.751 |
PB subgroup |
4 |
4126/4385 |
1.76 (1.50-2.07) |
0.000/ 0.029 |
0.002/ 79.844 |
1.80 (1.64-1.97) |
0.000/ 0.024 |
0.115/ 49.370 |
2.58 (1.93-3.45) |
0.000/ 0.015 |
0.040/ 64.015 |
1.94 (1.66-2.27) |
0.000/ 0.005 |
0.031/ 66.263 |
Taqman method |
7 |
2214/2576 |
0.99 (0.85-1.16) |
0.930 |
0.040/ 54.640 |
0.98 (0.86-1.11) |
0.729 |
0.085/ 46.057 |
1.11 (0.86-1.44) |
0.429 |
0.288/ 18.617 |
0.97 (0.81-1.17) |
0.751 |
0.047/ 53.014 |
Other method |
5 |
4398/4874 |
1.81 (1.56-2.09) |
0.000/ 0.026 |
0.001/ 77.259 |
1.81 (1.66-1.98) |
0.000/ 0.021 |
0.175/ 36.989 |
2.79 (2.09-3.74) |
0.000/ 0.012 |
0.017/ 66.908 |
1.99 (1.72-2.30) |
0.000/ 0.003 |
0.034/ 61.608 |
GIC |
3 |
1554/1750 |
1.27 (0.96-1.68) |
0.097 |
0.017/ 75.363 |
1.28 (0.81-2.01) |
0.289 |
0.002/ 84.534 |
1.71 (1.28-2.28) |
0.000/ 0.009 |
0.354/ 3.699 |
1.31 (0.86-2.00) |
0.208 |
0.002/ 84.046 |
HNC |
3 |
1777/1993 |
1.70 (1.14-2.55) |
0.010/ 0.044 |
0.000/ 93.178 |
1.75 (1.18-2.59) |
0.005/ 0.035 |
0.001/ 86.777 |
2.73 (1.20-6.23) |
0.017/ 0.05 |
0.000/ 90.086 |
1.89 (1.19-2.99) |
0.007/ 0.038 |
0.000/ 91.311 |
Other |
6 |
3281/3707 |
1.14 (0.83-1.56) |
0.411 |
0.000/ 91.233 |
1.09 (0.78-1.53) |
0.624 |
0.000/ 87.511 |
1.44 (0.87-2.38) |
0.152 |
0.001/ 76.247 |
1.12 (0.78-1.61) |
0.540 |
0.000/ 90.185 |
CD44 rs11821102 |
||||||||||||||
Overall |
7 |
3733/4454 |
0.87 (0.77-0.99) |
0.027/ 0.04 |
0.891/ 0.000 |
0.85 (0.74-0.97 |
0.017/ 0.01 |
0.880/ 0.000 |
0.98 (0.60-1.61) |
0.95 |
0.817/ 0.000 |
0.86 (0.75-0.98) |
0.020/ 0.02 |
0.895/ 0.000 |
HB subgroup |
4 |
1357/1893 |
0.83 (0.68-1.02) |
0.072 |
0.771/ 0.000 |
0. 84 (0.68-1.04) |
0.106 |
0.636/ 0.000 |
0.73 (0.31-1.71) |
0.463 |
0.971/ 0.000 |
0.83 (0.67-1.02) |
0.082 |
0.692/ 0.000 |
PB subgroup |
3 |
2376/2561 |
0.90 (0.77-1.05) |
0.163 |
0.655/ 0.000 |
0.86 (0.73-1.02) |
0.080 |
0.719/ 0.000 |
1.14 (0.63-2.09) |
0.436 |
0.373/ 0.000 |
0.87 (0.74-1.03) |
0.109 |
0.723/ 0.000 |
Taqman method |
3 |
1077/1397 |
0.83 (0.67-1.03) |
0.097 |
0.572/ 0.000 |
0.83 (0.65-1.05) |
0.126 |
0.433/ 0.000 |
0.75 (0.30-1.90) |
0.548 |
0.906/ 0.000 |
0.82 (0.65-1.04) |
0.105 |
0.488/ 0.000 |
Other method |
4 |
2656/3057 |
0.89 (0.77-1.03) |
0.122 |
0.826/ 0.000 |
0.86 (0.73-1.01) |
0.066 |
0.882/ 0.000 |
1.09 (0.61-1.96) |
0.764 |
0.514/ 0.000 |
0.87 (0.75-1.02) |
0.085 |
0.884/ 0.000 |
HNC |
3 |
1785/2000 |
0.83 (0.69-0.99) |
0.038/ 0.05 |
0.954/ 0.000 |
0.79 (0.65-0.97) |
0.022/ 0.03 |
0.905/ 0.000 |
0.99 (0.49-1.98) |
0.970 |
0.858/ 0.000 |
0.80 (0.66-0.97) |
0.026 |
0.939/ 0.000 |
Other + GIC |
4 |
1948/2454 |
0.91 (0.76-1.07) |
0.270 |
0.671/ 0.000 |
0.90 (0.75-1.08) |
0.257 |
0.735/ .0.000 |
0.98 (0.49-1.97) |
0.955 |
0.453/ 0.000 |
0.90 (0.76-1.08) |
0.255 |
0.723/ 0.000 |
CD44 rs10836347 |
||||||||||||||
Overall |
7 |
4402/5167 |
0.93 (0.82-1.04) |
0.192 |
0.844/ 0.000 |
0.94 (0.83-1.06) |
0.291 |
0.894/ 0.000 |
0.74 (0.42-1.30) |
0.297 |
0.948/ 0.000 |
0.93 (0.82-1.04) |
0.206 |
0.896/ 0.000 |
HB subgroup |
3 |
1080/1617 |
0.93 (0.72-1.21) |
0.606 |
0.662/ 0.000 |
0.93 (0.73-1.20) |
0.581 |
0.899/ 0.000 |
0.82 (0.29-2.29) |
0.705 |
0.532/ 0.000 |
0.92 (0.72-1.17) |
0.492 |
0.890/ 0.000 |
PB subgroup |
4 |
3322/3550 |
0.92 (0.81-1.05) |
0.230 |
0.598/ 0.000 |
0.94 (0.82-1.08) |
0.367 |
0.563/ 0.000 |
0.71 (0.36-1.40) |
0.317 |
0.951/ 0.000 |
0.93 (0.82-1.07) |
0.287 |
0.569/ 0.000 |
Taqman method |
2 |
802/ 1122 |
0.94 (0.68-1.29) |
0.680 |
0.364/ 0.000 |
0.96 (0.72-1.28) |
0.771 |
0.773 /0.000 |
0.62 (0.19-2.05) |
0.430 |
0.494/ 0.000 |
0.93 (0.70-1.23) |
0.599 |
0.641/ 0.000 |
Other method |
5 |
3600/4045 |
0.92 (0.82-1.05) |
0.215 |
0.757/ 0.000 |
0.93 (0.82-1.07) |
0.303 |
0.708/ 0.000 |
0.78 (0.41-1.48) |
0.447 |
0.897/ 0.000 |
0.93 (0.81-1.06) |
0.250 |
0.728/ 0.000 |
GIC |
2 |
481/ 1056 |
0.86 (0.62-1.20) |
0.382 |
0.629/ 0.000 |
0.88 (0.62-1.25) |
0.480 |
0.903/ 0.000 |
0.95 (0.19-4.82) |
0.947 |
0.271/ 0.000 |
0.87 (0.62-1.23) |
0.422 |
0.859/ 0.000 |
HNC |
3 |
1926/1965 |
0.93 (0.77-1.12) |
0.418 |
0.334/ 8.802 |
0.92 (0.76-1.10) |
0.356 |
0.385/ 0.000 |
0.81 (0.34-1.97) |
0.646 |
0.941/ 0.000 |
0.91 (0.76-1.10) |
0.323 |
0.383/ 0.000 |
Other |
2 |
1995/2146 |
0.94 (0.80-1.11) |
0.483 |
0.787/ 0.000 |
0.97 (0.81-1.16) |
0.757 |
0.936/ 0.000 |
0.64 (0.28-1.46) |
0.289 |
0.779/ 0.000 |
0.96 (0.80-1.14) |
0.612 |
0.860/ 0.000 |
CD44 rs713330 |
||||||||||||||
Overall |
6 |
3453/3958 |
0.94 (0.84-1.05) |
0.289 |
0.953/ 0.000 |
0.96 (0.85-1.08) |
0.464 |
0.929/ 0.000 |
0.86 (0.54-1.37) |
0.532 |
0.509/ 0.000 |
0.95 (0.84-1.07) |
0.361 |
0.965/ 0.000 |
HB subgroup |
3 |
1077/1397 |
0.88 (0.72-1.08) |
0.236 |
0.837/ 0.000 |
0.97 (0.76-1.21) |
0.781 |
0.535/ 0.000 |
0.45 (0.18-1.16) |
0.099 |
0.729/ 0.000 |
0.92 (0.74-1.15) |
0.464 |
0.674/ 0.000 |
PB subgroup |
3 |
2376/2561 |
0.97 (0.85-1.10) |
0.620 |
0.892/ 0.000 |
0.95 (0.82-1.10) |
0.488 |
0.958/ 0.000 |
1.06 (0.62-1.81) |
0.832 |
0.526/ 0.000 |
0.96 (0.83-1.10) |
0.539 |
0.953/ 0.000 |
CD44 rs187115 |
||||||||||||||
Overall |
5 |
1716/2065 |
1.56 (1.29-1.90) |
0.000/ 0.05 |
0.035/ 61.402 |
1.59 (1.37-1.84) |
0.000/ 0.038 |
0.102/ 48.313 |
2.34 (1.67-3.27) |
0.000/ 0.025 |
0.165/ 38.482 |
1.63 (1.30-2.03) |
0.000/ 0.013 |
0.048/ 58.222 |
Significant associations are shown in bold, Ph- p value of Q test for heterogeneity, OR- Odds ratio, CI- Confidence interval, W-Wild allele, V- Variant allele, HB- Hospital based, PB-Population based, GIC- Gastrointestinal cancer (including - Gallbladder Cancer/GBC, Hepatocellular Carcinoma/HCC, Colorectal Cancer/CRC), HNC- Head and neck cancers (including Nasopharyngeal Carcinoma/NPC, Oral Cancer/OC)
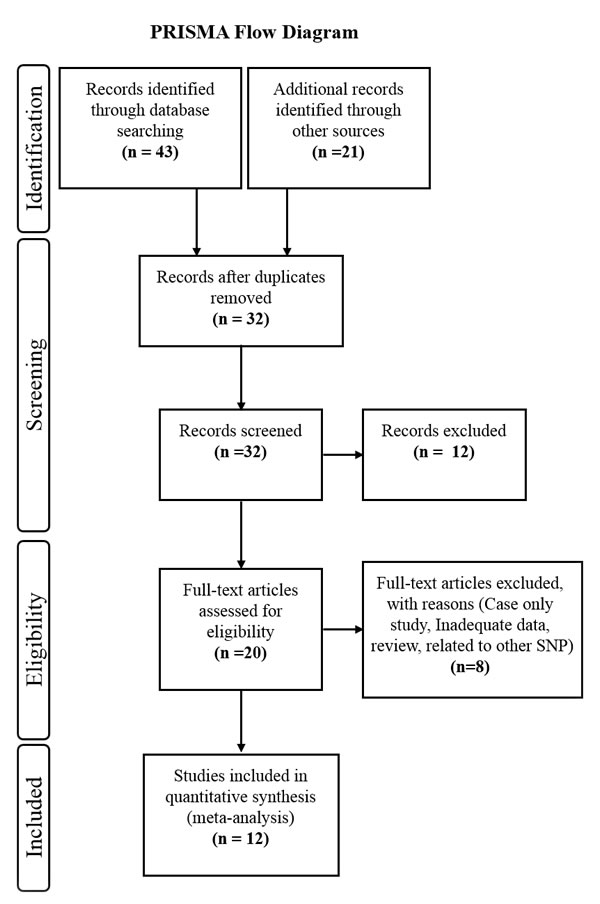
Figure 1: Flow diagram of the study selection process.
In subgroup analysis based on study design and genotyping method (Taqman and/or other), the significant association was limited only to population based studies (T vs. C: OR = 1.76, 95% CI = 1.50-2.07, p = <0.000; CT vs. CC: OR = 1.80, 95% CI = 1.64-1.97, p = 0.000; TT vs. CC: OR = 2.58, 95% CI = 1.93-3.45, p = <0.000, CT+TT vs. CC: OR = 1.94, 95% CI = 1.66-2.27, p = <0.000, Figure 2. and 3.) as well as for other genotypic (non-Taqman) methods (T vs. C: OR = 1.81, 95% CI = 1.56-2.09, p = <0.000; CT vs. CC: OR = 1.81, 95% CI = 1.66-1.98, p = 0.000; TT vs. CC: OR = 2.79, 95% CI = 2.09-3.74, p = <0.000, CT+TT vs. CC: OR = 1.99, 95% CI = 1.72-2.30, p = <0.000, Figure 2. and 3.). Further, we also performed subgroup analysis on the basis of cancer types and the association was limited to HNCs (T vs. C: OR = 1.70, 95% CI = 1.14-2.55, p = <0.010; CT vs. CC: OR = 1.75, 95% CI = 1.18-2.59, p = 0.005; TT vs. CC: OR = 2.73, 95% CI = 1.20-6.23, p = <0.017, CT+TT vs. CC: OR = 1.89, 95% CI = 1.19-2.99, p = <0.007, Table 3).
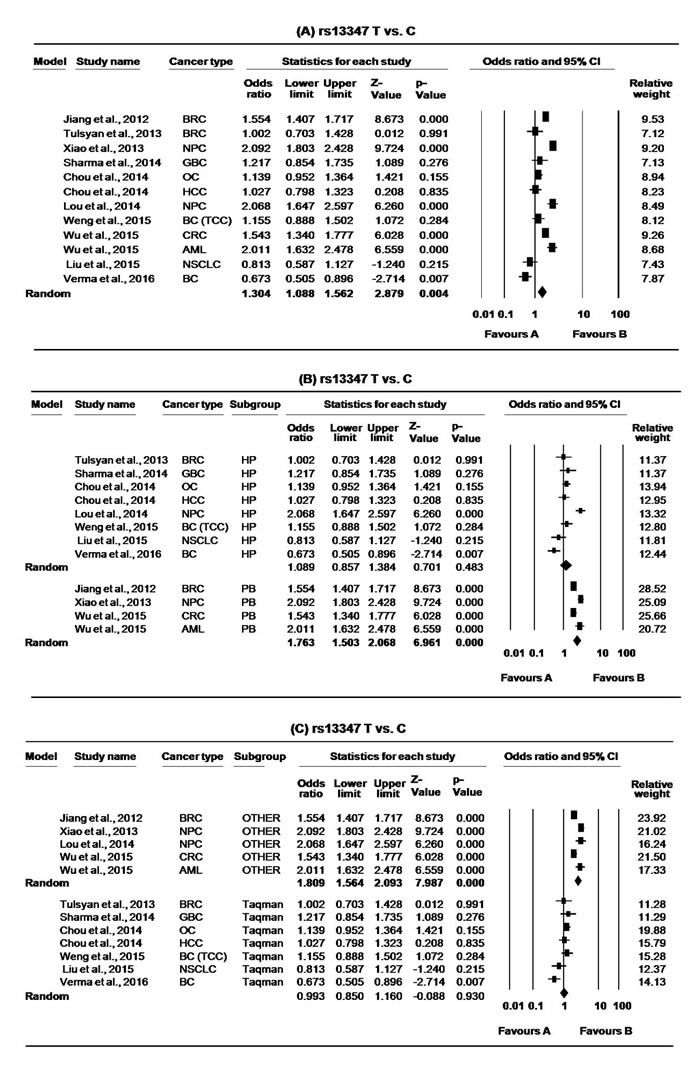
Figure 2: Forest plots for meta-analysis of CD44 rs13347 polymorphism. T vs. C A. Overall, B. stratification on the basis of study design and C. stratification on the basis of genotyping method. For each study, the estimates of OR and 95% CI were plotted with squares and horizontal lines. The size of the square points is the relative weight of the respective study. Diamonds indicate the pooled OR and its 95% CI.
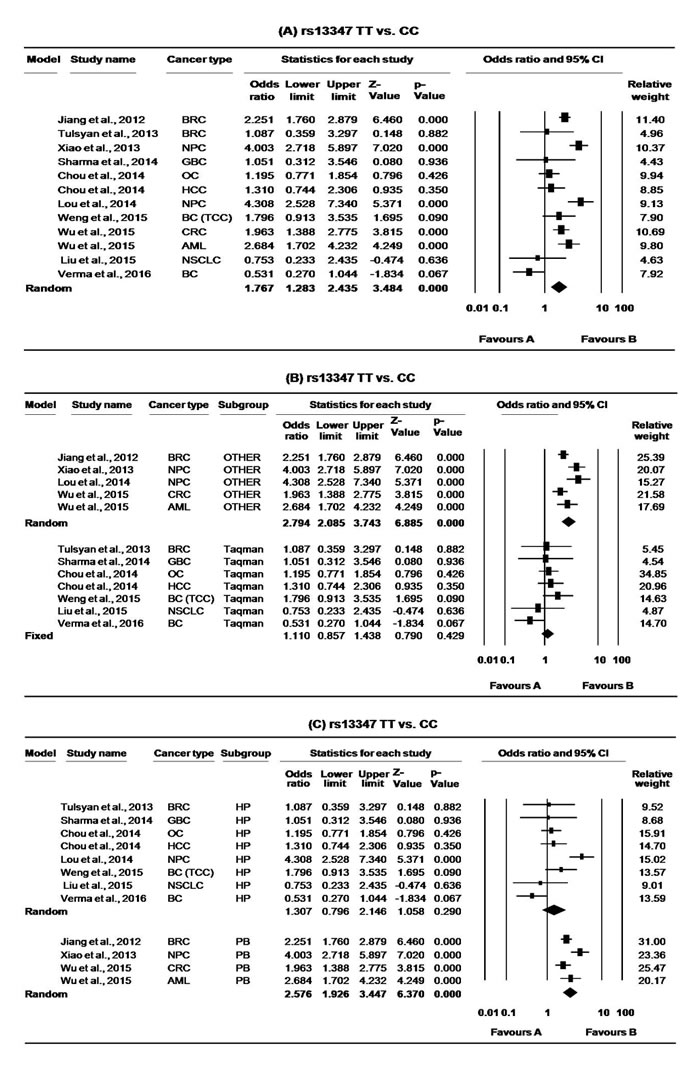
Figure 3: Forest plots for meta-analysis of CD44 rs13347 polymorphism. TT vs. CC A. Overall, B. stratification on the basis of genotyping method and C. stratification on the basis of study design. For each study, the estimates of OR and 95% CI were plotted with squares and horizontal lines. The size of the square points is the relative weight of the respective study. Diamonds indicate the pooled OR and its 95% CI.
CD44 rs11821102
Among 11, only eight studies [36, 39-42, 45, 46, 48] investigated the association of rs11821102 polymorphism and cancer risk, however the study of Wu et al. [48] on CRC failed to follow the HWE in controls and was hence excluded. Thus, seven studies with 3733 multiple cancer cases and 4454 healthy controls were included for rs11821102 meta-analysis. The minor allele frequency (MAF) for rs11821102 SNP varied from 6-10% and overall it was found to reduce the risk of cancer in most of the genotypic models (A vs. G: OR = 0.87, 95% CI = 0.77-0.99, p = <0.027; AG vs. GG: OR = 0.85, 95% CI = 0.74-0.97, p = <0.017; AG+AA vs. GG: OR = 0.86, 95% CI = 0.75-0.98, p = <0.020, Table 3., Figure 4.) except for the variant genotype model (AA vs. GG: OR = 0.98, 95% CI = 0.60-1.61, p = 0.95, Table 3.). We did not encounter any significant heterogeneity in the selected studies. In sensitivity analysis, removal of two studies by Chou et al. [45] or Xiao et al. [40] was found to alter the corresponding statistical p value of association in hetero and dominant models while the removal of Weng et al. [36], Chou et al. [45] and Xiao et al. [40] was found to alter the pooled OR at allele level.
Further, in stratified analysis this association was lost in each subgroup except for HNC at allele level as well as at hetero genotype model (A vs. G: OR = 0.83, 95% CI = 0.69-0.99, p = <0.038; AG vs. GG: OR = 0.79, 95% CI = 0.65-0.97, p = <0.022; ). This may be because the small sample size of the subgroup did not possess sufficient statistical power to detect a weak effect.
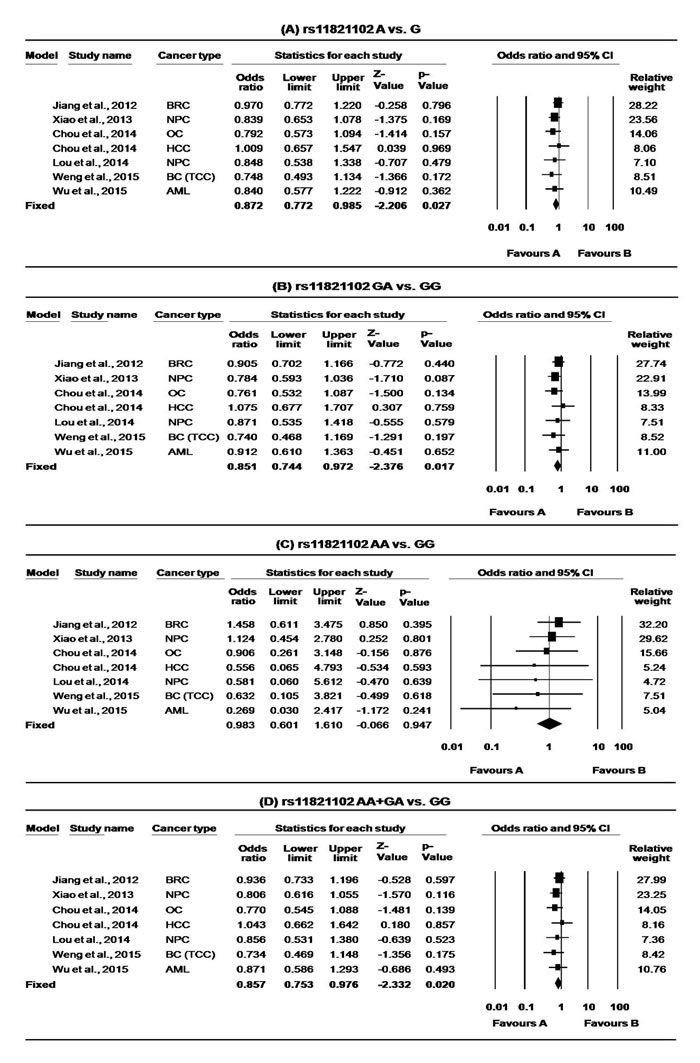
Figure 4: Forest plots for meta-analysis of CD44 rs11821102 polymorphism. A. A vs. G, B. GA vs. GG, C. AA vs. GG and D. AA+AG vs. GG and overall cancer risk. For each study, the estimates of OR and 95% CI were plotted with square and horizontal lines. The size of the square points is the relative weight of the respective study. Diamonds indicate the pooled OR and its 95% CI.
CD44 rs10836347
Among 11 studies, only seven (with a total of 4402 multiple cancer cases and 5167 controls) investigated the association of rs10836347 polymorphism in various cancers [39-42, 45, 46, 48]. The MAF for rs10836347 SNP varies from 6-8%. However, none of the genotypic combinations were found to affect the risk of overall cancer compared with the wild genotype (Table 3.). Our meta-analysis result was without any significant heterogeneity. The sensitivity analysis also confirmed the reliability of our result. Stratified analysis based on study design, cancer types and genotyping method did not modify the pooled result ( Table 3.).).
CD44 rs713330
For rs713330, we found a total of six eligible studies with 3453 cancer cases and 3958 controls [36, 41, 42, 45, 46, 48]. The MAF for rs713330 polymorphism varies as 9-11% in controls. Overall, none of the genotypic combinations were found to affect the risk of overall cancer compared with the wild genotype (Table 3.). Our meta-analysis result was without any significant heterogeneity. The reliability of these results was further confirmed by sensitivity analysis demonstrating no significant change in the pooled ORs. Stratified analysis based on genotyping method did not modify the pooled result (Table 3.).
CD44 rs187115
For rs187115, only six studies investigated the cancer risk, however the study of Verma et al. [47] deviated from HWE and hence was excluded. Thus, we included only five studies with 1716 cancer cases and 2065 controls for rs187115 meta-analysis [36, 38, 44-46]. The MAF for rs187115 ranged from 13 to 22%. Overall, individuals carrying the GG or AG genotype were at an increased risk of cancer compared with the AA genotype (GG vs. AA: OR = 2.34, 95% CI = 1.67-3.27, p = <0.000 and AG vs. AA: OR = 1.59, 95% CI = 1.37-1.84, p = <0.000, Table 3.). Moreover, significant associations were also found in G vs. A allele (OR = 1.56, 95% CI = 1.29-1.90, p = 0.000), as well as in dominant models (AG+GG vs. AA: OR = 1.63, 95% CI = 1.30-2.03, p = <0.000, Table 3., Figure 5.). The present meta-analysis revealed significant heterogeneity at the allele level (G vs. A: ph = 0.035, I2 = 61.402) and dominant model (AG+GG vs. AA: ph = 0.048, I2 = 58.222). Removal of study by Sharma et al. [44] was found to remove heterogeneity without affecting the overall result (G vs. A: ph = 0.837, I2 = 0.000; AG+GG vs. AA: ph = 0.656, I2 = 0.000. Due to limited number of studies, we could not perform stratified analysis for this SNP. Further, our sensitivity analysis confirmed the robustness of our findings.
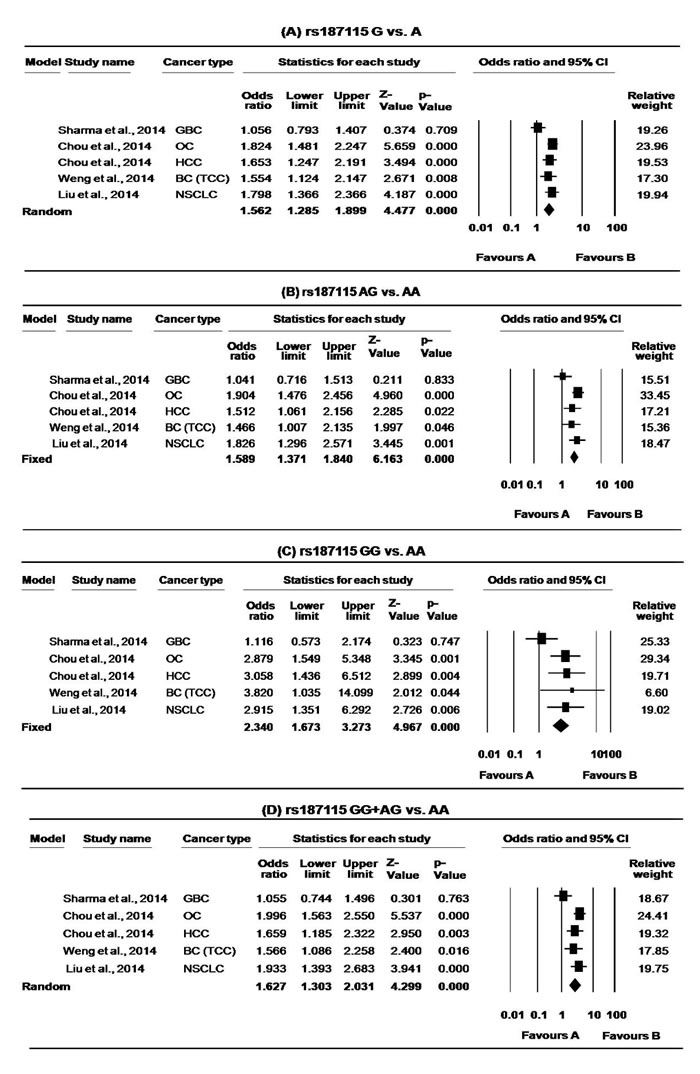
Figure 5: Forest plots for meta-analysis of CD44 rs187115 polymorphism. A. G vs. A B. AG VS. AA, C. GG VS. AA, D. GG + AG VS. AA and overall cancer risk. For each study, the estimates of OR and 95% CI were plotted with square and horizontal lines. The size of the square points is the relative weight of the respective study. Diamonds indicate the pooled OR and its 95% CI.
Publication bias
For rs13347, the review of funnel plot showed slight apparent asymmetry. Further, Egger’s test as well as Begg and Mazumdar rank correlation tests did not demonstrate significant asymmetry except in the heterogenotype as well as dominant models (Table 4). However, stratified analysis based on study design and genotyping method did not revealed any significant biasness suggesting them as the main source of biasness in our meta-analysis (Figure 6). For other SNPs also, although funnel plot showed little asymmetry. Egger’s as well as Begg and Mazumdar rank correlation tests demonstrated no apparent asymmetry except for rs11821102 in the variant genotype model (Table 4.). This may be because the number of studies is very low (5-7) to draw a more conclusive funnel plot
Table 4: Publication Bias for CD44 Polymorphism
No. of studies |
Case/ Control |
V vs. W allele |
VW vs. WW |
VV vs. WW |
VW+VV vs. WW |
|||||||||
Egger’s test |
Begg’s p2tailed |
Egger’s test |
Begg’s p2tailed |
Egger’s test |
Begg’s p2tailed |
Egger’s test |
Begg’s p2tailed |
|||||||
T |
P |
T |
p |
T |
p |
t |
p |
|||||||
CD44 rs13347 |
||||||||||||||
12 |
6612/7450 |
2.0295 |
0.0699 |
0.1148 |
2.7706 |
0.0198 |
0.0467 |
1.5961 |
0.1416 |
0.1926 |
2.5345 |
0.0296 |
0.0865 |
|
CD44 rs11821102 |
||||||||||||||
7 |
3733/4454 |
0.8158 |
0.4517 |
1.0000 |
0.2789 |
0.7915 |
0.7639 |
5.2630 |
0.003 |
0.0355 |
0.2407 |
0.8194 |
1.0000 |
|
CD44 rs10836347 |
||||||||||||||
7 |
4402/5167 |
0.5108 |
0.6313 |
0.7639 |
0.2645 |
0.8020 |
1.000 |
0.2551 |
0.8088 |
0.2296 |
0.2298 |
0.8274 |
0.7639 |
|
CD44 rs713330 |
||||||||||||||
6 |
3453/3958 |
0.7957 |
0.4708 |
0.4524 |
0.0939 |
0.9297 |
0.7071 |
0.9319 |
0.4042 |
0.2597 |
0.3235 |
0.7626 |
0.7071 |
|
CD44 rs187115 |
||||||||||||||
5 |
1716/2065 |
0.9790 |
0.3998 |
0.0864 |
1.8843 |
0.1560 |
0.0864 |
0.6987 |
0.5350 |
0.8065 |
1.4562 |
0.2414 |
0.0864 |
|
Significant associations are shown in bold. W- Wild allele, V- Variant allele
Credibility of meta-analysis results
According to Venice guidelines, credibility of the cumulative association of CD44 variants with cancer risk are shown in Table 5. Our results demonstrated moderate evidence of association for CD44 rs13347 and rs187115 variants while weak evidence for rs11821102, rs10836347 and rs713330. This may be due to fewer number of studies as well as small sample sizes. Additionally, different genotyping methods and study designs contributing to likely biasness are the potential reasons for moderate or weak evidence of association.
Table 5: Credibility of the Association for CD44 Variants and Cancer Risk
Genetic variant |
*Overall scheme |
Cumulative evidence |
CD44 rs13347 |
ABB |
Moderate |
CD44 rs11821102 |
CCA |
Weak |
CD44 rs10836347 |
CCA |
Weak |
CD44 rs713330 |
CCA |
Weak |
CD44 rs187115 |
BBB |
Moderate |
*First letter refers to the Amount of evidence that was assessed by counting the number of minor alleles. Grade A, B and C correspond if nminor = >1,000, 100-1000 and <100, respectively where nminor is the total number of cases and controls with the least frequent genotype. Second letter refers replication assessment and the third letter demonstrated protection from bias [50].
Table 6: Bio-informatics Analysis: Result of F-SNP
SNP |
location |
FS score |
Functional category |
Prediction tool |
Prediction result |
rs13347 |
3’UTR |
0.176 |
Transcriptional regulation |
TF search Golden Path |
Changed Not exist |
rs1182102 |
3’UTR |
0.050 |
Transcriptional regulation |
TF search Golden Path Consite |
Not changed Not exist Changed |
rs10836347 |
3’UTR |
0.176 |
Transcriptional regulation |
TF search Golden Path |
Changed Not exist |
rs713330 |
Intron |
0.208 |
Transcriptional regulation |
TF search Golden Path Consite |
Changed Not exist Changed |
rs187115 |
Intron |
0.176 |
Transcriptional regulation |
TF search Golden Path |
Changed Not exist |
Discussion
Single nucleotide polymorphism is the most common form of genetic variation, altering the expression level and/or function of any gene, thereby affecting an individuals’ risk of cancer. In the present meta-analysis, we found that CD44 SNPs significantly modulate the risk of cancer in Asians. Specifically, rs13347 and rs187115 were found to significantly increase the cancer risk while rs11821102 was associated with cancer protection. On the other hand, rs713330, rs10836347 did not affect an individual’s susceptibility for cancer.
The rs13347C/T located in the 3’-untranslated region (UTR) of CD44 is highly conserved and it is the main target region for microRNAs. The C to T base change of this SNP was found to disrupt the hsa-mir-509-3p binding site, thereby modifying the CD44 mRNA stability and its expression. Further, functional studies established the association of T allele with enhanced transcriptional activity as compared with C allele [39, 48] and individuals carrying the T allele were shown to have higher expression of CD44 [42, 48]. In addition, it was reported to affect the hematopoietic stem cell mobilization in patients with hematologic malignancies.[51]. The rs13347C/T was significantly associated with an increased risk of CRC [48], NPC [39, 40], AML [41] and breast cancer [42], and this risk was found to increase as the number of variant alleles (T) increased. The rs13347T variant was also shown to be associated with tumor stage and lower five year survival rate in cancer patients [42, 48]. Although, some studies failed to find the association of rs13347 with various cancers [38, 43-46], our meta-analysis established that CD44 rs13347 polymorphism is significantly associated with an overall increased risk of cancer. These findings suggest that this SNP may be used as potential biomarker for genetic susceptibility to various cancers in Asians.
The rs187115 SNP is located in the first intron of CD44. Intronic SNPs have been shown to play an important role in gene function by regulating its transcription and splicing [52]. Previously, this SNP was shown to be associated with cellular responses to a large panel of cytotoxic chemotherapeutic agents in a p53-dependent manner. In addition, the variant allele of this SNP was found to confer decreased drug sensitivity, poor overall survival and an earlier age of diagnosis in soft tissue sarcoma patients [35]. Further, several studies reported significant association of this SNP with increased susceptibility, development, invasion, advanced stage and poor prognosis of various cancers [38, 45, 46, 53]. Liu et al. (2014) reported that individuals having at least one copy of CD44 rs187115 variant allele were associated with increased bone metastasis and tumor stage, as well as with decreased survival rate in NSCLC patients. Thus, this variant was suggested as a potential predictive marker of survival in NSCLC patients [38].
Though none of the studies demonstrated significant association of rs1182102 with cancer susceptibility, our result demonstrated a significant role of this SNP in cancer protection. The exact mechanism by which this SNP modulates cancer risk has not yet been elucidated; however, its location in the 3’UTR suggests that it alters the binding of miRNA contributing CD44 deregulation. Further, our in-silico analysis also revealed the role of CD44 rs1182102 in transcriptional regulation (Table 6.).
To the best of our knowledge, we are the first to perform such a comprehensive meta-analysis of common functional polymorphisms of the CD44 gene comprising all the published and well defined case-control studies. We followed a strict inclusion/exclusion criteria to avoid likely biases and NOS system was used to evaluate the quality of each studies demonstrating that all the included studies were of good (moderate to high) methodologic quality. In addition, our study has improved the statistical power of the analysis since we pooled large number of cases and controls from various studies. We also performed sensitivity analysis and multiple corrections to remove any false result, though the result remained unaffected, thereby adding weight to our findings. Since cancer is a highly fatal disease, our results investigating the association of functional SNP in CD44 gene may have clinical significance in that they can help to identify interindividual differences in tumor susceptibility, recurrence capacity and chemoresistance among patients. However, care should be taken to interpret these results with caution as overall our study indicate moderate or weak evidence for association mainly due to limited number of studies.
Study limitation
Though, we have collected all published articles till date, we could not perform a comprehensive subgroup analysis as the number of available studies were limited to Asian population and also for limited cancer types. In addition, there was significant heterogeneity for rs13347 meta-analysis, although in subgroup analysis it was removed or decreased Further, our results are based on unadjusted or crude estimates and the roles of haplotypes, gene-gene, and gene-environment interactions, as well as linkage disequilibriums were not considered. Last but not the least, we could not exclude the possibility of selection bias as study selection was limited to published results, articles in English language only and methodologies using different genotyping methods and study designs.
Conclusions
We demonstrated a significant association of CD44 SNPs in modulation of cancer risk. Specifically, rs13347 and rs187115 may be used as potential biomarkers for cancers in Asian populations. However, further analysis considering the aforementioned limitations and prognostic significance of CD44 are required to better understand the role of these CD44 SNPs in cancer risk.
Materials and methods
Literature search and study selection criteria
Following the PRISMA statement [54], we performed a systematic and comprehensive literature search on “Pubmed”, “Medline”, “Google Scholar”, “EMBASE”, and “Scopus” databases by using the following MeSH index keywords: “CD44 gene”, “Cluster of differentiation”, in combination with “single nucleotide polymorphism (SNP) /variation/genotype”, and “cancer/carcinoma” or “tumor”. All published case-control studies investigating the association of CD44 gene polymorphisms with human cancer susceptibility in English language were searched until May2016. All relevant studies were collected after thorough investigation of the abstracts of potential articles. Further, the reference lists of the selected articles and related reviews on the topic were manually examined to collect additional relevant studies.
The selection criteria of the studies were; original case-control study examining the association of CD44 polymorphism with cancer risk having sufficient information to calculate the relative risk and 95% confidence intervals (CI), histo-pathologically confirmed cancer cases and healthy controls (free from any malignancy or other related pre-malignant condition such as benign and hyperplasia). On the other hand, studies unrelated to cancer research or lacking control population or sufficient data, and those not in accordance with Hardy-Weinberg equilibrium (HWE) in control groups were excluded from the meta-analysis. Duplicate or ecological studies, case reports, reviews, abstracts, comments and editorials were also excluded from the present meta-analysis.
Data extraction
Two independent investigators separately weighed the eligibility of each study according to the inclusion and exclusion criteria listed above and any disagreements were further resolved by discussions and agreements. Data such as first author name, publication year, country of origin, ethnicity, genotyping methods, cancer types, frequency of cases and controls, genotype frequencies, minor allele frequencies, etc., were cautiously extracted from all eligible studies.
Quality score assessment
The quality of each studies included in this meta-analysis (Ref) was rigorously evaluated independently by two authors (Rai Rajani and Gupta Usha), by using the Newcastle-Ottawa quality assessment scale (NOS) [55, 56] and all disagreements were resolved by discussion. The NOS is a star rating system in which each study was judged on standard criteria and subsequently categorized based on three fact: selection, comparability and exposure assessment with scores ranging from zero to nine stars. A study with NOS score of 7 to 9, 4 to 6 and 1 to 3 stars are usually considered to be a high, intermediate and low-methodological quality respectively.
Statistical analysis
All statistical analyses were conducted using the Comprehensive Meta-analysis software (Version 2.0, BIOSTAT, Englewood, NJ). The pooled ORs were estimated for allele contrast, log-additive and dominant models. Odd’s ratio greater than 1 is considered significant. Heterogeneity was measured using the I2 value and Chi-square-based Q statistics (significant at p < 0.05). I2 = 0%, 25%, 50% and 75% were considered as no, low, moderate, and high observed heterogeneity, respectively [57]. In the case of significant heterogeneity, the random-effect model was used to calculate the pooled ORs [58, 59]. Funnel plot and Egger tests were performed to examine the publication bias [60]. Moreover, sensitivity analysis was performed to check if alteration of the inclusion criteria affects the results of the meta-analysis. To adjust the p values for multiple comparisons in subgroup analyses, we applied the Benjamini-Hochberg (BH) step-up correction method, which control the false discovery rate (FDR) yielding pcorr. A pcorr value less than 0.05 was considered as significant [61]. Hardy-Weinberg equilibrium (HWE) test of SNP was performed using Michael H. Court’s (2005-2008) online calculator (http://www.tufts.edu/~mcourt01/Documents /Court%20lab%20-%20HW%20calculator.xls). Further, in-silico study was performed by using online Web servers- FastsnP (http://fastsnp.ibms.sinica.edu.tw) and F-SNP (http://compbio.cs.queensu.ca/F-snP/) to predict the functional effect of each SNPs.
Credibility of meta-analysis results
The credibility of the cumulative association of CD44 polymorphisms and the cancer risk was scrutinized by using Venice interim criteria [50] including a set of three scores (the amount of evidence, replication of results, and protection from bias) which are used to grade the evidence produced by the study. Each of these three scores can attain a maximum of ‘A’ grade, followed by ‘B’, and ‘C’. Finally, the grades may be scored as follows- strong evidence (AAA) , moderate evidence (AAB, ABA, ABB, BAA, BBA, BBB, BAB) and weak evidence (rest all scores).
Acknowledgments
This work was supported by a 2014 Yeungnam University Research Grant, and ICMR (India) Emeritus scientist award to BM.
Conflicts of interest
The authors declare no conflicts of interest.
References
1. Bandhavkar S. Cancer stem cells: a metastasizing menace. Cancer Med. 2016; 5:649-55..
2. Bao B, Ahmad A, Azmi AS, Ali S and Sarkar FH. Overview of cancer stem cells (CSCs) and mechanisms of their regulation: implications for cancer therapy. Current protocols in pharmacology / editorial board, SJ Enna. 2013; Chapter 14:Unit 14 25.
3. Tirino V, Desiderio V, Paino F, De Rosa A, Papaccio F, La Noce M, Laino L, De Francesco F and Papaccio G. Cancer stem cells in solid tumors: an overview and new approaches for their isolation and characterization. FASEB journal. 2013; 27:13-24.
4. Alisi A, Cho WC, Locatelli F and Fruci D. Multidrug resistance and cancer stem cells in neuroblastoma and hepatoblastoma. International journal of molecular sciences. 2013; 14:24706-24725.
5. Vinogradov S and Wei X. Cancer stem cells and drug resistance: the potential of nanomedicine. Nanomedicine. 2012; 7:597-615.
6. Di C and Zhao Y. Multiple drug resistance due to resistance to stem cells and stem cell treatment progress in cancer (Review). Experimental and therapeutic medicine. 2015; 9:289-293.
7. Hu Y and Fu L. Targeting cancer stem cells: a new therapy to cure cancer patients. American journal of cancer research. 2012; 2:340-356.
8. Yan Y, Zuo X and Wei D. Concise Review: Emerging Role of CD44 in Cancer Stem Cells: A Promising Biomarker and Therapeutic Target. Stem cells translational medicine. 2015; 4:1033-1043.
9. Marhaba R, Klingbeil P, Nuebel T, Nazarenko I, Buechler MW and Zoeller M. CD44 and EpCAM: cancer-initiating cell markers. Current molecular medicine. 2008; 8:784-804.
10. Xu H, Tian Y, Yuan X, Wu H, Liu Q, Pestell RG and Wu K. The role of CD44 in epithelial-mesenchymal transition and cancer development. OncoTargets and therapy. 2015; 8:3783-3792.
11. Sherman L, Sleeman J, Herrlich P and Ponta H. Hyaluronate receptors: key players in growth, differentiation, migration and tumor progression. Current opinion in cell biology. 1994; 6:726-733.
12. Gao AC, Lou W, Dong JT and Isaacs JT. CD44 is a metastasis suppressor gene for prostatic cancer located on human chromosome 11p13. Cancer research. 1997; 57:846-849.
13. Zhou J, Nagarkatti PS, Zhong Y, Zhang J and Nagarkatti M. Implications of single nucleotide polymorphisms in CD44 exon 2 for risk of breast cancer. European journal of cancer prevention. 2011; 20:396-402.
14. Misra S, Hascall VC, Markwald RR and Ghatak S. Interactions between Hyaluronan and Its Receptors (CD44, RHAMM) Regulate the Activities of Inflammation and Cancer. Frontiers in immunology. 2015; 6:201.
15. Peng ST, Su CH, Kuo CC, Shaw CF and Wang HS. CD44 crosslinking-mediated matrix metalloproteinase-9 relocation in breast tumor cells leads to enhanced metastasis. International journal of oncology. 2007; 31:1119-1126.
16. Mochimaru H, Takahashi E, Tsukamoto N, Miyazaki J, Yaguchi T, Koto T, Kurihara T, Noda K, Ozawa Y, Ishimoto T, Kawakami Y, Tanihara H, Saya H, Ishida S and Tsubota K. Involvement of hyaluronan and its receptor CD44 with choroidal neovascularization. Investigative ophthalmology & visual science. 2009; 50:4410-4415.
17. Bendall LJ, James A, Zannettino A, Simmons PJ, Gottlieb DJ and Bradstock KF. A novel CD44 antibody identifies an epitope that is aberrantly expressed on acute lymphoblastic leukaemia cells. Immunology and cell biology. 2003; 81:311-319.
18. Naor D, Nedvetzki S, Golan I, Melnik L and Faitelson Y. CD44 in cancer. Critical reviews in clinical laboratory sciences. 2002; 39:527-579.
19. Jordan AR, Racine RR, Hennig MJ and Lokeshwar VB. The Role of CD44 in Disease Pathophysiology and Targeted Treatment. Frontiers in immunology. 2015; 6:182.
20. Fang XJ, Jiang H, Zhao XP and Jiang WM. The role of a new CD44st in increasing the invasion capability of the human breast cancer cell line MCF-7. BMC cancer. 2011; 11:290.
21. Ouhtit A, Abd Elmageed ZY, Abdraboh ME, Lioe TF and Raj MH. In vivo evidence for the role of CD44s in promoting breast cancer metastasis to the liver. The American journal of pathology. 2007; 171:2033-2039.
22. Sacks JD and Barbolina MV. Expression and Function of CD44 in Epithelial Ovarian Carcinoma. Biomolecules. 2015; 5:3051-3066.
23. Orian-Rousseau V. CD44 Acts as a Signaling Platform Controlling Tumor Progression and Metastasis. Frontiers in immunology. 2015; 6:154.
24. Cho SH, Park YS, Kim HJ, Kim CH, Lim SW, Huh JW, Lee JH and Kim HR. CD44 enhances the epithelial-mesenchymal transition in association with colon cancer invasion. International journal of oncology. 2012; 41:211-218.
25. Gao Y, Ruan B, Liu W, Wang J, Yang X, Zhang Z, Li X, Duan J, Zhang F, Ding R, Tao K and Dou K. Knockdown of CD44 inhibits the invasion and metastasis of hepatocellular carcinoma both in vitro and in vivo by reversing epithelial-mesenchymal transition. Oncotarget. 2015; 6:7828-7837. doi: 10.18632/oncotarget.3488.
26. Park YS, Huh JW, Lee JH and Kim HR. shRNA against CD44 inhibits cell proliferation, invasion and migration, and promotes apoptosis of colon carcinoma cells. Oncology reports. 2012; 27:339-346.
27. Herrlich P, Morrison H, Sleeman J, Orian-Rousseau V, Konig H, Weg-Remers S and Ponta H. CD44 acts both as a growth- and invasiveness-promoting molecule and as a tumor-suppressing cofactor. Annals of the New York Academy of Sciences. 2000; 910:106-118; discussion 118-120.
28. Naor D, Sionov RV and Ish-Shalom D. CD44: structure, function, and association with the malignant process. Advances in cancer research. 1997; 71:241-319.
29. Bendardaf R, Algars A, Elzagheid A, Korkeila E, Ristamaki R, Lamlum H, Collan Y, Syrjanen K and Pyrhonen S. Comparison of CD44 expression in primary tumours and metastases of colorectal cancer. Oncology reports. 2006; 16:741-746.
30. Elbasateeny SS, Salem AA, Abdelsalam WA and Salem RA. Immunohistochemical expression of cancer stem cell related markers CD44 and CD133 in endometrial cancer. Pathology, research and practice. 2016; 212:10-16.
31. Yanagisawa N, Mikami T, Mitomi H, Saegusa M, Koike M and Okayasu I. CD44 variant overexpression in gallbladder carcinoma associated with tumor dedifferentiation. Cancer. 2001; 91:408-416.
32. Du L, Wang H, He L, Zhang J, Ni B, Wang X, Jin H, Cahuzac N, Mehrpour M, Lu Y and Chen Q. CD44 is of functional importance for colorectal cancer stem cells. Clinical cancer research. 2008; 14:6751-6760.
33. Jaggupilli A and Elkord E. Significance of CD44 and CD24 as cancer stem cell markers: an enduring ambiguity. Clinical & developmental immunology. 2012; 2012:708036.
34. Keysar SB and Jimeno A. More than markers: biological significance of cancer stem cell-defining molecules. Molecular cancer therapeutics. 2010; 9:2450-2457.
35. Vazquez A, Grochola LF, Bond EE, Levine AJ, Taubert H, Muller TH, Wurl P and Bond GL. Chemosensitivity profiles identify polymorphisms in the p53 network genes 14-3-3tau and CD44 that affect sarcoma incidence and survival. Cancer research. 2010; 70:172-180.
36. Weng WC, Huang YH, Yang SF, Wang SS, Kuo WH, Hsueh CW, Huang CH and Chou YE. Effect of CD44 gene polymorphisms on risk of transitional cell carcinoma of the urinary bladder in Taiwan. Tumour Biol. 2016; 37:6971-7.
37. Suenaga M, Yamada S, Fuchs BC, Fujii T, Kanda M, Tanaka C, Kobayashi D, Fujiwara M, Tanabe KK and Kodera Y. CD44 single nucleotide polymorphism and isoform switching may predict gastric cancer recurrence. Journal of surgical oncology. 2015; 112:622-628.
38. Liu Y, Qing H, Su X, Wang C, Li Z and Liu S. Association of CD44 Gene Polymorphism with Survival of NSCLC and Risk of Bone Metastasis. Medical science monitor. 2015; 21:2694-2700.
39. Lou F, Ma HN, Xu L, Chen M and Zhu YB. Two polymorphisms of CD44 3’UTR weaken the binding of miRNAs and associate with naso-pharyngeal carcinoma in a Chinese population. European review for medical and pharmacological sciences. 2014; 18:2444-2452.
40. Xiao M, Hu S, Zhang L, Huang J, Jiang H and Cai X. Polymorphisms of CD44 gene and nasopharyngeal carcinoma susceptibility in a Chinese population. Mutagenesis. 2013; 28:577-582.
41. Wu H, Deng J, Zheng J, You Y, Li N, Li W, Wu D and Zhou Y. Functional polymorphisms in the CD44 gene and acute myeloid leukemia cancer risk in a Chinese population. Molecular carcinogenesis. 2015; 54:102-110.
42. Jiang L, Deng J, Zhu X, Zheng J, You Y, Li N, Wu H, Lu J and Zhou Y. CD44 rs13347 C>T polymorphism predicts breast cancer risk and prognosis in Chinese populations. Breast cancer research. 2012; 14:R105.
43. Tulsyan S, Agarwal G, Lal P, Agrawal S, Mittal RD and Mittal B. CD44 gene polymorphisms in breast cancer risk and prognosis: a study in North Indian population. PloS one. 2013; 8:e71073.
44. Sharma KL, Yadav A, Gupta A, Tulsayan S, Kumar V, Misra S, Kumar A and Mittal B. Association of genetic variants of cancer stem cell gene CD44 haplotypes with gallbladder cancer susceptibility in North Indian population. Tumour biology. 2014; 35:2583-2589.
45. Chou YE, Hsieh MJ, Hsin CH, Chiang WL, Lai YC, Lee YH, Huang SC, Yang SF and Lin CW. CD44 gene polymorphisms and environmental factors on oral cancer susceptibility in Taiwan. PloS one. 2014; 9:e93692.
46. Chou YE, Hsieh MJ, Chiou HL, Lee HL, Yang SF and Chen TY. CD44 gene polymorphisms on hepatocellular carcinoma susceptibility and clinicopathologic features. BioMed research international. 2014; 2014:231474.
47. Verma A KR, Mittal RD Cluster of Differentiation 44 (CD44) Gene Variants: A Putative Cancer Stem Cell Marker in Risk Prediction of Bladder Cancer in North Indian Population. Ind J Clin Biochem. 2016.
48. Wu XM, Yang HG, Zheng BA, Cao HF, Hu ZM and Wu WD. Functional Genetic Variations at the microRNA Binding-Site in the CD44 Gene Are Associated with Risk of Colorectal Cancer in Chinese Populations. PloS one. 2015; 10:e0127557.
49. Qiu Y, Hu Y, Zhang ZY, Ye L, Xu FH, Schneider ME, Ma XL, Du YX, Zuo XB, Zhou FS, Chen G, Xie XS, Zhang Y, Xia HZ, Wu JF and Du WD. Genetic association of osteopontin (OPN) and its receptor CD44 genes with susceptibility to Chinese gastric cancer patients. Journal of cancer research and clinical oncology. 2014; 140:2143-2156.
50. Ioannidis JP, Boffetta P, Little J, O’Brien TR, Uitterlinden AG, Vineis P, Balding DJ, Chokkalingam A, Dolan SM, Flanders WD, Higgins JP, McCarthy MI, McDermott DH, Page GP, Rebbeck TR, Seminara D, et al. Assessment of cumulative evidence on genetic associations: interim guidelines. International journal of epidemiology. 2008; 37:120-132.
51. Szmigielska-Kaplon A, Szemraj J, Hamara K, Robak M, Wolska A, Pluta A, Czemerska M, Krawczynska A, Jamroziak K, Szmigielska K, Robak T and Wierzbowska A. Polymorphism of CD44 influences the efficacy of CD34(+) cells mobilization in patients with hematological malignancies. Biology of blood and marrow transplantation. 2014; 20:986-991.
52. Chorev M and Carmel L. The function of introns. Frontiers in genetics. 2012; 3:55.
53. Smith TW and Zurawski RM. Assessment of irrational beliefs: the question of discriminant validity. Journal of clinical psychology. 1983; 39:976-979.
54. Moher D, Shamseer L, Clarke M, Ghersi D, Liberati A, Petticrew M, Shekelle P, Stewart LA and Group P-P. Preferred reporting items for systematic review and meta-analysis protocols (PRISMA-P) 2015 statement. Systematic reviews. 2015; 4:1.
55. Feng Y, Duan F, Song C, Zhao X, Dai L and Cui S. Systematic evaluation of cancer risk associated with rs2292832 in miR149 and rs895819 in miR27a: a comprehensive and updated metaanalysis. Oncotarget. 2016; 7:22368-84. doi: 10.18632/oncotarget.8082.
56. GA Wells BS, D O’Connell, J Peterson, V Welch, M Losos, et al. The Newcastle-Ottawa Scale (NOS) for assessing the quality of nonrandomised studies in meta analyses. .
57. Higgins JP, Thompson SG, Deeks JJ and Altman DG. Measuring inconsistency in meta-analyses. Bmj. 2003; 327:557-560.
58. Mantel N and Haenszel W. Statistical aspects of the analysis of data from retrospective studies of disease. Journal of the National Cancer Institute. 1959; 22:719-748.
59. DerSimonian R and Laird N. Meta-analysis in clinical trials. Controlled clinical trials. 1986; 7:177-188.
60. Egger M, Davey Smith G, Schneider M and Minder C. Bias in meta-analysis detected by a simple, graphical test. Bmj. 1997; 315:629-634.
61. Benjamini Y HY. Controlling the false discovery rate: a practical and powerful approach to multiple testing. Journal of the Royal Statistical Society Series B (Methodological), . 1995; 57:289-300.