
INTRODUCTION
Renal cell carcinoma (RCC) accounts for over 80% of kidney cancers, and 338,000 new cases were diagnosed worldwide in 2012 [1]. The incidence of RCC is increasing due to recent improvements in screening technologies, such as ultrasound and computed tomography. Although molecular-targeted anti-angiogenic multi-tyrosine kinase inhibitors have been developed, they show limited effects, particularly in patients with advanced RCC; consequently, the prognosis of advanced-stage RCC is still poor [2].
Sunitinib is one of the most common molecular-targeted drugs for metastatic RCC. A phase 3 clinical trial of sunitinib versus interferon alpha in patients with metastatic RCC ushered in the molecular-targeted era in the treatment of RCC [3]. Although side effects, such as hand-foot syndrome, thrombocytopenia, general fatigue, and hypothyroidism, often occur with sunitinib treatment, sunitinib is still a standard treatment for metastatic RCC due to the relatively longer progression-free survival time and higher response rate [4–6]. Additionally, sunitinib therapy is often associated with treatment failure in patients with metastatic RCC.
MicroRNAs (miRNAs) are small noncoding RNAs that function as a fine tuner of protein-coding or noncoding gene expression [7, 8]. A growing body of evidence suggests that aberrantly expressed miRNAs contribute to cancer pathogenesis and drug resistance [9, 10]. We have sequentially identified antitumor miRNA-mediated RCC pathways based on RCC miRNA signatures [11–13]. The next challenge in our RCC study is to identify key molecules and novel pathways involved in the resistance of molecular-targeted therapies for RCC.
Accordingly, in this study, we constructed a miRNA expression signature to identify pathways activated by sunitinib treatment using autopsy specimens from patients with RCC. The miRNA expression signature revealed that microRNA-101(miR-101) was significantly suppressed in sunitinib-treated RCC tissues compared with that in primary RCC tissues. Additionally, we demonstrated that miR-101 exhibited antitumor activity and directly suppressed ubiquitin-like with PHD and ring finger domains 1 (UHRF1). Moreover, we investigated UHRF1-mediated downstream pathways in RCC cells. Elucidation of the miRNA signature of sunitinib-treated RCC tissues may be useful for identification of the novel molecular mechanisms of RCC recurrence, metastasis, and drug resistance.
RESULTS
Construction of the miRNA expression signature of sunitinib-treated RCC
First, we analyzed the expression levels of mature miRNAs in sunitinib-treated RCC specimens by PCR- based array analysis. Also, we reviewed our miRNA expression data of 10 sunitinib-naïve RCC specimens and 5 normal kidney tissues, and we constructed a signature of downregulated miRNAs in sunitinib-naïve RCC tissues (Supplementary Table S1). Of the 11 sunitinib- treated RCC specimens examined in this study, we used 4 specimens (No. 1, No. 5, No. 6, and No. 8; Table 1) for array analysis. Compared with our previous miRNA signature in primary RCC specimens, 232 miRNAs were significantly downregulated in sunitinib-treated RCC specimens [11]. We listed the top 40 downregulated miRNAs in sunitinib-treated RCC specimens (Table 2). Among them, we focused on miR-101, which showed the most dramatic downregulation in sunitinib-treated RCC, for further studies.
Table 1: Patient characteristics (sunitinib-treated RCC specimens)
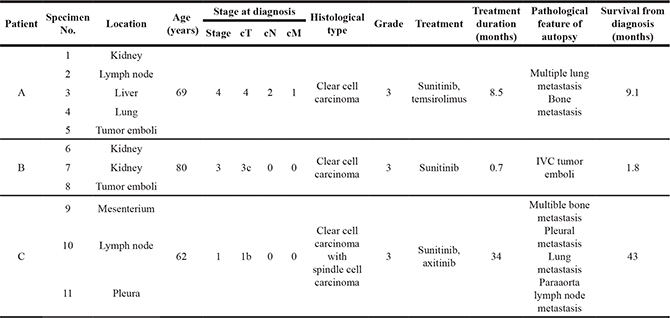
Table 2: Downregulated miRNAs in sunitinib-treated RCC (versus primary RCC)
miRNA |
Log2 ratio (sunitinib failure/primary) |
Primary RCC |
Sunitinib failure RCC |
P-value |
|---|---|---|---|---|
hsa-miR-101 |
–9.89 |
0.00193 |
2.04E-06 |
6.74E-05 |
hsa-miR-29b |
–9.73 |
0.00213 |
2.51E-06 |
6.20E-05 |
hsa-miR-190 |
–9.66 |
0.00061 |
7.51E-07 |
6.39E-04 |
hsa-miR-128 |
–9.46 |
0.00036 |
5.11E-07 |
2.52E-04 |
hsa-miR-23b |
–9.40 |
0.00035 |
5.11E-07 |
2.80E-03 |
hsa-miR-10b |
–9.36 |
0.00599 |
9.10E-06 |
3.84E-04 |
hsa-miR-766 |
–9.27 |
0.00032 |
5.11E-07 |
1.75E-03 |
hsa-miR-142-5p |
–9.22 |
0.00035 |
5.92E-07 |
9.89E-04 |
hsa-miR-1275 |
–9.03 |
0.00027 |
5.11E-07 |
2.17E-03 |
hsa-miR-629 |
–8.99 |
0.00026 |
5.11E-07 |
3.24E-04 |
hsa-let-7c |
–8.91 |
0.00216 |
4.49E-06 |
3.73E-04 |
hsa-miR-135a |
–8.89 |
0.0006 |
1.26E-06 |
3.77E-02 |
hsa-miR-320b |
–8.84 |
0.00083 |
1.81E-06 |
7.83E-05 |
hsa-miR-24-2* |
–8.82 |
0.00023 |
5.11E-07 |
2.68E-04 |
hsa-miR-99a* |
–8.67 |
0.00035 |
8.60E-07 |
2.96E-04 |
hsa-miR-31* |
–8.59 |
0.00112 |
2.92E-06 |
4.68E-02 |
hsa-miR-450a |
–8.57 |
0.00019 |
5.11E-07 |
1.33E-03 |
hsa-miR-455-3p |
–8.49 |
0.00173 |
4.80E-06 |
5.45E-05 |
hsa-miR-340 |
–8.43 |
0.00448 |
1.30E-05 |
6.99E-08 |
hsa-miR-126* |
–8.37 |
0.09059 |
2.75E-04 |
1.85E-04 |
hsa-miR-15b* |
–8.35 |
0.00017 |
5.11E-07 |
8.21E-03 |
hsa-miR-29c |
–8.32 |
0.03819 |
1.20E-04 |
1.13E-04 |
hsa-miR-204 |
–8.29 |
0.03376 |
1.08E-04 |
6.10E-03 |
hsa-miR-424* |
–8.14 |
0.00014 |
5.11E-07 |
2.59E-03 |
hsa-miR-27b |
–8.13 |
0.00574 |
2.05E-05 |
2.67E-04 |
hsa-miR-1 |
–8.08 |
0.00014 |
5.11E-07 |
5.84E-03 |
hsa-miR-592 |
–8.05 |
0.00111 |
4.19E-06 |
2.77E-03 |
hsa-miR-20a* |
–7.97 |
0.0003 |
1.21E-06 |
4.21E-04 |
hsa-miR-450b-5p |
–7.85 |
0.00024 |
1.02E-06 |
1.48E-05 |
hsa-miR-10a |
–7.69 |
0.00458 |
2.22E-05 |
1.95E-04 |
hsa-let-7a |
–7.64 |
0.00517 |
2.60E-05 |
3.20E-06 |
hsa-miR-32 |
–7.63 |
0.00014 |
7.23E-07 |
1.13E-04 |
hsa-miR-324-5p |
–7.63 |
0.00079 |
3.98E-06 |
1.07E-04 |
hsa-miR-429 |
–7.63 |
0.0042 |
2.12E-05 |
5.17E-04 |
hsa-miR-98 |
–7.61 |
0.00055 |
2.80E-06 |
1.39E-06 |
hsa-miR-598 |
–7.59 |
0.00105 |
5.42E-06 |
5.39E-06 |
hsa-miR-148b |
–7.57 |
0.00042 |
2.20E-06 |
8.74E-07 |
hsa-miR-577 |
–7.56 |
0.00021 |
1.11E-06 |
7.18E-03 |
hsa-miR-26b |
–7.51 |
0.05631 |
3.10E-04 |
3.85E-06 |
hsa-miR-545 |
–7.48 |
0.00018 |
1.03E-06 |
3.89E-05 |
Expression levels of miR-101 in RCC clinical specimens and RCC cell lines
Using RT-qPCR, we evaluated the expression levels of miR-101 in normal kidney (n = 41), primary RCC (n = 42), and sunitinib-treated RCC (n = 11) tissues. Normal kidney tissues were adjacent to primary RCC tissues. The histological type of all primary RCC specimens was clear cell RCC, and 81.0% of patient tissues were classified as pT1 tumors according to the TNM classification (Table 3).
Table 3: Patient characteristics (primary RCC specimens)
Total number |
42 |
|
Median age (range) (years) |
69 |
(41–91) |
Sex |
||
Male |
30 |
71% |
Female |
12 |
29% |
Laterality |
||
Right |
20 |
48% |
Left |
21 |
50% |
Bilateral |
1 |
2% |
Histology |
||
Clear cell RCC |
42 |
100% |
Tumor grade |
||
G1 |
5 |
12% |
G2 |
29 |
69% |
G3 |
7 |
2% |
Unknown |
1 |
2% |
Pathological tumor stage |
||
pT1 |
34 |
81% |
pT2 |
1 |
2% |
pT3 |
6 |
14% |
Unknown |
1 |
2% |
Metastasis |
||
M 0 |
37 |
88% |
M 1 |
5 |
12% |
Venous invasion |
||
v 0 |
26 |
62% |
v 1 |
15 |
36% |
Unknown |
1 |
2% |
Recurrence |
||
Recurrence + |
3 |
7% |
Recurrence – |
26 |
62% |
Unknown |
13 |
31% |
The expression levels of miR-101 were significantly downregulated (P = 0.022) in primary RCC tissues compared with that in normal kidney tissues (Figure 1A). Furthermore, the levels of miR-101 were significantly downregulated (P = 0.0013) in sunitinib-treated RCC tissues compared with those in normal kidney tissues (Figure 1A). miR-101 expression levels were low in the RCC cell lines 786-O and Caki-1.
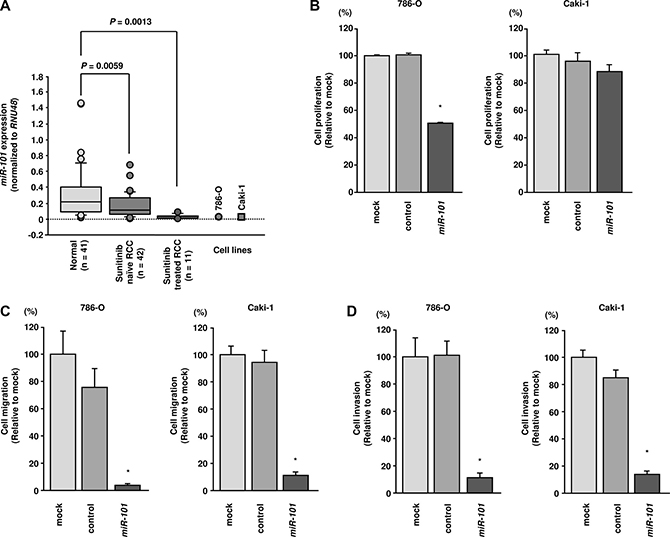
Figure 1: Analysis of miR-101 expression in RCC clinical specimens and functional analysis of miR-101 transfection in 786-O and Caki-1 cells. (A) Expression levels of miR-101 in RCC clinical specimens. RNU48 was used for normalization. (B) Cell proliferation was assessed 72 h after transfection with miR-101 using XTT assays. (C) Cell migration was assessed 48 h after transfection with miR-101 using uncoated Transwell polycarbonate membrane filters. (D) Cell invasion was assessed 48 h after transfection with miR- 101 using Matrigel invasion assays. *P< 0.0001. The bars indicate SDs.
Effects of restoring miR-101 expression on cell proliferation, migration, and invasion in RCC cells
To investigate the functional roles of miR-101 in RCC, we performed gain-of-function studies in 786-O and Caki-1 cells by transfecting the cells with miRNA mimics.
XTT assays indicated that cell proliferation was inhibited by miR-101 transfection in 786-O cells but not in Caki-1 cells (P < 0.0001; Figure 1B). Using wound-healing assays, miR-101 transfection significantly inhibited cell migration as compared with mock- or miR-control-transfected cells (P < 0.0001; Figure 1C). Similarly, Matrigel invasion assays demonstrated that cell invasion activity was significantly inhibited in miR-101 transfectants in comparison with mock or miR-control transfectants (P < 0.0001; Figure 1D).
Identification of target genes suppressed by miR- 101 in RCC
To identify target genes of miR-101, we performed in silico analysis with the TargetScan program and GEO database. Analysis by the TargetScan program demonstrated that miR-101 could target 3,013 genes according to the sequences of their 3′UTRs. Among these genes, 790 had broadly conserved miR-101 sites across vertebrates. To gain further insights into which genes were suppressed by tumour-suppressive miR-101 in RCC, we investigated their expression statuses in RCC clinical specimens and examined gene expression profiles in the GEO database (accession numbers: GSE36985 and GSE22541) to evaluate upregulated genes in RCC specimens. Consequently, among the 790 putative conserved target genes of miR-101, 43 genes were significantly upregulated in RCC specimens compared with those in normal kidney tissues (log2 ratio > 1.0). We sorted these candidate genes in order of expression levels in RCC from the GEO database, because genes with high expression in RCC tissues are thought to function as oncogenes in RCC. Among genes which have conserved target sites for miR-101, UHRF1 was the most upregulated gene. Among genes with multiple conserved target sites for miR-101, EZH2 showed the greatest upregulation (Table 4).
Table 4: Putative target genes of miR-101 and upregulated genes in RCC clinical specimens
Entrez gene ID |
Symbol |
Location |
Gene name |
No. of conserved sites |
No. of poorly conserved sites |
GEO fold change |
|---|---|---|---|---|---|---|
29128 |
UHRF1 |
19p13.3 |
ubiquitin-like with PHD and ring finger domains 1 |
1 |
0 |
3.178567 |
8497 |
PPFIA4 |
1q32.1 |
protein tyrosine phosphatase, receptor type, f polypeptide (PTPRF), interacting protein (liprin), alpha 4 |
1 |
0 |
3.09998 |
1404 |
HAPLN1 |
5q14.3 |
hyaluronan and proteoglycan link protein 1 |
1 |
0 |
2.781324 |
6664 |
SOX11 |
2p25.2 |
SRY (sex determining region Y)-box 11 |
1 |
0 |
2.577679 |
163404 |
LPPR5 |
1p21.3 |
lipid phosphate phosphatase-related protein type 5 |
1 |
0 |
2.450066 |
2335 |
FN1 |
2q35 |
fibronectin 1 |
1 |
1 |
2.446963 |
23023 |
TMCC1 |
3q22.1 |
transmembrane and coiled-coil domain family 1 |
1 |
0 |
2.226072 |
286336 |
FAM78A |
9q34.13 |
family with sequence similarity 78, member A |
1 |
1 |
2.194299 |
2146 |
EZH2 |
7q36.1 |
enhancer of zeste homolog 2 (Drosophila) |
2 |
0 |
2.003227 |
5129 |
CDK18 |
1q32.1 |
cyclin-dependent kinase 18 |
1 |
0 |
2.002138 |
54541 |
DDIT4 |
10q22.1 |
DNA-damage-inducible transcript 4 |
1 |
0 |
1.998703 |
55824 |
PAG1 |
8q21.13 |
phosphoprotein associated with glycosphingolipid microdomains 1 |
1 |
0 |
1.995799 |
114088 |
TRIM9 |
14q22.1 |
tripartite motif containing 9 |
1 |
0 |
1.912238 |
23452 |
ANGPTL2 |
9q33.3 |
angiopoietin-like 2 |
1 |
0 |
1.707627 |
3782 |
KCNN3 |
1q21.3 |
potassium intermediate/small conductance calcium-activated channel, subfamily N, member 3 |
2 |
1 |
1.643804 |
10019 |
SH2B3 |
12q24.12 |
SH2B adaptor protein 3 |
1 |
0 |
1.578665 |
54329 |
GPR85 |
7q31.1 |
G protein-coupled receptor 85 |
1 |
0 |
1.54526 |
84206 |
MEX3B |
15q25.2 |
mex-3 homolog B (C. elegans) |
1 |
0 |
1.526703 |
50515 |
CHST11 |
12q23.3 |
carbohydrate (chondroitin 4) sulfotransferase 11 |
1 |
1 |
1.521547 |
2697 |
GJA1 |
6q22.31 |
gap junction protein, alpha 1, 43kDa |
1 |
0 |
1.484238 |
6925 |
TCF4 |
18q21.2 |
transcription factor 4 |
2 |
0 |
1.474271 |
60675 |
PROK2 |
3p13 |
prokineticin 2 |
1 |
0 |
1.455421 |
23551 |
RASD2 |
22q12.3 |
RASD family, member 2 |
1 |
0 |
1.436602 |
23151 |
GRAMD4 |
22q13.31 |
GRAM domain containing 4 |
1 |
0 |
1.424502 |
1003 |
CDH5 |
16q21 |
cadherin 5, type 2 (vascular endothelium) |
1 |
0 |
1.387176 |
4233 |
MET |
7q31.2 |
met proto-oncogene (hepatocyte growth factor receptor) |
1 |
0 |
1.35197 |
2313 |
FLI1 |
11q24.3 |
Friend leukemia virus integration 1 |
1 |
0 |
1.324487 |
7039 |
TGFA |
2p13.3 |
transforming growth factor, alpha |
1 |
0 |
1.320208 |
2113 |
ETS1 |
11q24.3 |
v-ets erythroblastosis virus E26 oncogene homolog 1 (avian) |
1 |
0 |
1.319352 |
64919 |
BCL11B |
14q32.2 |
B-cell CLL/lymphoma 11B (zinc finger protein) |
1 |
0 |
1.312486 |
491 |
ATP2B2 |
3p25.3 |
ATPase, Ca++ transporting, plasma membrane 2 |
2 |
0 |
1.306825 |
3832 |
KIF11 |
10q23.33 |
kinesin family member 11 |
1 |
0 |
1.299276 |
114800 |
CCDC85A |
2p16.1 |
coiled-coil domain containing 85A |
1 |
0 |
1.22271 |
111 |
ADCY5 |
3q21.1 |
adenylate cyclase 5 |
1 |
0 |
1.214093 |
80149 |
ZC3H12A |
1p34.3 |
zinc finger CCCH-type containing 12A |
1 |
0 |
1.203416 |
50807 |
ASAP1 |
8q24.21 |
ArfGAP with SH3 domain, ankyrin repeat and PH domain 1 |
1 |
1 |
1.145483 |
2200 |
FBN1 |
15q21.1 |
fibrillin 1 |
1 |
0 |
1.11977 |
54877 |
ZCCHC2 |
18q21.33 |
zinc finger, CCHC domain containing 2 |
1 |
0 |
1.118277 |
861 |
RUNX1 |
21q22.12 |
runt-related transcription factor 1 |
2 |
0 |
1.105534 |
84627 |
ZNF469 |
16q24.2 |
zinc finger protein 469 |
1 |
0 |
1.100592 |
80727 |
TTYH3 |
7p22.3 |
tweety homolog 3 (Drosophila) |
1 |
0 |
1.096306 |
23295 |
MGRN1 |
16p13.3 |
mahogunin, ring finger 1 |
1 |
0 |
1.030189 |
162073 |
ITPRIPL2 |
16p12.3 |
inositol 1,4,5-trisphosphate receptor interacting protein-like 2 |
1 |
1 |
1.024236 |
Thus, we focused on UHRF1 and EZH2 for further studies. Our strategy for selection of miR-101-targeted genes is shown in Figure 2.
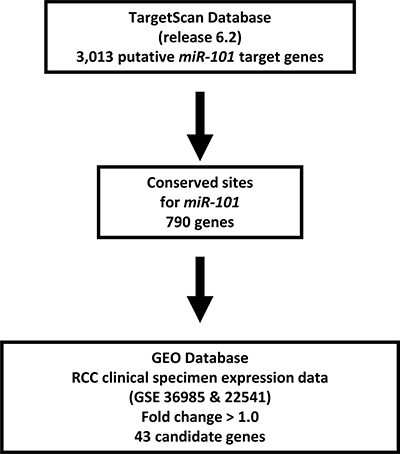
Figure 2: Selection strategy for target genes of miR-101. Analysis using the TargetScan program showed that 3,013 genes had putative target sites for miR-101 in their 3′ UTRs. Among these genes, 790 had conserved target sites among vertebrates for miR-101. Then, we assessed the expression levels of these genes in RCC clinical specimens using GEO expression profiles (GSE36985 and GSE22541). Finally, genes upregulated in RCC (log2 ratio > 1.0) were selected as putative target genes.
UHRF1 and EZH2 were downregulated by miR- 101 transfection in RCC cells
Next, we performed real-time RT-qPCR in 786- O and Caki-1 cells to analyze whether restoration of miR- 101 altered the expression levels of the UHRF1 and EZH2 genes. Additionally, western blotting was carried out to investigate the effects of miR-101 transfection on UHRF1 and EZH2 protein. The mRNA and protein expression levels of UHRF1 and EZH2 were significantly downregulated by miR-101 transfection as compared with those in mock- or miR-control-transfected cells (P < 0.002 and P < 0.005; Figure 3A and 3B, Figure 4A and 4B). Because direct regulation of EZH2 by miR-101 in RCC has been reported by several groups [14, 15], we focused on the UHRF1 gene in this study.
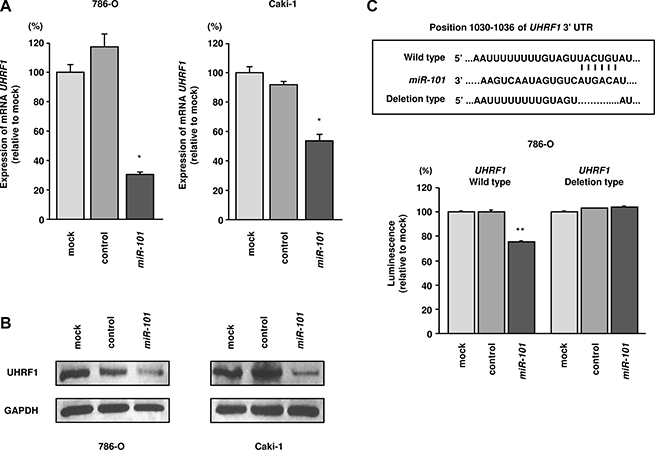
Figure 3: miR-101 directly downregulated UHRF1 expression in RCC cells. (A) UHRF1 mRNA expression 72 h after transfection with miR-101. GUSB was used as an internal control. (B) UHRF1 protein expression 72 h after transfection with miR-101. GAPDH was used as a loading control. (C) miR-101 binding sites in UHRF1 mRNA. Luciferase reporter assays were carried out using a vector encoding the putative miR-101 target site in the UHRF1 3′-UTR (position 1030–1036) for wild-type and deletion constructs. *P < 0.002, **P < 0.0001. The bars indicate SDs.
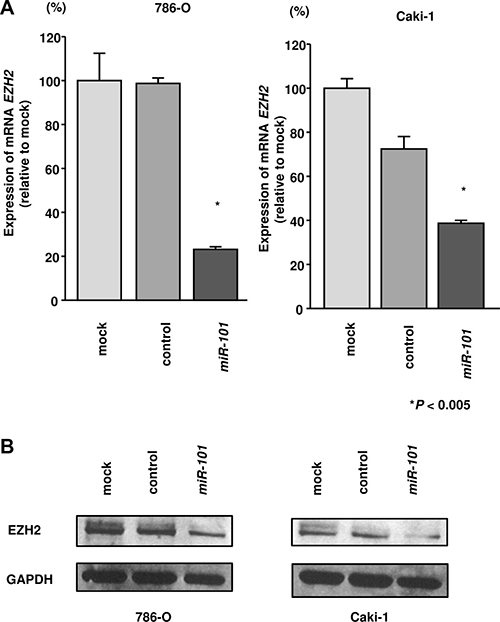
Figure 4: Effects of miR-101 transfection on EZH2 mRNA and protein expression in RCC cells. (A) EZH2 mRNA expression was determined at 72 h after transfection with miR-101. GUSB was used as an internal control. (B) EZH2 protein expression was evaluated by western blotting at 72 h after transfection with miR-101. GAPDH was used as a loading control. *P < 0.005. The bars indicate SDs.
miR-101 directly suppressed UHRF1 in RCC cells
We performed luciferase reporter assays in 786- O cells to determine whether UHRF1 was directly suppressed by miR-101. The TargetScan database predicted that the putative miR-101 target site in UHRF1 was position 1030–1036 in the 3′UTR. We used two vectors: a vector encoding a partial wild-type sequence of the 3′ UTR of UHRF1 mRNA including the predicted miR-101 target site, and a vector lacking the miR-101 target site. We found that the luminescence intensity was significantly reduced by cotransfection with miR-101 and the vector carrying the wild-type 3′UTR of UHRF1. However, the luminescence intensity was not decreased when the seed sequence of the target site was deleted from the vectors (P < 0.0001; Figure 3C).
Knockdown of UHRF1 significantly inhibited cell proliferation, migration, and invasion in RCC cell lines
To investigate the functional role of UHRF1 in RCC, we carried out loss-of-function studies by siRNA transfection. First, we evaluated the knockdown efficiency of si-UHRF1 transfection in 786-O and Caki- 1 cells. RT-qPCR and western blotting indicated that si- UHRF1 transfection effectively downregulated UHRF1 and UHRF1 in 786-O and Caki-1 cells (P < 0.0001; Figure 5A and 5B).
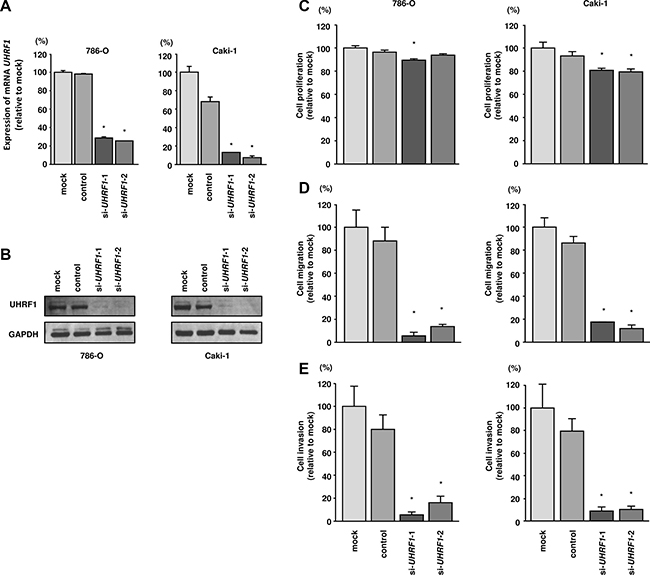
Figure 5: Effects of UHRF1 knockdown in RCC cells and impact of UHRF1 expression on clinical RCC specimens. (A) UHRF1 mRNA expression was determined at 72 h after transfection with si-UHRF1. GUSB was used as an internal control. (B) UHRF1 protein expression was evaluated by western blotting at 72 h after transfection with si-UHRF1. GAPDH was used as a loading control. *P < 0.0001. The bars indicate SDs. (C) Cell proliferation was assessed 72 h after transfection with si-UHRF1 using XTT assays. (D) Cell migration was assessed 48 h after transfection with si-UHRF1 using uncoated Transwell polycarbonate membrane filters. (E) Cell invasion was assessed 48 h after transfection with si-UHRF1 using Matrigel invasion assays. *P < 0.0001. The bars indicate SDs.
In functional assays, si-UHRF1 transfection significantly inhibited cell proliferation compared with that in mock- or si-control-transfected 786-O and Caki- 1 cells. Furthermore, cell migration and invasion were significantly inhibited by si-UHRF1 transfection compared with mock- or si-control-transfection in 786-O and Caki-1 cells (P < 0.0001; Figure 5C–5E).
Identification of pathways suppressed by UHRF1 knockdown in RCC cells
To further investigate which genes and pathways are suppressed by miR-101/UHRF1 signaling, we performed genome wide gene expression analysis using knockdown of UHRF1 by siRNA in 786-O cells. We deposited these data in the GEO (accession number: GSE77790). Genes which were significantly downregulated by si-UHRF1 (Log2 [si-UHRF1/mock] < –1.0) were categorized by KEGG pathway analysis using the GeneCodis program. Table 5 shows pathways that were significantly downregulated by knockdown of UHRF1. Pathways related to post-transcriptional modification, including the nucleotide excision repair and mismatch repair pathways, were significantly suppressed by knockdown of UHRF1.
Table 5: Significantly downregulated pathways by knockdown of UHRF1 in 786-O cells
KEGG number |
Pathways |
p value |
Genes |
|---|---|---|---|
4110 |
Cell cycle |
1.20.E-14 |
SMC1A, PTTG2, MCM4, CDC20, CCNA2, PTTG1, MCM7, CDC25C, CCNB1, MAD2L1, PRKDC, SKP1, MCM3, DBF4, STAG2, BUB1B, CDC45, MCM2, CDK1 |
3030 |
DNA replication |
3.77.E-11 |
MCM4, MCM7, RFC1, POLD1, RFC5, MCM3, POLA2, FEN1, MCM2, RFC4 |
4114 |
Oocyte meiosis |
4.72.E-07 |
CALML3, SMC1A, PTTG2, CDC20, PTTG1, CDC25C, CCNB1, MAD2L1, SKP1, CALM3, CDK1 |
3018 |
RNA degradation |
4.12.E-06 |
DCPS, SKIV2L2, EXOSC3, PABPC1, PABPC3, LSM5, MPHOSPH6, DDX6 |
3430 |
Mismatch repair |
1.48.E-05 |
RFC1, POLD1, EXO1, RFC5, RFC4 |
5322 |
Systemic lupus erythematosus |
3.52.E-05 |
HIST1H2AI, SSB, H2AFX, HIST1H2AJ, HIST1H2AC, HIST1H4D, HIST1H3G, SNRPD1 |
3013 |
RNA transport |
4.26.E-05 |
EIF5B, PABPC1, EIF3D, PABPC3, TACC3, EIF1AY, EIF3A, NUP205, EIF2S2, EIF1AX |
3420 |
Nucleotide excision repair |
2.68.E-04 |
CUL4B, RFC1, POLD1, RFC5, RFC4 |
5130 |
Pathogenic Escherichia coli infection |
9.75.E-04 |
CLDN1, NCK2, TUBA1B, ITGB1, NCL |
533 |
Glycosaminoglycan biosynthesis - keratan sulfate |
1.12.E-03 |
CHST1, FUT8, B4GALT1 |
4914 |
Progesterone-mediated oocyte maturation |
1.38.E-03 |
CCNA2, CDC25C, CCNB1, MAD2L1, HSP90AA1, CDK1 |
4120 |
Ubiquitin mediated proteolysis |
3.11.E-03 |
CDC20, CUL4B, UBE3B, UBE3A, BRCA1, TRIP12, SKP1 |
UHRF1 and EZH2 expression in sunitinib-treated clinical RCC specimens
Finally, we examined UHRF1 expression status in clinical RCC specimens.
In a study with a relatively large sample size in GSE65615, higher UHRF1 expression was observed in sunitinib-treated RCC specimens compared with that in sunitinib-naïve RCC specimens (P = 0.0049; Figure 6A). To examine whether UHRF1 expression predicted overall survival, we used the TCGA-KIRC database (https://tcga-data.nci.nih.gov/tcga/). A total of 533 patients who underwent surgery for RCC and were pathologically diagnosed as having clear cell RCC were divided into two groups: z-score > 0 and z-score < 0 [16, 17]. Higher expression of UHRF1 was associated with shorter overall survival (P < 0.0001; Figure 6B). Multivariate Cox proportional hazards models were used to assess independent predictors of overall survival times, including disease stage, pT stage, age at diagnosis, gender, and UHRF1 expression. High UHRF1 expression was one of the significant prognostic factors in patients with RCC (hazard ratio = 2.027, 95% confidence interval = 1.490– 2.759, P < 0.0001; Figure 6C). To analyze UHRF1 protein expression, immunohistochemistry was performed with sunitinib-treated specimens. Immunohistochemical staining of UHRF1 in these specimens demonstrated high expression of UHRF1 in sunitinib-treated RCC cells (Figure 6D).
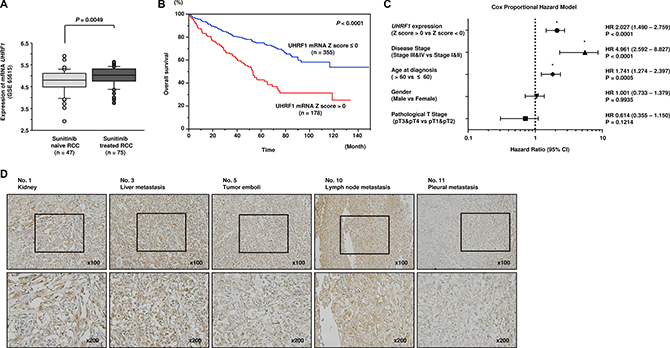
Figure 6: Clinical significance of UHRF1 expression in RCC. (A) UHRF1 was highly expressed in sunitinib-treated RCC compared with that in sunitinib-naïve RCC (P = 0.0049). (B) The overall survival rate of patients with high UHRF1 expression was significantly lower than that of patients with low UHRF1 expression (P < 0.0001). (C) Multivariate Cox proportional hazards model for prediction of overall survival showed high UHRF1 expression, advanced disease stage, and age at diagnosis were significant prognostic factors (P < 0.0001, P < 0.0001, P = 0.0005, respectively). (D) High expression of UHRF1 was observed in sunitinib-treated RCC specimens.
Similarly, we analyzed EZH2 status in clinical specimens. In GSE65615, we did not find significant difference of EZH2 expression between sunitinib-treated RCC specimens and sunitinib-naïve RCC specimens (Figure 7A). Higher expression of EZH2 was associated with shorter overall survival (P < 0.0001; Figure 7B). High EZH2 expression was one of the significant prognostic factors in patients with RCC (hazard ratio = 1.828, 95% confidence interval = 1.348–2.493, P < 0.0001; Figure 7C). High expression of EZH2 was observed in several sunitinib-treated RCC specimens (Figure 7D).
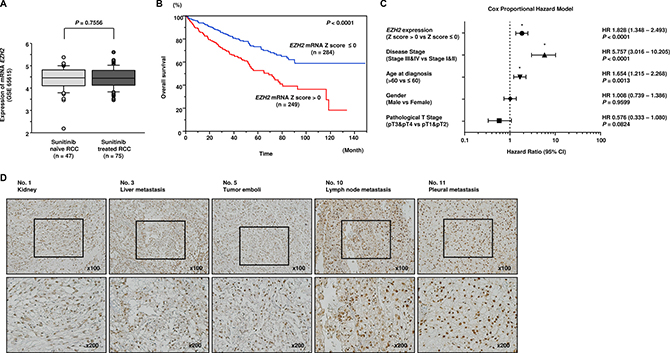
Figure 7: Clinical significance of EZH2 expression in RCC. (A) There was no significant difference of EZH2 expression between sunitinib-treated RCC specimens and sunitinib-naïve RCC specimens. (B) The overall survival rate of patients with high EZH2 expression was significantly lower than that of patients with low EZH2 expression (P < 0.0001). (C) Multivariate Cox proportional hazards model for prediction of overall survival showed high EZH2 expression, advanced disease stage, and age at diagnosis were significant prognostic factors (P < 0.0001, P < 0.0001, P = 0.0013, respectively). (D) High expression of EZH2 was observed in several sunitinib-treated RCC specimens.
DISCUSSION
In patients treated with sunitinib, the initial response rate is approximately 40%; however, sunitinib-treated RCC cells usually acquire resistance to tyrosine kinase inhibitors [18]. Thus, overcoming sunitinib resistance is a major challenge for medical oncologists and urologists. Some mechanisms for sunitinib resistance in RCC have been described. One of the most well-studied pathways is hypoxia. VEGF-targeted drugs (e.g., sunitinib, pazopanib, axitinib, etc.) promote hypoxia in tumors by inhibiting angiogenesis, leading to high expression of HIF proteins [19]. Consequently, HIF proteins bind to hypoxia-responsive elements (HRE) and promote the expression of multiple oncogenes [20, 21]. Another mechanism is the activation of alternative signaling pathways. Hepatocyte growth factor (HGF)/cMET signaling, sphingosine kinase 1 (SPHK1)/sphingosine-1-phosphate (S1P)/extracellular signal-regulated kinase (ERK) signaling, and delta-like ligand4 (DLL4)/Notch signaling have significant roles in drug resistance [22–24].
Our research group has sequentially identified novel RCC oncogenic pathways based on antitumor miRNAs identified using RCC miRNA signatures [11, 13, 25, 26]. Our miRNA-mediated RNA network analysis may provide many insights into RCC pathogenesis. In this study, we constructed a miRNA expression signature using autopsy specimens from patients with RCC who showed sunitinib failure. We believe that this miRNA signature will contribute to analysis of the mechanisms mediating resistance to sunitinib treatment. We identified 40 microRNAs that were downregulated in sunitinib-treated RCC tissues compared with that in untreated RCC tissues. Among these downregulated miRNAs, we identified miR-29b, which has been reported to suppress the extracellular matrix (ECM). In RCC cells, miR-29b directly suppresses the lysyl oxidase-like 2 (LOXL2) gene, leading to inhibition of cancer cell invasion [25]. Furthermore, miR-23b, miR- 10b,miR-135a, miR-29c, miR-27b, miR-1, and miR- 26b have been reported as tumour-suppressive miRNAs in RCC by different research groups [12, 26–30]. In particular, let-7c sensitizes cells to 5-FU in RCC cells in vitro, and miR-27b sensitizes cells to doxorubicin, sorafenib, gefitinib in RCC cells [31, 32]. Chemoresistance and miRNAs listed in this signature have been reported previously in a variety of cancers: miR-29b in ovarian cancer, miR-128 in breast cancer, miR-23b in gastric cancer, and miR-10b in colorectal and breast cancer [33–36]. Therefore, miRNAs listed in this signature would have importance in resistance to both chemotherapy and molecular targeted therapy. These facts ensure the reliability of the data in this signature.
In this study, we focused on the miR-101 because miR-101 was the most strongly downregulated miRNA in sunitinib-treated tissues. Our present data showed that miR-101 functioned as an antitumor miRNA in RCC cells. The antitumor roles of miR-101 have been reported in various types of cancers, including hepatocellular carcinoma, gastric cancer, breast cancer, and lung cancer [37–40]. Furthermore, miR-101 restoration enhances chemosensitivity in lung cancer and salivary gland adenoid cystic carcinoma [41, 42]. Thus, our data are consistent with previous studies of miR-101 in cancer research.
One interesting capacity of miRNA analyses is identification of miRNA-regulated genes in the human genome and investigation of the functional roles of these miRNA-regulated genes in cancer cells. In this study, we found that UHRF1, the master regulator of epigenetic modifications, was directly suppressed by miR-101 in RCC cells and that its expression enhanced cancer cell migration and invasion. Moreover, overexpression of UHRF1 was confirmed in sunitinib-treated RCC tissues, and higher expression of UHRF1 was associated with shorter overall survival after surgery for RCC. Because sunitinib is the first-line treatment option for recurrent RCC after surgical treatment, this association is consistent with other results. Ablation of UHRF1 induces genomic hypomethylation, and overexpression of UHRF1 has been reported in several cancers [43, 44]. UHRF1 consists of five recognizable domains: PHD, Tudor, SRA, RING, and UBL [45]. UHRF1 is required for DNA methyltransferase 1 (DNMT1) function through direct binding to DNMT1 and activation of DNMT1 function for maintenance of DNA methylation [46].
We found that miR-101 directly suppressed UHRF1; however, previous reports have indicated that EZH2 is also directly suppressed by miR-101 [14, 47]. Consistent with this, we confirmed that EZH2 was suppressed by miR-101 in RCC cells (Figure 4). Interestingly, EZH2 has also been reported to be a master regulator of transcription by modulation of histone modification or methylation [48, 49]. miR-101 can target and suppress both UHRF1 and EZH2 in RCC cells. Previous report indicated that UHRF1 and EZH2 synergistically and independently silence tumor suppressors by methylation: UHRF1 induce methylation of tumor suppressor gene DNA CpGs and H3-K9me3, and EZH2 induce methylation of H3-K27 [50]. Overexpression of both UHRF1 and EZH2 coordinately suppressed antitumor genes and contributed to prostate cancer pathogenesis and metastasis [50]. More recently, patient-derived clear cell RCC xenografts with sunitinib resistant phenotype showed increased EZH2 expression, and inhibition of EZH2 resulted in enhancement of the antitumor effects of sunitinib [51]. Consequently, we speculate that overexpression of UHRF1 and EZH2 coordinately suppressed antitumor genes and deeply contribute to sunitinib resistant processes in RCC cells. In sunitinib-treated RCC tissues, loss of antitumor miR- 101 may lead to upregulation of UHRF1 and EZH2, and consequently, post-transcriptional modification of multiple genes would promote cancer-related phenotypes in cells. Moreover, we investigated the downstream pathways suppressed by knockdown of UHRF1 and found that pathways such as cell cycle, DNA replication, and RNA degradation were enriched in RCC cells. Thus, antitumor miR-101-mediated UHRF1 pathways may be suppressed by sunitinib treatment. Our present data will contribute to our understanding of drug-resistance mechanisms in RCC cells.
MATERIALS AND METHODS
Patients and clinical RCC specimens
Clinical kidney specimens were obtained from patients admitted to Kagoshima University Hospital and Teikyo University Chiba Medical Centre Hospital from 2004 to 2014. A total of 42 pairs of clear cell renal carcinoma and adjacent noncancerous tissue were obtained by nephrectomy. Three patients who died of RCC after sunitinib treatment failure underwent autopsies. RCC tissues (n = 42), adjacent noncancerous kidney tissues (n = 41), and sunitinib-treated RCC tissues (n= 11) were used. The patients’ backgrounds and characteristics are summarized in Tables 1 and 3. Samples were staged according to the UICC TNM classification. Written consent for tissue donation for research purposes was obtained from each patient before sample collection. The protocol was approved by the Institutional Review Board of Chiba University, Kagoshima University and Teikyo University.
Construction of the miRNA expression signature of sunitinib-treated RCC
miRNA expression patterns were evaluated using a TaqMan LDA Human microRNA Panel v2.0 (Applied Biosystems, Foster City, CA, USA). A cut-off P-value of less than 0.05 was used to narrow down the candidates after global normalization of the raw data. After global normalization, additional normalization was carried out with the U6 gene. The procedure was performed as described previously [11, 52].
Cell culture
Human RCC cell lines (786-O and Caki-1 cells) were obtained from the American Type Culture Collection (Manassas, VA, USA). Cells were maintained in RPMI-1640 medium supplemented with 10% fetal bovine serum in a humidified atmosphere containing 5% CO2 and 95% air at 37°C.
RNA isolation
Total RNA was isolated using TRIzol reagent (Invitrogen, Carlsbad, CA, USA). The quality of RNA was confirmed using an Agilent 2100 Bioanalyzer (Agilent Technologies) as described previously [52–54].
Quantitative real-time reverse transcription polymerase chain reaction (RT-qPCR)
The expression levels of miR-101 (Assay ID: 002253) were analyzed by TaqMan RT-qPCR (TaqMan MicroRNA Assay; Applied Biosystems) and normalized to RNU48 expression (Assay ID: 001006). TaqMan probes and primers for UHRF1(P/N: Hs01086727_m1), EZH2 (P/N: Hs01016789_m1), and GAPDH (P/N: Hs02758991_g1) as an internal control were obtained from Applied Biosystems (Assay-On-Demand Gene Expression Products). The procedure was carried out as previously described [52, 53].
Transfection with miRNA mimic and small-interfering RNA (siRNA)
Ambion Pre-miR miRNA precursor for hsa-miR-101-3p (product ID: PM11414) was used in this study as a miRNA mimic. The following siRNAs were used: Stealth Select RNAi siRNA; si-UHRF1 (cat no.: HSS179005 and HSS179006; Invitrogen); and negative control miRNA/siRNA (P/N: AM17110; Applied Biosystems). RNAs were incubated with OPTI-MEM (Invitrogen) and Lipofectamine RNAiMAX reagent (Invitrogen). The transfection procedures were performed as previously described [52, 53].
Cell proliferation, migration, and invasion assays
Cell proliferation assays were performed using XTT assays, migration assays were performed using uncoated Transwell polycarbonate membrane filters, and invasion assays were performed using Matrigel-coated Boyden chambers, as previously described [52, 53].
Identification of genes suppressed by miR-101
A combination of in silico and genome-wide gene expression analyses were carried out to investigate target genes suppressed by miR-101. First, genes suppressed by miR-101 were listed using the TargetScan database. Next, to identify upregulated genes in RCC, we analyzed a publicly available gene expression data set in the Gene Expression Omnibus (GEO; accession numbers: GSE36985 and GSE22541). Finally, upregulated mRNAs containing miR- 101 target sites were listed as putative target genes of miR-101. The procedure for selection is summarized in Figure 2.
Western blotting
Immunoblotting was performed with rabbit anti-UHRF1 antibodies (1:1000, PA5-29884; Pierce Antibodies, Thermo Scientific, Fremont, CA, USA) and anti-EZH2 antibodies (1:250, 36-6300; Life Technologies, Carlsbad, CA, USA). Anti-GAPDH antibodies (1:1000, ab8245; Abcam, Cambridge, UK) were used as an internal loading control. Membranes were washed and incubated with anti-rabbit IgG horseradish peroxidase (HRP)-linked antibodies (7074; Cell Signaling Technology, Danvers, MA, USA). Complexes were visualized with Clarity Western ECL Substrate (Bio-Rad, Hercules, CA, USA). The procedures were performed as previously described [52, 53].
Plasmid construction and dual-luciferase reporter assay
Partial wild-type sequences of the UHRF1 3′ untranslated region (UTR) or those with a deleted miR-101 target site (position 1030–1036 of the UHRF1 3′ UTR) were inserted between the XhoI–PmeI restriction sites in the 3′ UTR of the hRluc gene in the psiCHECK-2 vector (C8021; Promega, Madison, WI, USA). The protocol for vector construction was described previously [52, 53].
Identification of pathways and genes suppressed by UHRF1 in RCC
To identify molecular pathways suppressed by UHRF1 gene expression in RCC cells, we performed gene expression analysis using si-UHRF1-transfected 786-O cells. An oligomicroarray (SurePrint G3 Human 8x60k v3; Agilent Technologies) was used for gene expression studies. The data were deposited in the GEO database (accession number GSE77790). Genes downregulated by knockdown of UHRF1 were categorized into Kyoto Encyclopaedia of Genes and Genomes (KEGG) pathways using the GENECODIS program (http://genecodis.cnb.csic.es/). The strategy of this analysis procedure has been described previously [52–54].
Immunohistochemisty
A total of 11 specimens were used (Table 1). Tissue specimens were immunostained with an Ultra-Vision Detection System (Thermo Scientific) following the manufacturer’s protocol. Primary rabbit polyclonal antibodies against UHRF1 (1:500, PA5-29884; Pierce Antibodies, Thermo Scientific) and EZH2 (1:125, 36-6300; Life Technologies) were used for immunochemistry. The slides were treated with biotinylated goat antibodies (Histofine SAB-PO kit; Nichirei, Tokyo, Japan). The procedures were performed as previously described [52–54].
TCGA-KIRC and other human RCC data analysis
To explore the clinical significance of UHRF1 in RCC, we used the RNA sequencing database in TCGA-KIRC (The Cancer Genome Atlas Kidney Renal Clear Cell Carcinoma: https://tcga-data.nci.nih.gov/tcga/). The gene expression and clinical data were retrieved from cBioportal (http://www.cbioportal.org/, the provisional data downloaded on May 10th, 2016). The normalized mRNA expression value in the RNA sequencing data was processed and provided in Z-score. We performed multivariate analysis (Cox proportional hazards model) that included pathological tumour and disease stage, age, and gender under consideration. We also employed the gene expression microarray data including sunitinib-treated and sunitinib-naïve human RCC specimens (GSE 65615).
Statistical analysis
The relationships between 2 groups and numerical values were analyzed using Mann-Whitney U-tests. The relationships among more than 3 variables and numerical values were analyzed using the Bonferroni-adjusted Mann-Whitney U-test. A multivariate Cox proportional hazards model was used to establish independent factors for overall survival. Survival analysis was carried out using the Kaplan–Meier method and log-rank tests. The Kaplan–Meier method and log-rank test were performed using JMP software (version 12, SAS Institute Inc., Cary, NC, USA); all other analyses were performed using Expert StatView (version 5, SAS Institute Inc.).
ACKNOWLEDGMENTS AND FUNDING
This study was supported by the KAKENHI, grant numbers (C) 15K10801, (C) 26462430, (B) 15K20071, (B) 25293333, and (B) 16H05462.
CONFLICTS OF INTEREST
The authors declare no conflicts of interest.
REFERENCES
1. Ferlay J, Soerjomataram I, Dikshit R, Eser S, Mathers C, Rebelo M, Parkin DM, Forman D, Bray F. Cancer incidence and mortality worldwide: sources, methods and major patterns in GLOBOCAN 2012. Int J Cancer. 2015; 136:E359–86. doi: 10.1002/ijc.29210.
2. Motzer RJ, Jonasch E, Agarwal N, Beard C, Bhayani S, Bolger GB, Chang SS, Choueiri TK, Costello BA, Derweesh IH, Gupta S, Hancock SL, Kim JJ, et al. Kidney cancer, version 3.2015. J Natl Compr Canc Netw. 2015; 13:151–9.
3. Motzer RJ, Hutson TE, Tomczak P, Michaelson MD, Bukowski RM, Rixe O, Oudard S, Negrier S, Szczylik C, Kim ST, Chen I, Bycott PW, Baum CM, et al. Sunitinib versus interferon alfa in metastatic renal-cell carcinoma. N Engl J Med. 2007; 356:115–24. doi: 10.1056/NEJMoa065044.
4. Tomita Y. Treatment strategies for advanced renal cell carcinoma: A new paradigm for surgical treatment. Int J Urol. 2016; 23:13–21. doi: 10.1111/iju.12899.
5. Porta C, Paglino C, Grunwald V. Sunitinib re-challenge in advanced renal-cell carcinoma. Br J Cancer. 2014; 111:1047–53. doi: 10.1038/bjc.2014.214.
6. Eisen T, Sternberg CN, Robert C, Mulders P, Pyle L, Zbinden S, Izzedine H, Escudier B. Targeted therapies for renal cell carcinoma: review of adverse event management strategies. J Natl Cancer Inst. 2012; 104:93–113. doi: 10.1093/jnci/djr511.
7. Goto Y, Kurozumi A, Enokida H, Ichikawa T, Seki N. Functional significance of aberrantly expressed microRNAs in prostate cancer. Int J Urol. 2015; 22:242–52. doi: 10.1111/iju.12700.
8. Bartel DP. MicroRNAs: target recognition and regulatory functions. Cell. 2009; 136:215–33. doi: 10.1016/j.cell.2009.01.002.
9. Garzon R, Calin GA, Croce CM. MicroRNAs in Cancer. Annu Rev Med. 2009; 60:167–79. doi: 10.1146/annurev.med.59.053006.104707.
10. Tay Y, Rinn J, Pandolfi PP. The multilayered complexity of ceRNA crosstalk and competition. Nature. 2014; 505:344–52. doi: 10.1038/nature12986.
11. Hidaka H, Seki N, Yoshino H, Yamasaki T, Yamada Y, Nohata N, Fuse M, Nakagawa M, Enokida H. Tumor suppressive microRNA-1285 regulates novel molecular targets: aberrant expression and functional significance in renal cell carcinoma. Oncotarget. 2012; 3:44–57. doi: 10.18632/oncotarget.417.
12. Ishihara T, Seki N, Inoguchi S, Yoshino H, Tatarano S, Yamada Y, Itesako T, Goto Y, Nishikawa R, Nakagawa M, Enokida H. Expression of the tumor suppressive miRNA-23b/27b cluster is a good prognostic marker in clear cell renal cell carcinoma. J Urol. 2014; 192:1822–30. doi: 10.1016/j.juro.2014.07.001.
13. Yoshino H, Enokida H, Itesako T, Kojima S, Kinoshita T, Tatarano S, Chiyomaru T, Nakagawa M, Seki N. Tumor-suppressive microRNA-143/145 cluster targets hexokinase-2 in renal cell carcinoma. Cancer Sci. 2013; 104:1567–74. doi: 10.1111/cas.12280.
14. Sakurai T, Bilim VN, Ugolkov AV, Yuuki K, Tsukigi M, Motoyama T, Tomita Y. The enhancer of zeste homolog 2 (EZH2), a potential therapeutic target, is regulated by miR-101 in renal cancer cells. Biochem Biophys Res Commun. 2012; 422:607–14. doi: 10.1016/j.bbrc.2012.05.035.
15. Zheng M, Jiang YP, Chen W, Li KD, Liu X, Gao SY, Feng H, Wang SS, Jiang J, Ma XR, Cen X, Tang YJ, Chen Y, et al. Snail and Slug collaborate on EMT and tumor metastasis through miR-101-mediated EZH2 axis in oral tongue squamous cell carcinoma. Oncotarget. 2015; 6:6797–810. doi: 10.18632/oncotarget.3180.
16. Gao J, Aksoy BA, Dogrusoz U, Dresdner G, Gross B, Sumer SO, Sun Y, Jacobsen A, Sinha R, Larsson E, Cerami E, Sander C, Schultz N. Integrative analysis of complex cancer genomics and clinical profiles using the cBioPortal. Sci Signal. 2013; 6:pl1. doi: 10.1126/scisignal.2004088.
17. Cerami E, Gao J, Dogrusoz U, Gross BE, Sumer SO, Aksoy BA, Jacobsen A, Byrne CJ, Heuer ML, Larsson E, Antipin Y, Reva B, Goldberg AP, et al. The cBio cancer genomics portal: an open platform for exploring multidimensional cancer genomics data. Cancer Discov. 2012; 2:401–4. doi: 10.1158/2159-8290.CD-12-0095.
18. Powles T, Staehler M, Ljungberg B, Bensalah K, Canfield SE, Dabestani S, Giles R, Hofmann F, Hora M, Kuczyk MA, Lam T, Marconi L, Merseburger AS, et al. Updated EAU Guidelines for Clear Cell Renal Cancer Patients Who Fail VEGF Targeted Therapy. Eur Urol. 2016; 69:4–6. doi: 10.1016/j.eururo.2015.10.017.
19. Joosten SC, Hamming L, Soetekouw PM, Aarts MJ, Veeck J, van Engeland M, Tjan-Heijnen VC. Resistance to sunitinib in renal cell carcinoma: From molecular mechanisms to predictive markers and future perspectives. Biochim Biophys Acta. 2015; 1855:1–16. doi: 10.1016/j.bbcan.2014.11.002.
20. Harris AL. Hypoxia—a key regulatory factor in tumour growth. Nat Rev Cancer. 2002; 2:38–47. doi: 10.1038/nrc704.
21. Baldewijns MM, van Vlodrop IJ, Vermeulen PB, Soetekouw PM, van Engeland M, de Bruine AP. VHL and HIF signalling in renal cell carcinogenesis. J Pathol. 2010; 221:125–38. doi: 10.1002/path.2689.
22. Shojaei F, Lee JH, Simmons BH, Wong A, Esparza CO, Plumlee PA, Feng J, Stewart AE, Hu-Lowe DD, Christensen JG. HGF/c-Met acts as an alternative angiogenic pathway in sunitinib-resistant tumors. Cancer Res. 2010; 70:10090–100. doi: 10.1158/0008-5472.CAN-10-0489.
23. Zhang L, Wang X, Bullock AJ, Callea M, Shah H, Song J, Moreno K, Visentin B, Deutschman D, Alsop DC, Atkins MB, Mier JW, Signoretti S, et al. Anti-S1P Antibody as a Novel Therapeutic Strategy for VEGFR TKI-Resistant Renal Cancer. Clin Cancer Res. 2015; 21:1925–34. doi: 10.1158/1078-0432.CCR-14-2031.
24. Li JL, Sainson RC, Oon CE, Turley H, Leek R, Sheldon H, Bridges E, Shi W, Snell C, Bowden ET, Wu H, Chowdhury PS, Russell AJ, et al. DLL4-Notch signaling mediates tumor resistance to anti-VEGF therapy in vivo. Cancer Res. 2011; 71:6073–83. doi: 10.1158/0008-5472.CAN-11-1704.
25. Nishikawa R, Chiyomaru T, Enokida H, Inoguchi S, Ishihara T, Matsushita R, Goto Y, Fukumoto I, Nakagawa M, Seki N. Tumour-suppressive microRNA-29s directly regulate LOXL2 expression and inhibit cancer cell migration and invasion in renal cell carcinoma. FEBS Lett. 2015; 589:2136–45. doi: 10.1016/j.febslet.2015.06.005.
26. Kurozumi A, Kato M, Goto Y, Matsushita R, Nishikawa R, Okato A, Fukumoto I, Ichikawa T, Seki N. Regulation of the collagen cross-linking enzymes LOXL2 and PLOD2 by tumor-suppressive microRNA-26a/b in renal cell carcinoma. Int J Oncol. 2016; 48:1837–46. doi: 10.3892/ijo.2016.3440.
27. Liu W, Zabirnyk O, Wang H, Shiao YH, Nickerson ML, Khalil S, Anderson LM, Perantoni AO, Phang JM. miR-23b targets proline oxidase, a novel tumor suppressor protein in renal cancer. Oncogene. 2010; 29:4914–24. doi: 10.1038/onc.2010.237.
28. Fritz HK, Lindgren D, Ljungberg B, Axelson H, Dahlback B. The miR(21/10b) ratio as a prognostic marker in clear cell renal cell carcinoma. Eur J Cancer. 2014; 50:1758–65. doi: 10.1016/j.ejca.2014.03.281.
29. Kawakami K, Enokida H, Chiyomaru T, Tatarano S, Yoshino H, Kagara I, Gotanda T, Tachiwada T, Nishiyama K, Nohata N, Seki N, Nakagawa M. The functional significance of miR-1 and miR-133a in renal cell carcinoma. Eur J Cancer. 2012; 48:827–36. doi: 10.1016/j.ejca.2011.06.030.
30. Yamada Y, Hidaka H, Seki N, Yoshino H, Yamasaki T, Itesako T, Nakagawa M, Enokida H. Tumor-suppressive microRNA-135a inhibits cancer cell proliferation by targeting the c-MYC oncogene in renal cell carcinoma. Cancer Sci. 2013; 104:304–12. doi: 10.1111/cas.12072.
31. Mu W, Hu C, Zhang H, Qu Z, Cen J, Qiu Z, Li C, Ren H, Li Y, He X, Shi X, Hui L. miR-27b synergizes with anticancer drugs via p53 activation and CYP1B1 suppression. Cell Res. 2015; 25:477–95. doi: 10.1038/cr.2015.23.
32. Peng J, Mo R, Ma J, Fan J. let-7b and let-7c are determinants of intrinsic chemoresistance in renal cell carcinoma. World J Surg Oncol. 2015; 13:175. doi: 10.1186/s12957-015-0596-4.
33. Dai F, Zhang Y, Chen Y. Involvement of miR-29b signaling in the sensitivity to chemotherapy in patients with ovarian carcinoma. Hum Pathol. 2014; 45:1285–93. doi:10.1016/j.humpath.2014.02.008.
34. Zhu Y, Yu F, Jiao Y, Feng J, Tang W, Yao H, Gong C, Chen J, Su F, Zhang Y, Song E. Reduced miR-128 in breast tumor-initiating cells induces chemotherapeutic resistance via Bmi-1 and ABCC5. Clin Cancer Res. 2011; 17:7105–15. doi: 10.1158/1078-0432.CCR-11-0071.
35. An Y, Zhang Z, Shang Y, Jiang X, Dong J, Yu P, Nie Y, Zhao Q. miR-23b-3p regulates the chemoresistance of gastric cancer cells by targeting ATG12 and HMGB2. Cell Death Dis. 2015; 6: e1766. doi: 10.1038/cddis.2015.123.
36. Nishida N, Yamashita S, Mimori K, Sudo T, Tanaka F, Shibata K, Yamamoto H, Ishii H, Doki Y, Mori M. MicroRNA-10b is a prognostic indicator in colorectal cancer and confers resistance to the chemotherapeutic agent 5-fluorouracil in colorectal cancer cells. Ann Surg Oncol. 2012; 19:3065–71. doi: 10.1245/s10434-012-2246-1.
37. Su H, Yang JR, Xu T, Huang J, Xu L, Yuan Y, Zhuang SM. MicroRNA-101, down-regulated in hepatocellular carcinoma, promotes apoptosis and suppresses tumorigenicity. Cancer Res. 2009; 69:1135–42. doi: 10.1158/0008-5472.CAN-08-2886.
38. Wang HJ, Ruan HJ, He XJ, Ma YY, Jiang XT, Xia YJ, Ye ZY, Tao HQ. MicroRNA-101 is down-regulated in gastric cancer and involved in cell migration and invasion. Eur J Cancer. 2010; 46:2295–303. doi: 10.1016/j.ejca.2010.05.012.
39. Li JT, Jia LT, Liu NN, Zhu XS, Liu QQ, Wang XL, Yu F, Liu YL, Yang AG, Gao CF. MiRNA-101 inhibits breast cancer growth and metastasis by targeting CX chemokine receptor 7. Oncotarget. 2015; 6:30818–30. doi: 10.18632/oncotarget.5067.
40. Wang L, Zhang LF, Wu J, Xu SJ, Xu YY, Li D, Lou JT, Liu MF. IL-1beta-mediated repression of microRNA-101 is crucial for inflammation-promoted lung tumorigenesis. Cancer Res. 2014; 74:4720–30. doi: 10.1158/0008-5472.CAN-14-0960.
41. Riquelme E, Suraokar M, Behrens C, Lin HY, Girard L, Nilsson MB, Simon G, Wang J, Coombes KR, Lee JJ, Hong WK, Heymach J, Minna JD, et al. VEGF/VEGFR-2 upregulates EZH2 expression in lung adenocarcinoma cells and EZH2 depletion enhances the response to platinum-based and VEGFR-2-targeted therapy. Clin Cancer Res. 2014; 20:3849–61. doi: 10.1158/1078-0432.CCR-13-1916.
42. Liu XY, Liu ZJ, He H, Zhang C, Wang YL. MicroRNA-101-3p suppresses cell proliferation, invasion and enhances chemotherapeutic sensitivity in salivary gland adenoid cystic carcinoma by targeting Pim-1. Am J Cancer Res. 2015; 5:3015–29.
43. Unoki M, Brunet J, Mousli M. Drug discovery targeting epigenetic codes: the great potential of UHRF1, which links DNA methylation and histone modifications, as a drug target in cancers and toxoplasmosis. Biochem Pharmacol. 2009; 78:1279–88. doi: 10.1016/j.bcp.2009.05.035.
44. Matsushita R, Yoshino H, Enokida H, Goto Y, Miyamoto K, Yonemori M, Inoguchi S, Nakagawa M, Seki N. Regulation of UHRF1 by dual-strand tumor-suppressor microRNA-145 (miR-145-5p and miR-145-3p): Inhibition of bladder cancer cell aggressiveness. Oncotarget. 2016; 7:28460–87. doi: 10.18632/oncotarget.8668.
45. Hu L, Li Z, Wang P, Lin Y, Xu Y. Crystal structure of PHD domain of UHRF1 and insights into recognition of unmodified histone H3 arginine residue 2. Cell Res. 2011; 21:1374–8. doi: 10.1038/cr.2011.124.
46. Bashtrykov P, Jankevicius G, Jurkowska RZ, Ragozin S, Jeltsch A. The UHRF1 protein stimulates the activity and specificity of the maintenance DNA methyltransferase DNMT1 by an allosteric mechanism. J Biol Chem. 2014; 289:4106–15. doi: 10.1074/jbc.M113.528893.
47. Varambally S, Cao Q, Mani RS, Shankar S, Wang X, Ateeq B, Laxman B, Cao X, Jing X, Ramnarayanan K, Brenner JC, Yu J, Kim JH, et al. Genomic loss of microRNA-101 leads to overexpression of histone methyltransferase EZH2 in cancer. Science. 2008; 322:1695–9. doi: 10.1126/science.1165395.
48. Kim KH, Roberts CW. Targeting EZH2 in cancer. Nat Med. 2016; 22:128–34. doi: 10.1038/nm.4036.
49. Chase A, Cross NC. Aberrations of EZH2 in cancer. Clin Cancer Res. 2011; 17:2613–8. doi: 10.1158/1078-0432.CCR-10-2156.
50. Babbio F, Pistore C, Curti L, Castiglioni I, Kunderfranco P, Brino L, Oudet P, Seiler R, Thalman GN, Roggero E, Sarti M, Pinton S, Mello-Grand M, et al. The SRA protein UHRF1 promotes epigenetic crosstalks and is involved in prostate cancer progression. Oncogene. 2012; 31:4878–87. doi: 10.1038/onc.2011.641.
51. Adelaiye R, Ciamporcero E, Miles KM, Sotomayor P, Bard J, Tsompana M, Conroy D, Shen L, Ramakrishnan S, Ku SY, Orillion A, Prey J, Fetterly G, et al. Sunitinib dose escalation overcomes transient resistance in clear cell renal cell carcinoma and is associated with epigenetic modifications. Mol Cancer Ther. 2015; 14:513–22. doi: 10.1158/1535-7163.MCT-14-0208.
52. Goto Y, Kojima S, Nishikawa R, Kurozumi A, Kato M, Enokida H, Matsushita R, Yamazaki K, Ishida Y, Nakagawa M, Naya Y, Ichikawa T, Seki N. MicroRNA expression signature of castration-resistant prostate cancer: the microRNA-221/222 cluster functions as a tumour suppressor and disease progression marker. Br J Cancer. 2015; 113:1055–65. doi: 10.1038/bjc.2015.300.
53. Goto Y, Kojima S, Kurozumi A, Kato M, Okato A, Matsushita R, Ichikawa T, Seki N. Regulation of E3 ubiquitin ligase-1 (WWP1) by microRNA-452 inhibits cancer cell migration and invasion in prostate cancer. Br J Cancer. 2016; 114:1135–44. doi: 10.1038/bjc.2016.95.
54. Kurozumi A, Goto Y, Matsushita R, Fukumoto I, Kato M, Nishikawa R, Sakamoto S, Enokida H, Nakagawa M, Ichikawa T, Seki N. Tumor-suppressive microRNA-223 inhibits cancer cell migration and invasion by targeting ITGA3/ITGB1 signaling in prostate cancer. Cancer Sci. 2016; 107:84–94. doi: 10.1111/cas.12842.