
INTRODUCTION
Breast cancer is an heterogeneous disease with several molecular alterations [1, 2]. This has been characterized with different methods including immunohistochemistry (IHC) or by using transcriptomic analyses [1, 2]. Whole sequencing studies have also shown heterogeneity at a molecular level including mutations, or copy number modifications [3]. In addition, this biological diversity correlates with a different clinical behavior and pattern of relapse, helping to select among different therapeutic strategies [4].
Tumors that express the estrogen receptor and lack HER2 overexpression have been classified by genomic expression as luminal [2], and are treated with anti-hormonal therapy [2, 5]. Among this group those that are enriched with genes associated with proliferation and therefore linked with a slightly worse outcome have been termed luminal B tumors [2]. This subgroup can be identified by the high expression of KI67 measured by IHC [6]. However, although the luminal A group have better outcome, some of these tumors can have different clinical behavior and be associated with a more aggressive phenotype.
Triple negative breast cancer (TNBC) is a molecular subtype defined by the lack of expression of estrogen and HER2 receptors [1]. It accounts for around 15% of tumors and is associated with worse outcome [1, 4]. Among molecular functions that are altered in breast cancer “cell division” and “DNA damage response” are some of the most modified and relevant, particularly in the TNBC subgroup [5]. In this context, genes that participate in the regulation of these two functions can be the target of novel compounds like those directed against PARP such as Olaparib, or novel agents under development against mitotic kinases [7, 8].
In this project we hypothesized that deregulation of genes involved in “DNA damage metabolism” is not restricted to TNBC, and could be present also in other breast cancer subtypes like in estrogen receptor positive tumors. In this context, estrogen receptor positive tumors that overexpress some of these genes could be those that are associated with a more aggressive phenotype.
In the present article by using gene expression analyses we explore genes related to DNA repair mechanism that are deregulated in luminal tumors and that are associated with poor outcome. We identified a set of genes that predict detrimental outcome only in luminal tumors. In addition, the fact that this set is associated with DNA damage suggests that these genes should be evaluated in future studies as potential predictors of efficacy to DNA damaging agents.
RESULTS
Identification of metabolic DNA related genes linked to worse outcome
To identify functions and relevant genes that could predict worse outcome, we first compared transcriptomic data from normal breast with basal-like tumors using a public dataset (GEO DataSet accession number: GDS2250). Using a cut-off fold change of four or more, we selected 2286 genes differentially expressed between both groups. Functional analyses identified several functions as can be seen in Figure 1A, and we focused on DNA metabolic process where 62 genes were deregulated. The genes included in this function as provided by DAVID bioinformatic resources 6.7 are shown in Table 1. 49 of these genes were upregulated (Figure 1B).
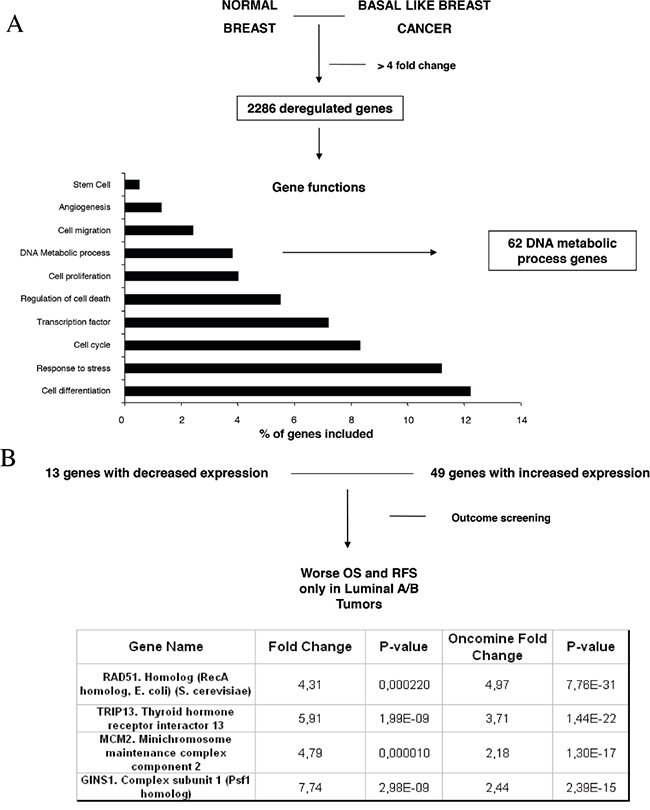
Figure 1: Gene-set enrichment analyses comparing normal epithelial cell with basal like tumors and identification of deregulated genes. A. Deregulated genes with a minimum of four fold-change difference, and functional analyses of the identified genes, as described in material and methods. B. Outcome screening for RFS and OS using KMplotter. Fold changed observed in our dataset and by using data available in Oncomine, as described in material and methods.
Table 1: List of genes deregulated between normal epithelial cells and basal tumors included in the DNA metabolic process as classified by David Bioinformatics Resources 6.7
DAVID Bioinformatics Resources 6.7 |
||||
|---|---|---|---|---|
Term |
Genes |
Adjusted p-value (Benjamini) |
Count/total list |
Population hits/total |
DNA Metabolic Process (62 different genes) |
||||
DNA Metabolic Process |
BRIP1, CDC45L, CHEK1, FANCB, FANCI, GINS1, GINS4, MMS19, RAD51AP1, RAD51, RAD51L1, RAD51L, TRAF3IP2, RECQL4, CIDEA, CDC25A, CDC25C, CDC6, CENPF, CDT1, RMI2, C5orf51, CRY2, CCNE2, CDKN2A, CDKN2C, DSCC1, DTL, ESCO2, ERCC4, EXO1, FOXP1, ELB, HMGB2, HMGA1, IGF1, IGFBP4, KPNA2, LIN9, MND1, MCM10, MCM2, MCM4, MCM6, MSH6, NFIA, NFIB, NCOA6, ORC1L, PTTG1, PTTG3, PCNAPML, RRM2, SMC5, TYMS, TRIP13, TOP2A, USP1, UHRF1, FOS, XPA. |
1.0E-01 |
3.8% |
62/2116 |
As we hypothesized that upregulated genes within the DNA metabolic process could be involved in the oncogenesis of other breast cancer subtypes, we explored next which of the identified genes were associated with worse relapse free survival (RFS) and overall survival (OS) in luminal tumors. We used the KM plotter tool, as described in material and methods, that contains information from datasets grouping more than 3500 patients. As can be seen in Figure 1B, we identified RAD51, GINS1, TRIP13 and MCM2 genes associated with worse outcome in luminal A, and luminal B tumors, for both RFS and OS (Supplementary Table S1, S2). We also confirmed the upregulation of these genes using data available at Oncomine (Figure 1B).
Gene-set combinations to predict relapse free and overall survival in luminal subtypes
Combinations of several genes showed stronger prediction for worse outcome that when using genes individually (Table 2). For RFS combination of MCM2, TRIP13, GINS1 and RAD51 showed the worse outcome in luminal A tumors (HR 2.15 (1.79-2.59), log rank p=1.1e-16), meanwhile MCM2, TRIP13 and RAD51 were the best combination to predict outcome in the luminal B subtype (HR 1.55 (1.26-1.9) log rank p= 2.3e-05) (Figure 2). For OS, the best combination was TRIP13 and RAD51 in luminal A tumors (HR 2.99 (1.96-4.56) log rank p=9e-08); and MCM2, TRIP13 and RAD51 in the luminal B subtype (HR 1.9 (1.24-2.92) log rank p=0.0029) (Figure 3).
Table 2: List of gene-set combinations in association with RFS and OS in Luminal A and B tumors
Gene Symbols |
Overall Survival |
Relapse Free Survival |
||||||
|---|---|---|---|---|---|---|---|---|
Luminal A |
Luminal B |
Luminal A |
Luminal B |
|||||
Hazard Ratio |
P-value |
Hazard Ratio |
P-value |
Hazard Ratio |
P-value |
Hazard Ratio |
P-value |
|
MCM2 + TRIP13 |
1.83 (1.24 - 2.69) |
2.1E-03 |
1.67 (1.09 - 2.55) |
0.017 |
1.96 (1.63 - 2.36) |
2.4E-13 |
1.42 (1.16 - 1.73) |
7.4E-04 |
MCM2 + GINS1 |
2.06 (1.38 - 3.06) |
2.8E-04 |
1.45 (0.95 - 2.21) |
0.08 |
1.98 (1.65 - 2.38) |
1.1E-13 |
1.28 (1.05 - 1.57) |
0.016 |
MCM2 + RAD51 |
2.12 (1.43 - 3.14) |
1.4E-04 |
1.53 (1 - 2.33) |
0.046 |
1.79 (1.49 - 2.15) |
1.8E-10 |
1.33 (1.09 - 1.63) |
5.00E-03 |
TRIP13 + GINS1 |
2.67 (1.76 - 4.06) |
1.5E-06 |
1.34 (0.88 - 2.04) |
0.17 |
2.04 (1.7 - 2.46) |
9.4E-15 |
1.45 (1.18 - 1.77) |
3.2E-04 |
TRIP13 + RAD51 |
2.99 (1.96 - 4.56) |
9.00E-08 |
1.76 (1.15 - 2.7) |
8.2E-03 |
1.93 (1.61 - 2.32) |
7.8E-13 |
1.52 (1.24 - 1.87) |
4.4E-05 |
GINS1 + RAD51 |
2.55 (1.69 - 3.86) |
4.00E-06 |
1.22 (0.81 - 1.85) |
0.35 |
2.12 (1.76 - 2.55) |
4.4E-16 |
1.49 (1.22 - 1.83) |
1.00E-04 |
MCM2 + TRIP13 + GINS1 |
2.18 (1.46 - 3.25) |
9.4E-05 |
1.59 (1.04 - 2.43) |
0.03 |
2.13 (1.77 - 2.57) |
2.2E-16 |
1.45 (1.18 - 1.77) |
3.3E-04 |
TRIP13 + GINS1 + RAD51 |
2.64 (1.74 - 4.01) |
2.1E-06 |
1.52 (1 - 2.32) |
0.05 |
2.1 (1.74 - 2.52) |
1.00E-15 |
1.32 (1.08 - 1.61) |
7.2E-03 |
MCM2 + TRIP13 + RAD51 |
2.17 (1.46 - 3.23) |
9.00E-05 |
1.9 (1.24 - 2.92) |
2.9E-03 |
2 (1.66 - 2.4) |
6.4E-14 |
1.55 (1.26 - 1.9) |
2.3E-05 |
MCM2 + GINS1 + RAD51 |
2.39 (1.6 - 3.59) |
1.4E-05 |
1.43 (0.94 - 2.18) |
0.093 |
2.08 (1.73 - 2.5) |
1.6E-15 |
1.34 (1.09 - 1.64) |
4.8E-03 |
MCM2 + TRIP13 + GINS1 + RAD51 |
2.34 (1.56 - 3.52) |
2.4E-05 |
1.57 (1.03 - 2.4) |
0.035 |
2.15 (1.79 - 2.59) |
1.1E-16 |
1.46 (1.19 - 1.78) |
2.6E-04 |
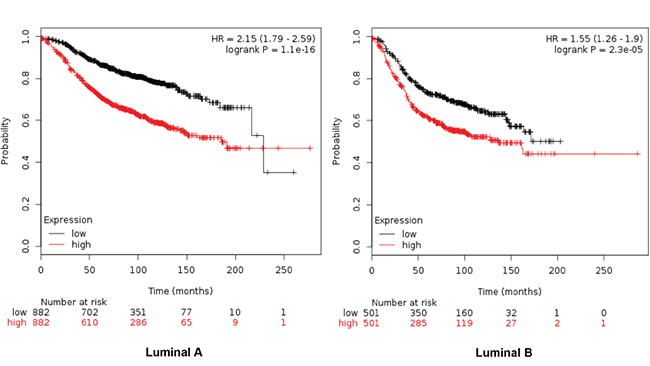
Figure 2: Association of MCM2, TRIP13, GINS1 and RAD51 with RFS in luminal A tumors, and MCM2, TRIP13 and RAD51 for the luminal B subtype.
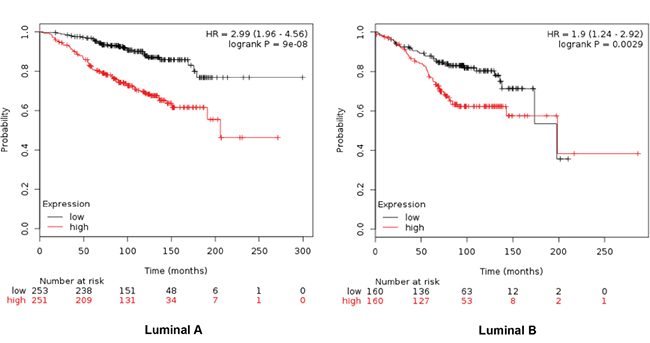
Figure 3: Association of TRIP13 and RAD51 with OS in luminal A tumors, and MCM2, TRIP13 and RAD51 for the luminal B subtype.
Effect of set combinations on ER+/HER2- patients
Table 3 described the different combinations in relation to outcome in ER+/HER2- patients. The combined analyses of TRIP13+RAD51+MCM2 showed the poorest association for RFS (HR 2.25 (1.51-3.35) log rank p= 4.1e-05) (Figure 4) and TRIP13+RAD51 for OS (HR 5.13 (0.6-44.17) log rank p=0.098) (Figure 5).
Table 3: List of gene-set combinations in association with RFS and OS in ER+/HER2- patients
Overall Survival |
Relapse Free Survival |
||||
|---|---|---|---|---|---|
ER+HER2- |
ER+HER2- |
||||
GENE SYMBOLS |
Hazard Ratio |
P-value |
GENE SYMBOLS |
Hazard Ratio |
P-value |
MCM2 + TRIP13 |
2.14 (0.39 − 11.82) |
0.37 |
MCM2 + TRIP13 |
2.15 (1.45 − 3.19) |
1e−04 |
MCM2 + GINS1 |
2.24 (0.41 − 12.29) |
0.34 |
MCM2 + GINS1 |
2 (1.35 − 2.96) |
0.00041 |
MCM2 + RAD51 |
0.96 (0.19 − 4.86) |
0.96 |
MCM2 + RAD51 |
1.92 (1.3 − 2.84) |
0.00083 |
TRIP13 + GINS1 |
2.24 (0.41 − 12.29) |
0.34 |
TRIP13 + GINS1 |
2.12 (1.43 − 3.13) |
0.00013 |
TRIP13 + RAD51 |
5.13 (0.6 − 44.17) |
0.098 |
TRIP13 + RAD51 |
2.17 (1.47 − 3.21) |
7.3e−05 |
GINS1 + RAD51 |
2.04 (0.37 − 11.22) |
0.4 |
GINS1 + RAD51 |
1.81 (1.23 − 2.66) |
0.0021 |
MCM2 + TRIP13 + GINS1 |
2.14 (0.39 − 11.82) |
0.37 |
MCM2 + TRIP13 + GINS1 |
2.22 (1.49 − 3.3) |
5.6e−05 |
TRIP13 + GINS1 + RAD51 |
2.04 (0.37 − 11.22) |
0.4 |
TRIP13 + GINS1 + RAD51 |
2.21 (1.49 − 3.28) |
5.4e−05 |
MCM2 + TRIP13 + RAD51 |
1.95 (0.35 − 10.85) |
0.44 |
MCM2 + TRIP13 + RAD51 |
2.25 (1.51 − 3.35) |
4.1e−05 |
MCM2 + GINS1 + RAD51 |
2.04 (0.37 − 11.22) |
0.4 |
MCM2 + GINS1 + RAD51 |
2.06 (1.39 − 3.06) |
0.00024 |
MCM2 + TRIP13 + GINS1 + RAD51 |
2.04 (0.37 − 11.22) |
0.4 |
MCM2 + TRIP13 + GINS1 + RAD51 |
2.21 (1.48 − 3.28) |
6.3e−05 |
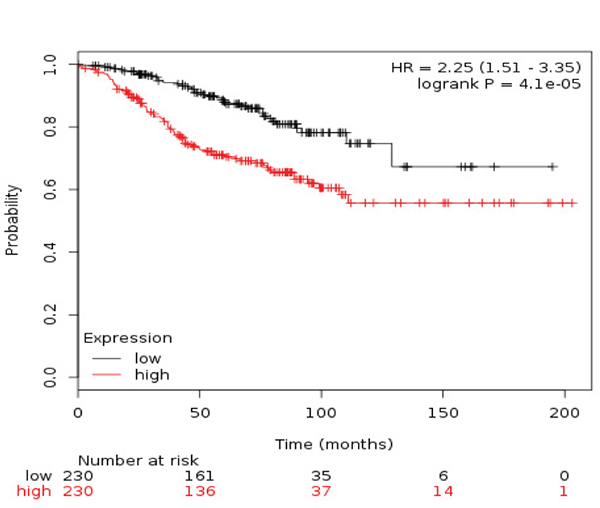
Figure 4: Association of the combined analyses of TRIP13+RAD51+MCM with RFS in ER+/HER2- patients.
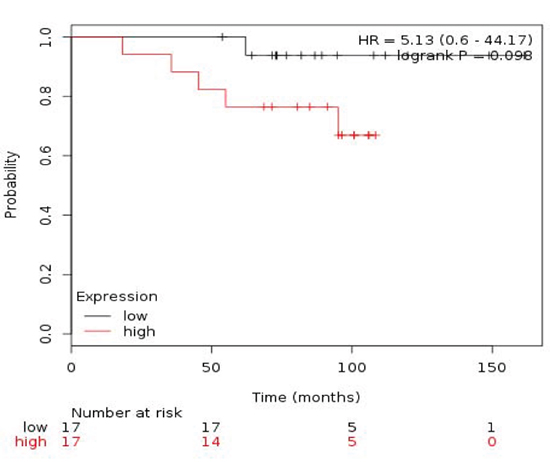
Figure 5: Association of the combined analyses of TRIP13+RAD51 with OS in ER+/HER2- patients.
Molecular alterations in identified genes and biological functions
Finally we evaluated if the identified genes have any relevant molecular alteration in breast tumors by using information contained at cBioportal [9]. No mutations or deletions were identified in a relevant proportion of patients. Amplification of TRIP13 was observed in 3.1% of the 974 breast invasive carcinoma samples (Table 4). Functions of the genes are described in Supplementary Table S3.
Table 4: Copy number alterations (amplifications/deletions) or mutations in the identified genes using data contained in cBioportal as described in material and methods
974 Breast Invasive Carcinoma Samples |
|||
|---|---|---|---|
Gene Name |
Amplification |
Deletion |
Mutation |
MCM2. Minichromosome maintenance complex component 2 |
0.6% |
0.1% |
0.3% |
TRIP13. Thyroid hormone receptor interactor 13 |
3.1% |
0.2% |
0.2% |
GINS1. GINS complex subunit 1 (Psf1 homolog) |
0.7% |
0.1% |
0.2% |
RAD51. RAD51 homolog (RecA homolog, E. coli) (S. cerevisiae) |
0.5% |
0.9% |
0.2% |
DISCUSSION
In the present article we describe a set of genes included within the metabolic DNA process that are linked with worse outcome in luminal breast tumors.
Luminal tumors are a breast cancer subtype that expresses hormone receptors and that is usually targeted with hormonal therapy. In addition, it is associated with good clinical outcome. However, not all patients within this group have the same clinical behavior and some have poor outcome. In this context, it is relevant to identify subgroups of patients that express the estrogen receptor and are associated with a detrimental outcome in order to optimize therapeutic strategies. In our article we describe a set of genes that discriminate luminal tumors, identifying a subset linked with poor prognosis.
The DNA repair machinery is usually hyper activated in tumors and in many occasions deficiencies in some of their components have been linked with the genesis and maintenance of some tumors [8]. In TNBC molecular alterations at a genomic level are implicated in the oncogenesis of this tumor and furthermore can help to identify patients that would response to some therapies [5, 8]. In this project we used basal-like tumors as a model to identify genes that were upregulated in this disease. These genes, as demonstrated latter, could also be expressed in other tumor types, and be linked with a more aggressive phenotype.
In our work, we have identified four genes that are associated with poor outcome in luminal tumors. These genes code for different proteins. MCM2 is a DNA replication licensing factor that has been described as associated with worse outcome in ovarian carcinoma [10]. TRIP13 promotes early steps of the DNA double-strand break repair and its presence was associated with progression in prostate cancer [11]; and GINS1 plays a role in the initiation of DNA replication and has been part of a gene-set associated with outcome in early stage non-small cell lung cancer [12]. Finally overexpression of RAD51 has also been linked with poor outcome in colorectal carcinomas [13]. Of note the involvement of these genes in breast cancer has not been fully explored.
Our work has limitations, this is an in silico analysis based on functional genomics using data from several sources, so evaluation of these findings in an homogeneous data set is mandatory. In addition, no multivariable analyses is included so it is impossible to identify any potential association with other prognostic factors. Finally, the data should be considered hypotheses generating and be confirmed in independent datasets and in homogenous prospective and retrospective studies.
In conclusion, we describe a gene signature linked with DNA metabolic process that is associated with poor outcome in luminal tumors. Our findings have potential to discriminate patients with higher risk of relapse, therefore helping to customize therapies.
MATERIALS AND METHODS
Identification of upregulated genes by transcriptomic analyses
We extracted mRNA level data of normal breast tissue and basal-like cancers from a public dataset (GEO DataSet accession number: GDS2250). Affymetrix CEL files were downloaded and analyzed with Affymetrix Transcriptome Analysis Console 3.0. We selected genes with minimum 4-fold differential expression values between both groups. Gene set enrichment analyses using DAVID Bioinformatics Resources 6.7 was used to analyze the list of genes and to identify functions of these genes (https://david.ncifcrf.gov/), using an adjusted p-value <0.05. Data contained at oncomine (www.oncomine.org) was used to independently confirmed the difference among the selected genes.
Analyses of outcome for RFS and OS
To evaluate the relationship between the presence of different genes and patient clinical outcome we used the KM Plotter Online Tool (http://www.kmplot.com) in different breast cancer subtypes [14].
This is a public database containing information from 3500 patients that permits to investigate the association of genes with overall survival (OS) and relapse-free survival (RFS).
In this dataset breast cancer subtypes are defined as follow: Triple negative: ER-/HER2-. Luminal A: ESR1+/HER2-/MKI67 low. Luminal B: ESR1+/HER2-/MKI67 high and ESR1+/HER2+ and Basal-like: ESR1-/HER2-.
Evaluation of molecular alterations
To explore the presence of mutations, deletions or amplifications in the identified genes we used data contained at cBioportal (www.cbioportal.org) [9].
CONFLICTS OF INTEREST
No conflict of interest to declare for any author of this manuscript
REFERENCES
1. Nielsen TO, Hsu FD, Jensen K, Cheang M, Karaca G, Hu Z, Hernandez-Boussard T, Livasy C, Cowan D, Dressler L, Akslen LA, Ragaz J, Gown AM, et al. Immunohistochemical and clinical characterization of the basal-like subtype of invasive breast carcinoma. Clin Cancer Res. 2004; 10:5367-5374.
2. Sorlie T, Tibshirani R, Parker J, Hastie T, Marron JS, Nobel A, Deng S, Johnsen H, Pesich R, Geisler S, Demeter J, Perou CM, Lønning PE, et al. Repeated observation of breast tumor subtypes in independent gene expression data sets. Proc Natl Acad Sci U S A. 2003; 100:8418-8423.
3. Banerji S, Cibulskis K, Rangel-Escareno C, Brown KK, Carter SL, Frederick AM, Lawrence MS, Sivachenko AY, Sougnez C, Zou L, Cortes ML, Fernandez-Lopez JC, Peng S, et al. Sequence analysis of mutations and translocations across breast cancer subtypes. Nature. 2012; 486:405-409.
4. Dent R, Trudeau M, Pritchard KI, Hanna WM, Kahn HK, Sawka CA, Lickley LA, Rawlinson E, Sun P, Narod SA. Triple-negative breast cancer: clinical features and patterns of recurrence. Clin Cancer Res. 2007; 13:4429-4434.
5. Ocana A, Pandiella A. Identifying breast cancer druggable oncogenic alterations: lessons learned and future targeted options. Clin Cancer Res. 2008; 14:961-970.
6. Cheang MC, Chia SK, Voduc D, Gao D, Leung S, Snider J, Watson M, Davies S, Bernard PS, Parker JS, Perou CM, Ellis MJ, Nielsen TO. Ki67 index, HER2 status, and prognosis of patients with luminal B breast cancer. J Natl Cancer Inst 2009; 101:736-750.
7. Dominguez-Brauer C, Thu KL, Mason JM, Blaser H, Bray MR, Mak TW. Targeting Mitosis in Cancer: Emerging Strategies. Mol Cell. 2015; 60:524-536.
8. O'Connor MJ. Targeting the DNA Damage Response in Cancer. Mol Cell. 2015; 60:547-560.
9. Gao J, Aksoy BA, Dogrusoz U, Dresdner G, Gross B, Sumer SO, Sun Y, Jacobsen A, Sinha R, Larsson E, Cerami E, Sander C, Schultz N, et al. Integrative analysis of complex cancer genomics and clinical profiles using the cBioPortal. Sci Signal. 2013; 6:pl1.
10. Kulkarni AA, Loddo M, Leo E, Rashid M, Eward KL, Fanshawe TR, Butcher J, Frost A, Ledermann JA, Williams GH, Stoeber K. DNA replication licensing factors and aurora kinases are linked to aneuploidy and clinical outcome in epithelial ovarian carcinoma. Clinical Cancer Research. 2007; 13:6153-6161.
11. Larkin SE, Holmes S, Cree IA, Walker T, Basketter V, Bickers B, Harris S, Garbis SD, Townsend PA, Aukim-Hastie C. Identification of markers of prostate cancer progression using candidate gene expression. Br J Cancer. 2012; 106:157-165.
12. Gentles AJ, Bratman SV, Lee LJ, Harris JP, Feng W, Nair RV, Shultz DB, Nair VS, Hoang CD, West RB, Plevritis SK, Alizadeh AA, Diehn M. Integrating Tumor and Stromal Gene Expression Signatures With Clinical Indices for Survival Stratification of Early-Stage Non-Small Cell Lung Cancer. J Natl Cancer Inst. 2015; 107.
13. Tennstedt P, Fresow R, Simon R, Marx A, Terracciano L, Petersen C, Sauter G, Dikomey E, Borgmann K. RAD51 overexpression is a negative prognostic marker for colorectal adenocarcinoma. Int J Cancer. 2013; 132:2118-2126.
14. Györffy B, Lanczky A, Eklund AC, Denkert C, Budczies J, Li Q, Szallasi Z. An online survival analysis tool to rapidly assess the effect of 22,277 genes on breast cancer prognosis using microarray data of 1,809 patients. Breast Cancer Res Treat. 2010; 123:725-731.