
INTRODUCTION
Renal cell carcinoma (RCC) accounts for 2–3% of all adult malignancies and has a mortality rate greater than 40% [1]. The incidence of RCC (all stages) is increasing yearly [2]. Early diagnosis provides the greatest chance for cure. However, more than 30% of RCC patients have metastatic disease at the time of diagnosis. This can be attributed to the lack of symptoms typically associated with early-stage RCC [3]. Clinical symptoms such as pain, the presence of a mass, or hematuria are generally not sufficient for early diagnosis [4]. Additionally, radiological methods for RCC diagnosis such as ultrasound, computed tomography, magnetic resonance imaging, and positron emission tomography are not always accurate [5, 6]. Finally, renal biopsy and histological diagnosis are invasive and time-consuming. Therefore, the development of new diagnostic strategies is critical for the prevention and management of RCC.
Precision medicine is based on the premise that variations in genetics, lifestyle, and environment between individuals can be used for early diagnosis and personalized care, and has shown great potential for cancer diagnosis and treatment [7]. Omics-based approaches in which a comprehensive set of genes, proteins, or metabolites are measured can reveal biological phenotypes at omics levels. These technologies can significantly advance precision medicine [8]. Recently, omics-based methods have been used to predict and diagnose various cancers [9]. For example, genomics- and proteomics-based approaches have been shown to be important for RCC diagnosis and for predicting patient prognosis [10, 11]. Metabolomics is a relatively new approach in which all low molecular weight metabolites in biological samples are analyzed. This approach can provide valuable insight into metabolic changes that occur during disease processes (e.g., carcinogenesis). We previously used NMR-based metabolomics to analyze differences in the serum metabolome between RCC patients and healthy subjects [12]. We found that this approach could discriminate between RCC patients with and without metastases and before or after nephrectomy. More recently, differences in the plasma metabolome between RCC patients and healthy subjects were identified using a similar approach [13]. Finally, Lin et al. [14] reported that liquid chromatography-mass spectrometry (LC-MS)-based serum metabolomics could be used to diagnose and stage RCC.
Technologies for data-driven prediction and diagnosis, especially those based on ‘omics’ data, must be able to effectively extract essential information from large data sets. Machine learning is a branch of artificial intelligence that simulates human learning and classification processes [15]. In contrast to conventional statistical methods involving multivariate regression or correlation analysis, machine learning provides the opportunity to learn from past data and then use the knowledge to classify new data [15]. In this study, we aimed to develop a new tool for the prediction and diagnosis of early-stage RCC using NMR-based metabolomics and self-organizing maps (SOMs). We then used this method to predict and diagnose RCC in an additional group of blinded subjects. Finally, we evaluated change in metabolic patterns in RCC patients before and after nephrectomy, and examined patient quality of life 8 years post-nephrectomy.
RESULTS
Optimization of SOM architecture
The optimal results for the SOM architecture by genetic algorithm (GA) are shown in the bubble plot in Figure 1D. This plot demonstrates the relative frequency of selection in the GA and the mean value of the optimization criterion. Higher values for these two parameters were indicative of a better SOM architecture. Each bubble represents the SOM architecture, and the bubble size and color are proportional to the number of neurons and epochs, respectively. Considering model performance and structural complexity, a SOM architecture with 8 × 8 neurons and 350 epochs was selected as the optimal model for all metabolites, and 10 × 10 neurons and 50 epochs for a biomarker cluster.
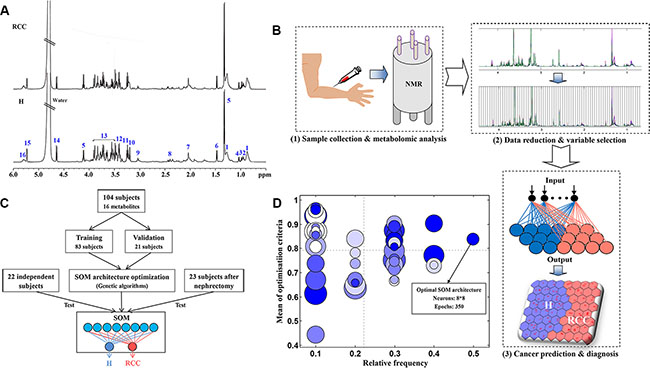
Figure 1: Development of the SOM model. (A) The 1H NMR spectra from human serum samples used for the development of the SOM. The numbers correspond to the metabolites in Table S1; (B) The procedure for RCC prediction and diagnosis using the SOM: (1) sample collection and metabolomics analysis, (2) data reduction and variable selection, and (3) cancer prediction and diagnosis. (C) The development of the SOM. First, the SOM architecture was optimized using genetic algorithms. Second, the optimized SOM was trained and validated using 80% and 20% of the subjects, respectively. Finally, 22 independent subjects were analyzed to further evaluate the trained SOM model, and 23 additional subjects analyzed to evaluate metabolic patterns after nephrectomy. (D) The bubble plot of SOM architecture optimization by genetic algorithms. Each bubble represents a type of SOM architecture. The size and color of the bubbles are proportional to the number of neurons and epochs in the SOM, respectively.
Identification of a biomarker cluster for the prediction and diagnosis of RCC
The cluster of subjects that was generated based on the SOM (including all 16 metabolites and their respective weight maps) is shown in Figure 2. Healthy subjects and RCC patients were clustered on the left and right regions of the SOM, respectively (Figure 2A). Higher levels of very low density lipoprotein (VLDL)/low density lipoprotein (LDL), isoleucine, leucine, valine, lactate, alanine, lipids plus N-acetyl cysteine (NAC), and creatine were concentrated on the side of the RCC patients, while higher choline levels were observed on the side of the healthy subjects. However, the weight map for several metabolites including glutamine, trimethylamine N-oxide (TMAO), taurine, sugars plus amino acids (AAs), α-glucose, β-glucose, and poly-UFA, did not show a pattern similar to that of the cluster of subjects on the SOM shown in Figure 2A. Heat map analysis revealed that creatine, lactate, isoleucine, leucine, alanine, and valine clustered together (Figure 3A). The correlation map also demonstrated a strong positive relationship between these six metabolites (Figure 3B). Moreover, there was a strong negative correlation between choline and the six metabolites. Both alanine and lactate levels were increased in RCC patients, which was indicative of an enhanced Warburg effect in the cancer cells (Figure 3C). The increased creatine, isoleucine, leucine, and valine levels in RCC patients as well as the reduced choline levels could be responsible for cell proliferation. Importantly, following nephrectomy, RCC patients exhibited metabolic recovery as indicated by decreases in creatine, lactate, isoleucine, leucine, alanine, and valine levels as well as an increase in choline levels (Figure 3D). Therefore, these seven metabolites are specific for RCC and could be used as a biomarker cluster for the prediction and early diagnosis RCC.
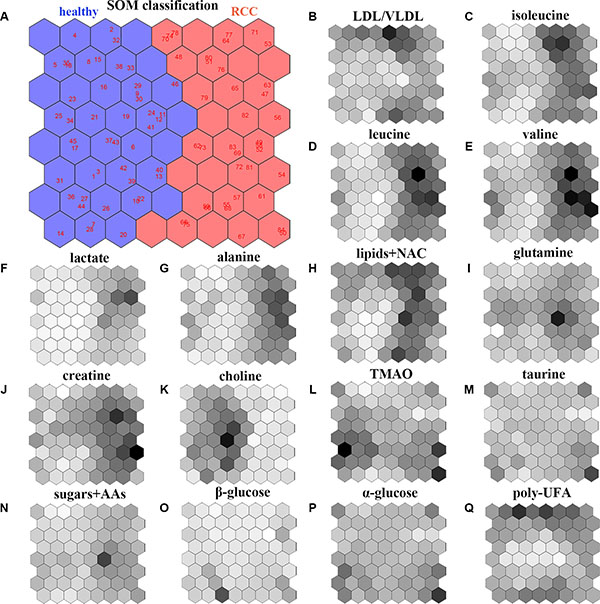
Figure 2: Analysis of the SOM model. (A) Classification and prediction of healthy subjects and RCC patients using the SOM model based on all 16 metabolites obtained from the NMR-based serum metabolome: left region, healthy subjects; right region, early-stage RCC patients. The weight map for the 16 metabolites in the SOM model: (B) LDL/VLDL; (C) isoleucine; (D) leucine; (E) valine; (F) lactate; (G) alanine; (H) lipids+NAC; (I) glutamine; (J) creatine; (K) choline; (L) TMAO; (M) taurine; (N) sugars+AAs; (O) β-glucose; (P) α-glucose; (Q) poly-UFA. The deeper the color the higher the weight in the SOM.
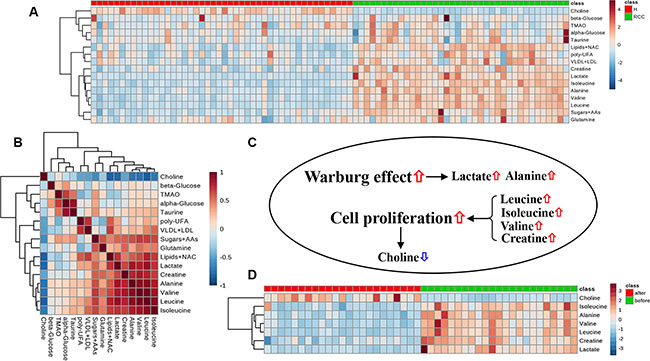
Figure 3: Metabolic data visualization. Heatmap (A) and correlation (B) analyses of all 16 metabolites obtained from the NMR-based serum metabolome. Cluster analysis was performed using Ward’s method and Euclidean distance. (C) Changes in metabolite levels in RCC patients and their biological effects in cancer cells. (D) Heat map analysis of seven metabolites as a biomarker cluster in RCC patients after nephrectomy.
Prediction and diagnosis of RCC using the SOM model and serum metabolome
The SOM (equipped with an optimal architecture) was trained on 80% of the subjects. The remaining 20% of the subjects were then used for validation of the trained SOM model. The predictive accuracy of the SOM model based on either all metabolites or the biomarker cluster is shown in Figure 4. A subject was classified into a category if the prediction score for the specific category was sufficiently high. In this study, we used a cutoff value of 0.80 to establish a diagnosis of RCC, which meant that if the SOM prediction score of a subject was below 0.80, the diagnosis was uncertain. Cut-off values are typically user-defined. We achieved a prediction accuracy of 93.48% for healthy subjects and 76.32% for RCC patients in the training set using all metabolites (Figure 4A). Using the biomarker cluster, we achieved a prediction accuracy of 91.30% in healthy subjects and 94.74% in RCC patients (Figure 4C). We next analyzed a set of 22 additional independent subjects in order to evaluate the predictive ability of the trained SOM model for RCC. There were two subjects who fell below the 0.80 prediction score in the test set when all metabolites were included (Figure 4B), while the trained SOM model using the biomarker cluster had higher predictive ability (Figure 4D). The detailed results for RCC prediction and diagnosis using the biomarker cluster are shown in Table 1. The results obtained using the SOM for the prediction and diagnosis of RCC were in agreement with the histological diagnosis for all subjects.
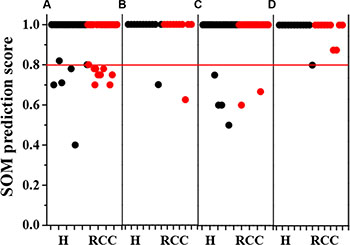
Figure 4: Accuracy of the SOM model in predicting early-stage RCC. The SOM model based on all 16 metabolites: (A) training set; (B) test set. The SOM model based on the biomarker cluster: (C) training set; (D) test set. Black and red points represent healthy subjects (N = 46 in the training set; N = 12 in the test set) and RCC patients (N = 38 in the training set; N = 10 in the test set), respectively. Red line represents a cutoff value of 0.80 for RCC diagnosis, suggesting that the diagnosis was uncertain only if the prediction score was below 0.80.
Table 1: Prediction and diagnosis of RCC using the SOM model and a biomarker cluster
Sample label |
SOM prediction score |
SOM prediction |
SOM diagnosis |
Histological diagnosis |
|
|---|---|---|---|---|---|
Ha |
RCCb |
||||
P1 |
1.00 |
0.00 |
H |
H |
H |
P2 |
1.00 |
0.00 |
H |
H |
H |
P3 |
1.00 |
0.00 |
H |
H |
H |
P4 |
1.00 |
0.00 |
H |
H |
H |
P5 |
1.00 |
0.00 |
H |
H |
H |
P6 |
1.00 |
0.00 |
H |
H |
H |
P7 |
1.00 |
0.00 |
H |
H |
H |
P8 |
1.00 |
0.00 |
H |
H |
H |
P9 |
1.00 |
0.00 |
H |
H |
H |
P10 |
1.00 |
0.00 |
H |
H |
H |
P11 |
1.00 |
0.00 |
H |
H |
H |
P12 |
0.80 |
0.20 |
H |
H |
H |
P13 |
0.00 |
1.00 |
RCC |
RCC |
RCC |
P14 |
0.00 |
1.00 |
RCC |
RCC |
RCC |
P15 |
0.00 |
1.00 |
RCC |
RCC |
RCC |
P16 |
0.00 |
1.00 |
RCC |
RCC |
RCC |
P17 |
0.00 |
1.00 |
RCC |
RCC |
RCC |
P18 |
0.00 |
1.00 |
RCC |
RCC |
RCC |
P19 |
0.13 |
0.87 |
RCC |
RCC |
RCC |
P20 |
0.13 |
0.87 |
RCC |
RCC |
RCC |
P21 |
0.00 |
1.00 |
RCC |
RCC |
RCC |
P22 |
0.00 |
1.00 |
RCC |
RCC |
RCC |
aHealthy; bRenal cell carcinoma.
Evaluation of metabolic patterns in RCC patients following nephrectomy
To evaluate changes in the metabolic patterns of RCC patients before and after nephrectomy, we analyzed a set of 23 RCC patients using the trained SOM model and biomarker cluster (Table 2). Prior to nephrectomy, all RCC patients were assigned to the RCC category, which was in agreement with the histological diagnoses. Interestingly, the trained SOM model using the biomarker cluster assigned all patients to the healthy group post-nephrectomy (Table 2). These data were indicative of metabolic recovery. However, the SOM prediction scores for three patients (A2, A5, and A11) were less than 0.80 (Table 2). Therefore, we could not definitively determine metabolic recovery in these patients. After 8 years, patient A5 suffered from renal failure, patient A11 died from RCC metastasis, and patient A2 was lost to follow-up. Follow-up was successful for 17 RCC patients 8 years post-nephrectomy, and 11 of the patients who displayed metabolic recovery remained healthy (Table 2).
Table 2: Prediction and diagnosis of RCC after nephrectomy using the SOM model and a biomarker cluster
Sample label |
SOM prediction score |
SOM prediction |
SOM diagnosis |
Histological diagnosis |
8-year follow-up |
|
|---|---|---|---|---|---|---|
Ha |
RCCb |
|||||
B1 |
0.00 |
1.00 |
RCC |
RCC |
RCC |
-c |
B2 |
0.00 |
1.00 |
RCC |
RCC |
RCC |
- |
B3 |
0.00 |
1.00 |
RCC |
RCC |
RCC |
- |
B4 |
0.00 |
1.00 |
RCC |
RCC |
RCC |
- |
B5 |
0.00 |
1.00 |
RCC |
RCC |
RCC |
- |
B6 |
0.00 |
1.00 |
RCC |
RCC |
RCC |
- |
B7 |
0.00 |
1.00 |
RCC |
RCC |
RCC |
- |
B8 |
0.00 |
1.00 |
RCC |
RCC |
RCC |
- |
B9 |
0.00 |
1.00 |
RCC |
RCC |
RCC |
- |
B10 |
0.00 |
1.00 |
RCC |
RCC |
RCC |
- |
B11 |
0.00 |
1.00 |
RCC |
RCC |
RCC |
- |
B12 |
0.00 |
1.00 |
RCC |
RCC |
RCC |
- |
B13 |
0.00 |
1.00 |
RCC |
RCC |
RCC |
- |
B14 |
0.00 |
1.00 |
RCC |
RCC |
RCC |
- |
B15 |
0.00 |
1.00 |
RCC |
RCC |
RCC |
- |
B16 |
0.00 |
1.00 |
RCC |
RCC |
RCC |
- |
B17 |
0.00 |
1.00 |
RCC |
RCC |
RCC |
- |
B18 |
0.12 |
0.88 |
RCC |
RCC |
RCC |
- |
B19 |
0.00 |
1.00 |
RCC |
RCC |
RCC |
- |
B20 |
0.00 |
1.00 |
RCC |
RCC |
RCC |
- |
B21 |
0.00 |
1.00 |
RCC |
RCC |
RCC |
- |
B22 |
0.00 |
1.00 |
RCC |
RCC |
RCC |
- |
B23 |
0.00 |
1.00 |
RCC |
RCC |
RCC |
- |
A1 |
1.00 |
0.00 |
H |
H |
- |
H |
A2 |
0.75 |
0.25 |
H |
- |
- |
LFd |
A3 |
1.00 |
0.00 |
H |
H |
- |
LF |
A4 |
1.00 |
0.00 |
H |
H |
- |
H |
A5 |
0.67 |
0.33 |
H |
- |
- |
RFe |
A6 |
0.80 |
0.20 |
H |
H |
- |
H |
A7 |
1.00 |
0.00 |
H |
H |
- |
DMf |
A8 |
0.80 |
0.20 |
H |
H |
- |
H |
A9 |
1.00 |
0.00 |
H |
H |
- |
H |
A10 |
1.00 |
0.00 |
H |
H |
- |
H |
A11 |
0.75 |
0.25 |
H |
- |
- |
DM |
A12 |
1.00 |
0.00 |
H |
H |
- |
LF |
A13 |
1.00 |
0.00 |
H |
H |
- |
H |
A14 |
0.83 |
0.17 |
H |
H |
- |
LF |
A15 |
0.83 |
0.17 |
H |
H |
- |
H |
A16 |
1.00 |
0.00 |
H |
H |
- |
H |
A17 |
1.00 |
0.00 |
H |
H |
- |
H |
A18 |
1.00 |
0.00 |
H |
H |
- |
H |
A19 |
0.83 |
0.17 |
H |
H |
- |
LF |
A20 |
1.00 |
0.00 |
H |
H |
- |
RF |
A21 |
0.80 |
0.20 |
H |
H |
- |
LF |
A22 |
1.00 |
0.00 |
H |
H |
- |
DM |
A23 |
1.00 |
0.00 |
H |
H |
- |
DM |
aHealthy; bRenal cell carcinoma; cNo data; dLost to follow-up; eRenal failure; fDeath from metastasis. A1-A23: RCC patients after nephrectomy; B1-B23: RCC patients before nephrectomy.
DISCUSSION
Early diagnosis plays a key role in cancer treatment. However, the early diagnosis of RCC is challenging because it is non-palpable and patients are generally asymptomatic. The diagnosis of RCC is established using radiological examination, renal biopsy, and histologic analysis [16]. Omics-based strategies including genomics [17–19], proteomics [20–24], and metabolomics [12–14, 25] have the potential to assist RCC prediction and diagnosis. Biomarkers indicative of physiological changes between normal and disease states are important for omics-based approaches to RCC diagnosis and treatment [26–28]. Moreover, approaches based on multiple biomarkers have improved the robustness of cancer prediction and diagnosis compared to single biomarker approaches in clinical trials [29]. In this study, we identified a biomarker cluster comprised of alanine, choline, creatine, lactate, isoleucine, leucine, and valine for the prediction and early diagnosis of RCC.
The most fundamental metabolic change in cancer cells is an increase in aerobic glycolysis known as the Warburg effect [30]. In normal cells, glucose is first metabolized to pyruvate via glycolysis, which then enters the TCA cycle. However, in cancer cells, pyruvate is transformed to lactate or alanine instead of entering the TCA cycle, even under sufficient oxygen conditions. We found that RCC patients had higher levels of lactate and alanine in serum compared to healthy subjects. In addition, up-regulation of branched-chain AAs and creatine production in cancer cells can provide substrates for energy and protein synthesis, which are required for cell proliferation [31]. Since choline is involved in the synthesis of cellular membranes, a decrease in choline level may be attributed to cell proliferation. The levels of these metabolites were reversed in RCC patients after nephrectomy indicating that they are highly specific for RCC.
Here, we developed a SOM method based on a biomarker cluster of seven metabolites to predict and diagnose early-stage RCC. Our method could be used to identify early-stage RCC patients with 94.74% accuracy. To test the generalizability of the approach, a set of 22 additional independent subjects was analyzed. All of the subjects in this independent cohort were classified into the correct diagnostic categories. The goal of precision medicine is to determine ‘the right treatment, for the right patient, at the right time’ [32]. The method we proposed here can be used to accurately predict and diagnose early-stage RCC, thereby providing effective guidance for treatment. Although other linear methods combined with metabolomics-based approaches may also enable RCC classification [12–14], our method is advantageous because it easily accommodates both the linear and nonlinear features of metabolic information. Most importantly, the SOM was able to learn and store new knowledge from new datasets (constant updating) [33]. A non-invasive omics-based diagnosis using blood samples will be a promising diagnostic tool for early-stage RCC.
We also used the proposed method to evaluate changes in the metabolic patterns of RCC patients before and after nephrectomy. According to the SOM prediction, metabolic recovery to normal patterns occurred in all RCC patients after nephrectomy. Using a diagnostic criterion of 0.80, only 3 of 23 RCC patients were not confidently assessed as metabolically recovered. Therefore, our method is also an effective tool for evaluating postoperative metabolic status. Both gene [34, 35] and protein [36] expression data have been used to predict RCC patient survival. In this study, 17 patients were successfully followed-up 8 years post-nephrectomy. Eleven of the patients who exhibited metabolic recovery remained healthy while two patients with prediction scores less than 0.80 suffered from renal failure or died from RCC metastasis. Thus, our method may also be capable of predicting RCC patient survival.
To our knowledge, this is the first approach based on a combination of an SOM and a biomarker cluster identified using serum metabolomics data for RCC prediction and early diagnosis. Although the number of samples was limited and further clinical evaluation is necessary, we believe that our method can be used as a diagnostic tool for early-stage RCC. Ultimately, this method could enable RCC diagnosis using a simple blood test. We will use this approach in our hospital as a reference for RCC diagnosis to improve the robustness and accuracy. Additionally, we plan to build a RCC metabolite database and establish a standard procedure for the predictive diagnosis of RCC.
MATERIALS AND METHODS
Sample collection
Blood samples were collected from 68 healthy subjects and 58 patients with early RCC after clinical examination between 2006 and 2007. Participants who were not treated with any medications for the previous 3 months fasted for 12 h and then had blood drawn (approximately 5 mL) from the antecubital vein. Serum samples were separated following centrifugation at 1,024 g for 10 min at 4ºC and stored at –80ºC until NMR metabolomics analysis. RCC was diagnosed by a pathological investigation and graded according to the Union for International Cancer Control (UICC) tumor-node-metastasis (TNM) staging system [37]. RCC without metastases (T1–2, limited to the kidney) was categorized as early-stage. The characteristics of all participants are shown in Table 3. Serum samples from 23 RCC patients were also collected 6 months after nephrectomy in order to evaluate changes in metabolic patterns. In 2015, an 8-year follow-up was conducted by phone to examine RCC patient quality of life after nephrectomy. This study was approved by the Ethics Committee of Shanghai Jiao Tong University School of Medicine.
Table 3: Participant characteristics
Case |
Na |
TNM featureb |
Gender (male) |
Age (years) |
|---|---|---|---|---|
Healthy |
68 |
- |
34 |
52.5 ± 15.1 |
RCCc (without metastasis) |
58 |
T1a (N = 20): < 4 cm, limited to the kidney |
8 |
53.0 ± 11.5 |
T1b (N = 20): 4–7 cm, limited to the kidney |
10 |
52.3 ± 12.9 |
||
T2 (N = 18): > 7 cm, limited to the kidney |
12 |
58.7 ± 9.4 |
||
Nephrectomy |
23 |
T1 (N = 13) T2 (N = 10) |
18 |
53.3 ± 10.1 |
aNumber of subjects; bRefer to Edge et al. [37]; cRenal cell carcinoma.
NMR-based metabolomics analysis
Serum samples were thawed and vortexed, and 200 μL aliquots mixed with 400 μL of 0.2 M phosphate buffer to minimize pH variations. The mixture was centrifuged at 12,000 g for 10 min at 4°C, and 500 μL of the supernatant mixed with 100 μL D2O (field frequency lock) in a 5 mm NMR tube for NMR analysis. Proton NMR spectra were acquired at 25°C using a Varian Unity INOVA 600 NMR spectrometer with a triple resonance probe and z-axis pulsed field gradient (Bruker BioSpin, Rheinstetten, Germany). Standard one-dimensional (1D) PRESAT spectra were recorded using a single 90° pulse sequence and 1D spin-echo spectra acquired using the CPMG pulse sequence. The main acquisition parameters included: data points, 32 K; relaxation delay, 4 sec; spectral width, 10,000 Hz; acquisition time, 1.64 sec per scan; exponential line-broadening function, 0.3 Hz.
NMR spectra were preprocessed using phase and baseline corrections in the Topspin 3.0 software (Bruker BioSpin, Rheinstetten, Germany). NMR spectra were then referenced to the methyl signal of lactate at 1.33 ppm. The ‘icoshift’ procedure was performed to align all NMR spectra in MATLAB (R2012a, Mathworks Inc., Natick, MA, USA) [17, 38]. For dimensionality reduction, the spectral region from 0.4–10.0 ppm excluding the residual water signals from 4.4–5.2 ppm was subdivided and integrated to binned data with a size of 0.04 ppm. The NMR signals were carefully evaluated to exclude poorly aligned peaks and merged peaks derived from the same metabolites. The 1H NMR spectra from human serum samples are shown in Figure 1A. A total of 16 metabolite signals were prepared and assigned as shown in Table S1 based on previously reported data [39, 40] and the human metabolome database [41]. Two-dimensional 1H-1H COSY and TOCSY experiments for several representative samples were performed in order to confirm the assignments.
SOM development
A SOM is a type of artificial neural network [33] that can learn from complex and high-dimensional data and project the information into a two-dimensional visual map. The SOM theory is derived from simulations of human brain function. For example, various sensory impressions have been mapped within the brain via neuronal systems. Here, a SOM was developed to predict and diagnose early-stage RCC based on serum metabolomics (Figure 1B). The procedure for SOM development is shown in Figure 1C. All data were auto-scaled and randomly divided into two subsets: a training set (80%) and validation set (20%). Next, genetic algorithms were used to optimize the most suitable the SOM architecture, which included the number of neurons and epochs [42] (Figure 1D). A hexagonal topology and cross-validation with venetian blinds (n = 10) were selected. The number of neurons and epochs was set from 4–16 and 50–400, respectively, for optimization. The optimal SOM architecture was then trained and validated using 80% and 20% of the subjects, respectively. An independent cohort consisting of 22 subjects was used to test the predictive capability of the trained SOM model for early RCC. Finally, postoperative changes in metabolic patterns before and after nephrectomy were evaluated in an additional cohort of 23 RCC patients. The SOM was developed using the Kohonen and CP-ANN toolbox [43] in MATLAB (R2012a, Mathworks Inc., Natick, MA, USA). In addition, heat map and correlation analyses were performed using MetaboAnalyst 3.0 [44].
ACKNOWLEDGMENTS
This work was supported by the National Natural Science Foundation of China (Nos. 21575105, 81503335, and 81501303), and the Zhejiang Provincial Natural Science Foundation (Nos. LY14H090014 and LY15H180010).
CONFLICTS OF INTEREST
The authors declare that they have no conflicts of interest.
Authors’ contributions
HCG, BJD, YRH, JSJ and HZ designed the experiments. AS and BJD performed the histological diagnosis, sample collection, and follow-up. LCZ, MJC and LLP contributed to the acquisition of the metabolomics data. HZ, HCG and HJZ analyzed the data, developed the models, interpreted the results, and wrote the manuscript. All the authors read, revised, and approved the final manuscript.
REFERENCES
1. Rini BI, Campbell SC, Escudier B. Renal cell carcinoma. Lancet. 2009; 373:1119–1132.
2. Znaor A, Lortet-Tieulent J, Laversanne M, Jemal A, Bray F. International variations and trends in renal cell carcinoma incidence and mortality. Eur Urol. 2015; 67:519–530.
3. Weiss RH, Lin PY. Kidney cancer: identification of novel targets for therapy. Kidney Int. 2006; 69:224–232.
4. Feldstein MS, Rhodes DJ, Parker AS, Orford RR, Castle EP. The haphazard approach to the early detection of asymptomatic renal cancer: results from a contemporary executive health programme. BJU Int. 2009; 104:53–56.
5. Lechevallier E, André M, Barriol D, Daniel L, Eghazarian C, De Fromont M, Rossi D, Coulange C. Fine-needle percutaneous biopsy of renal masses with helical CT guidance 1. Radiology. 2000; 216:506–510.
6. Dechet CB, Zincke H, Sebo TJ, King BF, Leroy AJ, Farrow GM, Blute ML. Prospective analysis of computerized tomography and needle biopsy with permanent sectioning to determine the nature of solid renal masses in adults. J Urol. 2003; 169:71–74.
7. Friedman AA, Letai A, Fisher DE, Flaherty KT. Precision medicine for cancer with next-generation functional diagnostics. Nat Rev Cancer. 2015; 15:747–756.
8. Chen R, Snyder M. Promise of personalized omics to precision medicine. Wiley Interdiscip Rev Syst Biol Med. 2013; 5:73–82.
9. Moshkovskii S, Pyatnitsky M, Lokhov P, Baranova A. OMICS for tumor biomarker research. Biomark Cancer. 2015; 3–30.
10. Jones J, Pantuck AJ. Genomics and proteomics in renal cell carcinoma: diagnosis, prognosis, and treatment selection. Curr Urol Rep. 2008; 9:9–14.
11. Zacchia M, Vilasi A, Capasso A, Morelli F, de Vita F, Capasso G. Genomic and proteomic approaches to renal cell carcinoma. J Nephrol. 2011; 24:155–164.
12. Gao H, Dong B, Liu X, Xuan H, Huang Y, Lin D. Metabonomic profiling of renal cell carcinoma: high-resolution proton nuclear magnetic resonance spectroscopy of human serum with multivariate data analysis. Anal Chim Acta. 2008; 624:269–277.
13. Zira AN, Theocharis SE, Mitropoulos D, Migdalis V, Mikros E. 1H NMR metabonomic analysis in renal cell carcinoma: a possible diagnostic tool. J Proteome Res. 2010; 9:4038–4044.
14. Lin L, Huang Z, Gao Y, Yan X, Xing J, Hang W. LC-MS based serum metabonomic analysis for renal cell carcinoma diagnosis, staging, and biomarker discovery. J Proteome Res. 2011; 10:1396–1405.
15. Cruz JA, Wishart DS. Applications of machine learning in cancer prediction and prognosis. Cancer Inform. 2006; 2:59.
16. Ljungberg B, Cowan NC, Hanbury DC, Hora M, Kuczyk MA, Merseburger AS, Patard JJ, Mulders PF, Sinescu IC. EAU guidelines on renal cell carcinoma: the 2010 update. Eur Urol. 2010; 58:398–406.
17. Furge KA, Lucas KA, Takahashi M, Sugimura J, Kort EJ, Kanayama HO, Kagawa S, Hoekstra P, Curry J, Yang XJ, Teh BT. Robust classification of renal cell carcinoma based on gene expression data and predicted cytogenetic profiles. Cancer Res. 2004; 64:4117–4121.
18. Arai E, Ushijima S, Tsuda H, Fujimoto H, Hosoda F, Shibata T, Kondo T, Imoto I, Inazawa J, Hirohashi S, Kanai Y. Genetic clustering of clear cell renal cell carcinoma based on array-comparative genomic hybridization: its association with DNA methylation alteration and patient outcome. Clin Cancer Res. 2008; 14:5531–5539.
19. Wulfken LM, Moritz R, Ohlmann C, Holdenrieder S, Jung V, Becker F, Herrmann E, Walgenbach-Brünagel G, von Ruecker A, Müller SC, Ellinger J. MicroRNAs in renal cell carcinoma: diagnostic implications of serum miR-1233 levels. PloS One. 2011; 6:e25787.
20. White NM, Masui O, DeSouza LV, Krakovska O, Metias S, Romaschin AD, Honey RJ, Stewart R, Pace K, Lee J, Jewett MA, Bjarnason GA, Siu KW, et al. Quantitative proteomic analysis reveals potential diagnostic markers and pathways involved in pathogenesis of renal cell carcinoma. Oncotarget. 2014; 5:506–518. doi: 10.18632/oncotarget.1529.
21. Won Y, Song HJ, Kang TW, Kim JJ, Han BD, Lee SW. Pattern analysis of serum proteome distinguishes renal cell carcinoma from other urologic diseases and healthy persons. Proteomics. 2003; 3:2310–2316.
22. Rogers MA, Clarke P, Noble J, Munro NP, Paul A, Selby PJ, Banks RE. Proteomic profiling of urinary proteins in renal cancer by surface enhanced laser desorption ionization and neural-network analysis identification of key issues affecting potential clinical utility. Cancer Res. 2003; 63:6971–6983.
23. Chinello C, Gianazza E, Zoppis I, Mainini V, Galbusera C, Picozzi S, Rocco F, Galasso G, Bosari S, Ferrero S, Perego R, Raimondo F, Bianchi C, et al. Serum biomarkers of renal cell carcinoma assessed using a protein profiling approach based on ClinProt technique. Urology. 2010; 75:842–847.
24. Huang Z, Zhang S, Hang W, Chen Y, Zheng J, Li W, Xing J, Zhang J, Zhu E, Yan X. Liquid chromatography–mass spectrometry based serum peptidomic approach for renal clear cell carcinoma diagnosis. J Pharm Biomed Anal. 2014; 100:175–183.
25. Kim K, Aronov P, Zakharkin SO, Anderson D, Perroud B, Thompson IM, Weiss RH. Urine metabolomics analysis for kidney cancer detection and biomarker discovery. Mol Cell Proteomics. 2009; 8:558–570.
26. Maroto P, Rini B. Molecular biomarkers in advanced renal cell carcinoma. Clin Cancer Res. 2014; 20:2060–2071.
27. Rini BI, Campbell SC. Urinary biomarkers for the detection and management of localized renal cell carcinoma. JAMA Oncology. 2015; 1:212–213.
28. Sanchez-Espirdion B, Tannir NM, Matin SF, Karam JA, Huang M, Wood CG, Wu X, Gu J. Detection of recurrent renal cell carcinoma biomarkers by metabolite ratios. Cancer Res. 2015; 75:1827.
29. Rodríguez-Enríquez S, Pacheco-Velázquez SC, Gallardo-Pérez JC, Marín-Hernández A, Aguilar-Ponce JL, Ruiz-García E, Ruizgodoy-Rivera LM, Meneses-García A, Moreno-Sánchez R. Multi-biomarker pattern for tumor identification and prognosis. J Cell Biochem. 2011; 112:2703–2715.
30. Bensinger SJ, Christofk HR. New aspects of the Warburg effect in cancer cell biology. Semin Cell Dev Biol. 2012; 23:352–361.
31. Connell TM. The complex role of branched chain amino acids in diabetes and cancer. Metabolites. 2013; 3:931–945.
32. Collins FS, Varmus H. A new initiative on precision medicine. N Eng J Med. 2015; 372:793–795.
33. Kohonen T. Self-organized formation of topologically correct feature maps. Biol Cybern. 1982; 43:59–69.
34. Zhao H, Ljungberg B, Grankvist K, Rasmuson T, Tibshirani R, Brooks JD. Gene expression profiling predicts survival in conventional renal cell carcinoma. PloS Med. 2006; 3:e13.
35. Büttner F, Winter S, Rausch S, Reustle A, Kruck S, Junker K, Stenzl A, Agaimy A, Hartmann A, Bedke J, Schwab M, Schaeffeler E. Survival prediction of clear cell renal cell carcinoma based on gene expression similarity to the proximal tubule of the nephron. Eur Urol. 2015; 68:1016–1020.
36. Kim HL, Seligson D, Liu X, Janzen N, Bui MH, Yu H, Shi T, Figlin RA, Horvath S, Belldegrun AS. Using protein expressions to predict survival in clear cell renal carcinoma. Clin Cancer Res. 2004; 10:5464–5471.
37. Edge SB, Byrd DR, Compton CC. AJCC Cancer Staging Handbook, 7th edition. New York, NY: Springer 2010.
38. Savorani F, Tomasi G, Engelsen SB. icoshift: a versatile tool for the rapid alignment of 1D NMR spectra. J Magn Reson. 2009, 202:190–202.
39. Nicholson JK, Foxall PJ, Spraul M, Farrant RD, Lindon JC. 750 MHz 1H and 1H-13C NMR spectroscopy of human blood plasma. Anal Chem. 1995; 67:793–811.
40. Psychogios N, Hau DD, Peng J, Guo AC, Mandal R, Bouatra S, Sinelnikov I, Krishnamurthy R, Eisner R, Gautam B, Young N, Xia J, Knox C, et al. The human serum metabolome. PloS One. 2011; 6:e16957.
41. Wishart DS, Jewison T, Guo AC, Wilson M, Knox C, Liu Y, Djoumbou Y, Mandal R, Aziat F, Dong E, Bouatra S, Sinelnikov I, Arndt D, et al. HMDB 3.0-the human metabolome database in 2013. Nucleic Acids Res. 2013; 41:801–807.
42. Ballabio D, Vasighi M, Consonni V, Kompany-Zareh M. Genetic algorithms for architecture optimisation of counter-propagation artificial neural networks. Chemom Intell Lab Syst. 2011; 105:56–64.
43. Ballabio D, Consonni V, Todeschini R. The Kohonen and CP-ANN toolbox: a collection of Matlab modules for self organizing maps and counterpropagation artificial neural networks. Chemometr Intell Lab Syst. 2009; 98:115–122.
44. Xia JG, Sinelnikov IV, Beomsoo H, Wishart DS. Metaboanalyst 3.0-making metabolomics more meaningful. Nucleic Acids Res. 2015; 43:251–257.