
Introduction
The mammalian target of rapamycin (mTOR, also known as FRAP1), a key downstream effector of the phosphatidylinositol-3-kinase (PI3K)/AKT signaling pathway, regulates several cellular processes that are critical for oncogenesis, such as cell proliferation, apoptosis, migration, metabolism, and angiogenesis [1-4]. Deregulation of the PI3K pathway is one of the most frequent alterations occurring in human cancer [5]. Unsurprisingly, aberrant expression of mTOR, including both over-expression and over-activation, has been observed in lung adenocarcinoma, hepatocellular cancer, large intestine adenocarcinoma, renal cell carcinoma, and extrahepatic cholangiocarcinoma [6-10]. These changes may be caused by genetic alterations [11], and single nucleotide polymorphisms (SNPs) widespread in the human genome [12], have been extensively studied in mTOR to identify susceptibility loci for cancer.
Human mTOR , located on chromosome 1p36.2, is approximately 156 kb in length and is composed of 59 exons. According to the International HapMap Project Database (http://hapmap.ncbi.nlm.nih.gov/), 181 SNPs in mTOR have been reported in different populations, including those from Utah (US residents with ancestry from Europe; CEU), China (Han Chinese in Beijing; CHB), Japan (Japanese in Tokyo; JPT), and Nigeria (Yoruba in Ibadan; YRI). These 181 SNPs are distributed throughout mTOR, as well as 5kb upstream and downstream of the gene. Of these, 129 are considered common based on a minor allele frequency ≥ 5%, including seven SNPs in the 5′ upstream region, five SNPs in exonic regions, 112 in intronic regions, and five in the 3′ untranslated region (UTR) and downstream region.
Since Slattery et al. [13] first reported a positive association between mTOR rs1057079 and colon cancer risk in 2010, clinical evidence has accumulated regarding the relationship between mTOR SNPs and the risk of various cancers, such as gastric cancer [14-18], esophageal carcinoma [19, 20], endometrial cancer [21], renal cell cancer [10, 22], acute leukemia [23, 24], and colorectal cancer [25]. Previously, Shao et al. [26] performed a meta-analysis pooling the data from six case-control studies and indicated an association between rs2295080 in the promoter region of mTOR and cancer risk. Since then, eight case-control studies (six original articles and two abstracts) [16-18, 20, 24, 25, 27, 28] have been published that reveal more potentially functional mTOR SNPs and challenge conclusions from previous meta-analyses. The evidence is controversial for those mTOR SNPs investigated, partially because of insufficient statistical power. Consequently, we performed this updated meta-analysis to reassess the effect of mTOR polymorphisms within oncogenesis and to provide a more precise estimation of the associations.
Results
Characteristics of eligible studies
The selection process for eligible studies is shown in the flow diagram (Figure 1). A total of 23 case-control studies matched the inclusion criteria [10, 13-25, 27-30, 49, 53, 54, 73, 74], including one that discussed the relationship between mTOR polymorphisms and meningioma [28], which is generally considered to be benign. The main characteristics and results of the eligible studies are presented in Supplementary Material. Seven SNPs (rs2536, rs2295080, rs1883965, rs1034528, rs17036508, rs3806317, and rs1064261) included in the final meta-analysis were analyzed in at least two series and were described in 14 studies (one article examined the association in independent populations of childhood acute lymphoblastic leukemia and acute myeloid leukemia, so this was treated as two separate studies). Of the 14 studies, four focused on gastric cancer [14, 15, 17, 18], three on childhood acute leukemia [23, 24], two on prostate cancer [29, 30], two on esophageal carcinoma [19, 20], and one each on hepatocellular carcinoma [31], renal cell cancer [10] and colorectal cancer [25]. All studies were conducted in Asian populations, and genotype distributions among controls were consistent with Hardy-Weinberg equilibrium (HWE). Newcastle-Ottawa Scale (NOS) scores of these studies were higher than 6 (moderate-high quality). Detailed information on the studies included in the meta-analysis is provided in Table 1.
Table 1: Main characteristics of studies included in the meta-analysis
First author |
Year |
Cancer type |
Ethnicity |
Source of |
Sample size |
Polymorphism |
Quality score |
Selection |
Comparability |
Exposure |
(Country) |
control |
(case/control) |
||||||||
Cao, Q. [10] |
2012 |
Renal cell cancer |
Asian(China) |
HB |
710/760 |
rs2536, rs2295080 |
8 |
3 |
2 |
3 |
Chen, J. [29] |
2012 |
Prostate cancer |
Asian(China) |
HB |
666/708 |
rs2536, rs2295080 |
7 |
3 |
1 |
3 |
Huang, L. [23] |
2012 |
ALL |
Asian(China) |
HB |
417/554 |
rs2536, rs2295080 |
7 |
3 |
2 |
2 |
He, J. [14] |
2013 |
Gastric cancer |
Asian(China) |
PB |
1125/1196 |
rs2536, rs1883965 |
7 |
3 |
1 |
3 |
Xu, M. [15] |
2013 |
Gastric cancer |
Asian(China) |
HB |
753/854 |
rs2295080 |
6 |
3 |
1 |
2 |
Mao, L. Q. [49] |
2013 |
Hepatocellular carcinoma |
Asian(China) |
HB |
1048/1052 |
rs2536, rs1883965 |
7 |
3 |
2 |
2 |
Zhu, M. L. [19] |
2013 |
Esophageal carcinoma |
Asian(China) |
PB |
1123/1121 |
rs2536, rs1883965 |
8 |
4 |
1 |
3 |
Li, Q. [30] |
2013 |
Prostate cancer |
Asian(China) |
PB |
1004/1051 |
rs2536, rs2295080, rs1883965, rs1034528, rs17036508, rs3806317 |
9 |
4 |
2 |
3 |
Xu, M. [25] |
2015 |
Colorectal cancer |
Asian(China) |
HB |
737/777 |
rs2295080 |
7 |
3 |
1 |
3 |
Zhu,J.H. [20] |
2015 |
Esophageal carcinoma |
Asian(China) |
PB |
1116/1117 |
rs2295080, rs1064261 |
7 |
4 |
1 |
2 |
Piao, Y. [17] |
2015 |
Gastric cancer |
Asian(China) |
PB |
483/673 |
rs1064261 |
6 |
3 |
0 |
3 |
Wang,M.Y. [18] |
2015 |
Gastric cancer |
Asian(China) |
HB |
1002/1003 |
rs2295080, rs1034528, rs17036508, rs3806317 |
6 |
3 |
1 |
2 |
Zhao, P. [24] |
2015 |
ALL&AML |
Asian(China) |
HB |
180/296 |
rs2295080 |
6 |
2 |
1 |
3 |
Abbreviations: ALL, acute lymphoblastic leukemia; AML, acute myeloid leukemia; HB, hospital based; PB, population based.
Meta-analysis of mTOR rs2536
Seven studies, consisting of 6093 cases and 6442 controls, investigated the association between SNP rs2536 and cancer risk. We carried out a meta-analysis of rs2536 overall and in different cancer types under various genetic models. The seven studies were homogenous for OR1 and OR3, but heterogeneity was significant for OR2 (I2 = 62.4%, phet = 0.014). After excluding Li’s study [30], which seemed to be the main source of heterogeneity according to sensitivity analysis, the remaining six studies were homogenous for OR1, OR2, and OR3. rs2536 OR1, OR2, and OR3 were 1.61 (P = 0.501), 0.97 (P = 0.504), and 1.20 (P = 0.422), respectively, suggesting a recessive effect of allele C. Therefore, the TC and TT genotypes were combined and compared with the CC genotype. A non-significant increase in cancer risk for the CC genotype was found (fixed-effect OR = 1.17, 95% CI 0.76-1.80, P = 0.485).
Three studies focusing on genitourinary cancers (prostate cancer and renal cell cancer) were homogenous for OR1 and OR3, but heterogeneity was significant for OR2 (I2 = 84.8%, phet = 0.001), which discouraged us from calculating an overall estimate. Digestive system cancers (esophageal carcinoma, gastric cancer and hepatocellular carcinoma) investigated in three studies were homogenous for OR1, OR2, and OR3, but still no significant association was observed. Accordingly, it appeared that rs2536 had no significant effect on susceptibility to cancer (Table 2).
Table 2: Non-significant meta-analysis results of the association between mTOR polymorphisms and cancer risk
No.of studies |
OR(95%CI) |
P |
I2(%) |
Phet |
Model |
|
rs2536 |
||||||
Total |
7(6093/6442) |
|||||
CC vs.TT |
1.11(0.75,1.64) |
0.613 |
0 |
0.921 |
Fixed-effects model |
|
TC vs.TT |
1.01(0.86,1.18) |
0.902 |
62.4 |
0.014 |
Random-effects model |
|
CC vs.TC |
1.06(0.71,1.59) |
0.764 |
0 |
0.667 |
Fixed-effects model |
|
Excluding Li’s study |
6(5089/5391) |
|||||
CC vs.TT |
1.16(0.75, 1.79) |
0.501 |
0 |
0.884 |
Fixed-effects model |
|
TC vs.TT |
0.97(0.87,1.07) |
0.504 |
20.4 |
0.28 |
Fixed-effects model |
|
CC vs.TC |
1.20(0.77,1.87) |
0.422 |
0 |
0.77 |
Fixed-effects model |
|
CC vs.CT/TT |
1.17(0.76, 1.80) |
0.485 |
0 |
0.869 |
Fixed-effects model |
|
Genitourinary cancers |
3(2380/2519) |
|||||
CC vs.TT |
1.01(0.52, 1.98) |
0.966 |
0 |
0.901 |
Fixed-effects model |
|
TC vs.TT |
1.00(0.67, 1.49) |
0.991 |
84.8 |
0.001 |
Random-effects model |
|
CC vs.TC |
0.93(0.47, 1.82) |
0.824 |
0 |
0.472 |
Fixed-effects model |
|
Digestive system cancers |
3(3296/3369) |
|||||
CC vs.TT |
1.03(0.61, 1.74) |
0.927 |
0 |
0.905 |
Fixed-effects model |
|
CT vs.TT |
1.06(0.93, 1.21) |
0.378 |
0 |
0.677 |
Fixed-effects model |
|
CC vs.CT |
0.98(0.57, 1.68) |
0.94 |
0 |
0.974 |
Fixed-effects model |
|
CC vs.CT/TT |
1.02(0.60, 1.72) |
0.947 |
0 |
0.918 |
Fixed-effects model |
|
rs3806317 |
||||||
Total |
2(2006/2054) |
|||||
GG vs.AA |
0.79(0.50, 1.26) |
0.326 |
0 |
0.358 |
Fixed-effects model |
|
GA vs.AA |
1.07(0.82, 1.40) |
0.61 |
70.8 |
0.064 |
Random-effects model |
|
GG vs.GA |
0.73(0.45, 1.17) |
0.187 |
0 |
0.73 |
Fixed-effects model |
|
rs1064261 |
||||||
Total |
2(1599/1790) |
|||||
CC vs.TT |
0.90(0.38, 2.15) |
0.82 |
0 |
0.556 |
Fixed-effects model |
|
TC vs.TT |
1.14(0.95, 1.37) |
0.171 |
8.7 |
0.295 |
Fixed-effects model |
|
CC vs.TC |
0.82(0.34, 1.99) |
0.665 |
0 |
0.417 |
Fixed-effects model |
|
TC vs.CC/TT |
1.14(0.95, 1.37) |
0.168 |
11.9 |
0.287 |
Fixed-effects model |
|
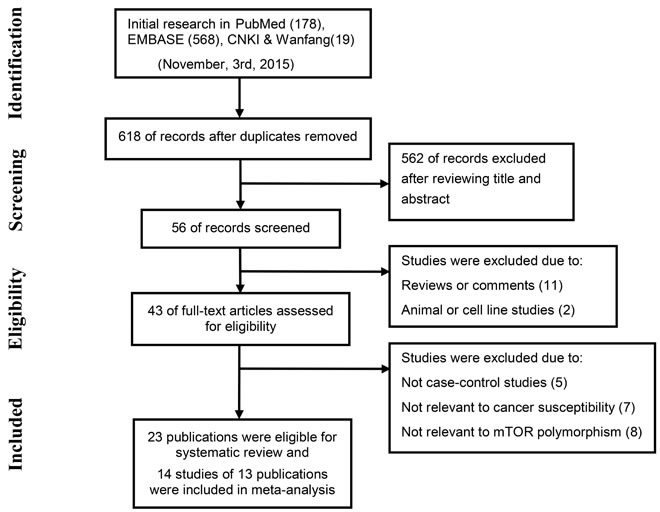
Figure 1: The flow chart shows study selection for this systematic review.
Meta-analysis of mTOR rs2295080
Ten studies, consisting of 6585 cases and 7120 controls, investigated the association between SNP rs2295080 and cancer risk. These studies were heterogeneous for OR1 (I2 = 67.7%, phet = 0.001), OR2 (I2 = 65.5%, phet = 0.002) and OR3 (I2 = 49.9%, phet = 0.035). We failed to remove heterogeneity by excluding outliers identified by sensitivity analysis, so studies were grouped by cancer type to explore some possible major sources of heterogeneity (Table 3).
Three studies focusing on genitourinary cancers (prostate cancer and renal cell cancer) were homogenous for OR1, OR2, and OR3, which were 0.76 (P = 0.045), 0.77 (P < 0.001), and 0.99 (P = 0.955), respectively, suggesting a dominant effect of the G allele. Therefore compared with the TT genotype, carriers of the G allele (GG and TG genotypes) were shown to have a significantly reduced cancer risk (fixed-effect OR = 0.77, 95% CI 0.68-0.86, P < 0.001) (Figure 2). Digestive system cancers (esophageal carcinoma, gastric cancer and colorectal cancer) were investigated in four studies. While these were homogenous for OR3, heterogeneity was significant for OR1 (I2 = 59.6%, phet = 0.059) and OR2 (I2 = 76.3%, phet = 0.005). Consequently, there was no indication to pool the estimates. Childhood acute leukemia (acute lymphoblastic leukemia and acute myeloid leukemia), a non-solid cancer, was investigated in three studies, which appeared homogeneous and suggested a recessive model (GG versus GT/TT: fixed-effect OR = 2.08, 95% CI 1.34-3.22, P = 0.001) (Figure 3) (Table 3).
Table 3: Significant meta-analysis results of the association between mTOR polymorphisms and cancer risk
No.of studies |
OR(95%CI) |
P |
I2(%) |
Phet |
Model |
|
rs2295080 |
||||||
Total |
||||||
GG vs.TT |
0.97(0.73, 1.31) |
0.86 |
67.7 |
0.001 |
Random-effects model |
|
TG vs.TT |
0.91(0.80, 1.04) |
0.151 |
65.5 |
0.002 |
Random-effects model |
|
GG vs.TG |
1.04(0.81, 1.32) |
0.774 |
49.9 |
0.035 |
Random-effects model |
|
Genitourinary cancers |
3(2380/2519) |
|||||
GG vs.TT |
0.76(0.59, 0.99) |
0.045 |
0 |
0.934 |
Fixed-effects model |
|
TG vs.TT |
0.77(0.68, 0.87) |
<0.001 |
0 |
0.99 |
Fixed-effects model |
|
GG vs.TG |
0.99(0.76, 1.30) |
0.955 |
0 |
0.92 |
Fixed-effects model |
|
TG/GG vs.TT |
0.77(0.68, 0.86) |
<0.001 |
0 |
0.996 |
Fixed-effects model |
|
Digestive system cancers |
4(3608/3751) |
|||||
GG vs.TT |
0.78(0.54, 1.11) |
0.169 |
59.6 |
0.059 |
Random-effects model |
|
TG vs.TT |
0.97(0.80, 1.19) |
0.785 |
76.3 |
0.005 |
Random-effects model |
|
GG vs.TG |
0.81(0.64, 1.02) |
0.073 |
0 |
0.586 |
Fixed-effects model |
|
Acute leukemia |
3(597/850) |
|||||
GG vs.TT |
2.12(1.36, 3.30) |
0.001 |
25.1 |
0.263 |
Fixed-effects model |
|
TG vs.TT |
1.06(0.86, 1.33) |
0.578 |
0 |
0.691 |
Fixed-effects model |
|
GG vs.TG |
2.00(1.26, 3.17) |
0.003 |
37.5 |
0.202 |
Fixed-effects model |
|
GG vs.GT/TT |
2.08(1.34, 3.22) |
0.001 |
33 |
0.225 |
Fixed-effects model |
|
rs1883965 |
||||||
Total |
4(4300/4420) |
|||||
AA vs.GG |
0.91(0.54, 1.54) |
0.733 |
49.6 |
0.114 |
Fixed-effects model |
|
GA vs.GG |
1.15(1.02, 1.29) |
0.019 |
0 |
0.484 |
Fixed-effects model |
|
AA vs.GA |
0.79(0.46, 1.36) |
0.399 |
41.3 |
0.164 |
Fixed-effects model |
|
GA vs.GG/AA |
1.15(1.02, 1.29) |
0.018 |
0 |
0.514 |
Fixed-effects model |
|
Digestive system cancers |
3(3296/3369) |
|||||
AA vs.GG |
0.77(0.24, 2.46) |
0.059 |
65.2 |
0.056 |
Random-effects model |
|
GA vs.GG |
1.18(1.03, 1.35) |
0.014 |
0 |
0.415 |
Fixed-effects model |
|
AA vs.GA |
0.66(1.23, 1.91) |
0.447 |
56.5 |
0.1 |
Random-effects model |
|
rs1034528 |
||||||
Total |
2(2006/2054) |
|||||
CC vs.GG |
0.95(0.66,1.38) |
0.791 |
0 |
0.484 |
Fixed-effects model |
|
GC vs.GG |
1.30(1.13, 1.48) |
<0.001 |
0 |
0.892 |
Fixed-effects model |
|
CC vs.GC |
0.73(0.50, 1.07) |
0.109 |
0 |
0.526 |
Fixed-effects model |
|
GC vs.GG/CC |
1.30(1.13, 1.48) |
<0.001 |
0 |
0.951 |
Fixed-effects model |
|
rs17036508 |
||||||
Total |
2(2006/2054) |
|||||
CC vs.TT |
0.99(0.64, 1.55) |
0.975 |
0 |
0.808 |
Fixed-effects model |
|
TC vs.TT |
1.23(1.06, 1.43) |
0.006 |
0 |
0.959 |
Fixed-effects model |
|
CC vs.TC |
0.81(0.51, 1.28) |
0.36 |
0 |
0.8 |
Fixed-effects model |
|
TC vs.CC/TT |
1.23(1.06, 1.43) |
0.006 |
0 |
0.945 |
Fixed-effects model |
|
The results are in bold if P < 0.05.
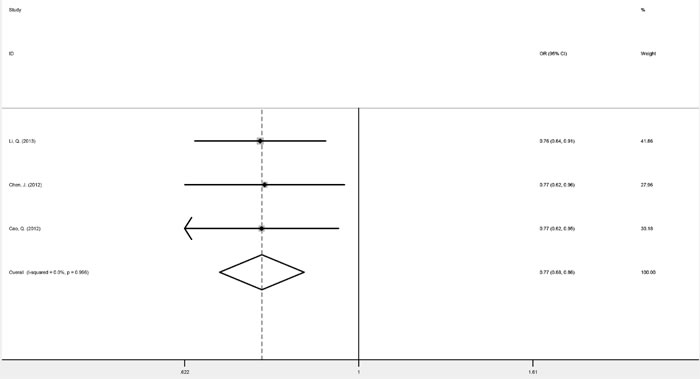
Figure 2: Forest plots of fixed-effects ORs for mTOR rs2295080 and risk of genitourinary cancers based on a dominant model (TG/GG versus TT).
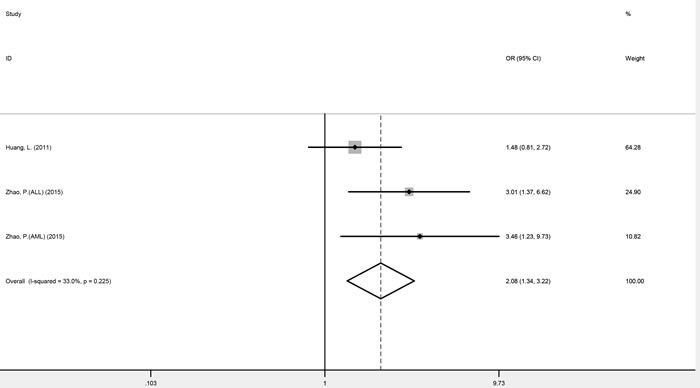
Figure 3: Forest plots of fixed-effects ORs for mTOR rs2295080 and risk of acute leukemia based on a recessive model (GG versus GT/TT).
Meta-analysis of mTOR rs1883965
Four studies, consisting of 4300 cases and 4420 controls, investigated the association between SNP rs1883965 and cancer risk. These studies were homogenous for OR1, OR2, and OR3, which were 0.91 (P = 0.733), 1.15 (P = 0.019), and 0.79 (P = 0.399), respectively. The summary estimate under the heterozygous model (GA versus GG) was statistically significant, implying that carriers of the rs1883965 GA heterozygote were more susceptible to cancer development. A comparison of GA versus GG/AA genotypes confirmed a complete over-dominant model (fixed-effect OR = 1.15, 95% CI 1.02-1.29, P = 0.018), with the GA heterozygote having a higher cancer risk than either GG or AA homozygotes (Figure 4 and Table 3).
Three studies focused on digestive tract cancers (esophageal carcinoma, gastric cancer, and hepatocellular carcinoma). Heterogeneity was noted for OR1 (I2 = 65.2%, phet = 0.056), so no further analysis was conducted.
Meta-analysis of mTOR rs1034528, rs1064261, rs17036508, and rs3806317
Two studies determined the association between SNPs rs1034528, rs17036508, and rs3806317 and cancer risk, with 2,006 cancer patients and 2,054 controls enrolled. For rs1034528, studies were homogenous for OR1, OR2, and OR3, with values of 0.95 (P = 0.791), 1.30 (P < 0.001), and 0.73 (P = 0.109), respectively, suggesting a complete over-dominant model (GC versus GG/CC: fixed-effect OR = 1.30, 95% CI 1.13-1.48, P < 0.001). For rs17036508, heterogeneity tests were also negative for OR1, OR2, and OR3, at 0.99 (P = 0.975), 1.23 (P = 0.006), and 0.81 (P = 0.36), respectively, again suggesting a complete over-dominant model (GC versus GG/CC: fixed-effect OR = 1.23, 95% CI 1.06-1.43, P = 0.006) (Table 3). For rs3806317, heterogeneity tests were negative for OR1 and OR3 but significant for OR2 (I2 = 70.8%, phet = 0.064), so it was not appropriate to meta-analyze the data. Two studies reporting rs1064261 genotype data from 1599 cancer patients and 1790 controls were homogenous for OR1, OR2, and OR3, with values of 0.90 (P = 0.82), 1.14 (P = 0.171), and 0.82 (P = 0.665), respectively. These estimates indicated a complete over-dominant model, whereas the overall gene effect was not significant (TC versus CC/TT: OR = 1.14, 95% CI 0.95-1.37, P = 0.287) (Table 2).
Publication bias
No obvious publication bias was detected, with the exception of rs1883965, which exhibited slight publication bias (Egger’s test: P = 0.084; Table 4).
Table 4: Publication bias
Begg's test |
Egger's test |
||||
z value |
p value |
t value |
p value |
||
rs2295080 |
|||||
Genitourinary cancers |
|||||
TG/GG vs.TT |
1.57 |
0.117 |
1.72 |
0.335 |
|
Acute leukemia |
|||||
GG vs.GT/TT |
0.52 |
0.602 |
2.26 |
0.265 |
|
rs1883965 |
|||||
GA vs.GG/AA |
-0.68 |
0.497 |
-3.24 |
0.084 |
|
rs17036508 |
|||||
TC vs.CC/TT |
-1 |
0.317 |
/ |
/ |
|
rs1034528 |
|||||
GC vs.GG/CC |
-1 |
0.317 |
/ |
/ |
|
Bioinformatics and expression analysis
Among the mTOR SNPs analyzed, data from the SNPinfo database suggested that six (rs3806317, rs1034528, rs12125777, rs1883965, rs2295080, and rs1074078) are located in transcription factor binding sites (TFBS), four (rs11121691, rs1057079, rs17036508, and rs1064261) may affect exonic splicing enhancer or exonic splicing silencer binding site activity or even abolish a protein domain, and two (rs2536 and rs17036508) are within microRNA (miRNA) binding sites.
As for the mTOR SNPs included in this meta-analysis, the F-SNP (FS) database found no functional information for the 3′-UTR SNP rs2536. Intronic polymorphisms rs3806317, rs17036508, and rs1883965 had an FS score of 0.101, while that of rs1034528 was 0.398, probably reflecting the frameshift coding changes it may cause. As a synonymous coding polymorphism, rs1064261 was shown to be conserved across multiple species with an FS score of 0.33. The mTOR promoter SNP rs2295080 was found to have an FS score of 0.101. Detailed information on the SNP functional bioinformatics analysis is shown in Table 5.
Table 5: Bioinformatics analysis of investigated mTOR SNPs by using SNPinfo database and F-SNP database
No content is listed under non-synonymous polymorphisms (nsSNPs), Stop Codon, and Polyphen
Given that rs2295080, rs1883965, rs1034528 and rs17036508 showed a potential association with cancer susceptibility, we further explored their relationship with mTOR transcript expression levels using the SNPexp web tool (Table 6-7). No significant alteration in transcript expression was observed for rs2295080. In the YRI population, the expression level of the rs1883965 heterozygote was lower than that of homozygotes (complete over-dominant: P = 0.043) (Table 6). For rs1034528, the C allele was correlated with significantly decreased levels of mTOR transcript expression compared with the G allele in both the European population (heterozygous: P = 0.023; dominant: P = 0.035; complete over-dominant: P = 0.019) and all populations (heterozygous: P = 0.002; dominant: P = 0.001; complete over-dominant: P = 0.003). A similar trend was observed for rs17036508 for all populations (heterozygous: P = 0.001; dominant: P = 0.001; complete over-dominant: P = 0.001), although no significant linkage disequilibrium was found between these two polymorphisms among the four different ethnicities (Table 7).
Table 6: MTOR expression analysis by the genotypes of rs2295080 and rs1883965, using data from the HapMap
rs2295080 |
rs1883965 |
|||||||||
Ethnicities |
Genotypes |
No. |
Mean±SD |
Pb |
Pctrend |
Genotypes |
No. |
Mean±SD |
Pb |
Pctrend |
CEU |
TT |
41 |
8.55±0.18 |
0.122 |
GG |
35 |
8.59±0.18 |
0.105 |
||
TG |
42 |
8.45±0.29 |
0.068 |
GA |
40 |
8.51±0.28 |
0.158 |
|||
GG |
7 |
8.48±0.25 |
0.367 |
AA |
6 |
8.47±0.21 |
0.13 |
|||
Dominant |
49 |
8.45±0.28 |
0.068 |
Dominant |
46 |
8.50±0.27 |
0.114 |
|||
Complete |
48 |
8.54±0.19 |
0.09 |
Complete |
41 |
8.57±0.19 |
0.255 |
|||
over-dominant |
over-dominant |
|||||||||
Asian |
TT |
NA |
/ |
/ |
/ |
GG |
66 |
8.22±0.24 |
/ |
|
TG |
NA |
/ |
/ |
GA |
19 |
8.18±0.26 |
0.494 |
|||
GG |
NA |
/ |
/ |
AA |
0 |
/ |
/ |
|||
Dominant |
NA |
/ |
/ |
Dominant |
/ |
/ |
/ |
|||
Complete |
NA |
/ |
/ |
Complete |
/ |
/ |
/ |
|||
over-dominant |
over-dominant |
|||||||||
YRI |
TT |
NA |
/ |
/ |
/ |
GG |
4 |
8.33±0.31 |
0.304 |
|
TG |
NA |
/ |
/ |
GA |
36 |
8.15±0.26 |
0.203 |
|||
GG |
NA |
/ |
/ |
AA |
43 |
8.26±0.24 |
0.586 |
|||
Dominant |
NA |
/ |
/ |
Dominant |
40 |
8.17±0.26 |
0.108 |
|||
Complete |
NA |
/ |
/ |
Complete |
47 |
8.26±0.24 |
0.043 |
|||
over-dominant |
over-dominant |
|||||||||
All |
TT |
41 |
8.55±0.18 |
0.122 |
GG |
105 |
8.36±0.26 |
0.237 |
||
TG |
42 |
8.45±0.29 |
0.068 |
GA |
95 |
8.31±0.29 |
0.185 |
|||
GG |
7 |
8.48±0.25 |
0.367 |
AA |
49 |
8.32±0.21 |
0.304 |
|||
Dominant |
49 |
8.45±0.28 |
0.068 |
Dominant |
144 |
8.31±0.27 |
0.149 |
|||
Complete |
48 |
8.54±0.19 |
0.09 |
Complete |
154 |
8.34±0.24 |
0.272 |
|||
over-dominant |
over-dominant |
|||||||||
The results are in bold if P < 0.05.
* Genotyping data and transcript expression levels for mTOR by genotypes were from the HapMap phase II release 23 data (rs2295080, rs1883965)
# Two-tailed Student’s t test
^ P values for the trend test of mTOR transcript expression among 3 genotypes for each SNP from a general linear model
Table 7: MTOR expression analysis by the genotypes of rs1034528 and rs17036508, using data from the HapMap
rs1034528 |
rs17036508 |
|||||||||
Ethnicities |
Genotypes |
No. |
Mean±SD |
Pb |
Pctrend |
Genotypes |
No. |
Mean±SD |
Pb |
Pctrend |
CEU |
GG |
48 |
8.59±0.19 |
0.107 |
TT |
81 |
8.54±0.24 |
/ |
/ |
|
GC |
35 |
8.47±0.29 |
0.023 |
TC |
0 |
/ |
/ |
|||
CC |
4 |
8.60±0.19 |
0.937 |
CC |
0 |
/ |
/ |
|||
Dominant |
39 |
8.48±0.28 |
0.035 |
Dominant |
/ |
/ |
/ |
|||
Complete |
52 |
8.59±0.18 |
0.019 |
Complete |
/ |
/ |
/ |
|||
over-dominant |
over-dominant |
|||||||||
Asian |
GG |
59 |
8.24±0.23 |
0.221 |
TT |
71 |
8.21±0.24 |
0.682 |
||
GC |
29 |
8.18±0.25 |
0.339 |
TC |
13 |
8.23±0.23 |
0.805 |
|||
CC |
1 |
8 |
0.31 |
CC |
1 |
7.9 |
0.205 |
|||
Dominant |
30 |
8.18±0.25 |
0.278 |
Dominant |
14 |
8.21±0.24 |
0.937 |
|||
Complete |
60 |
8.23±0.23 |
0.367 |
Complete |
72 |
8.21±0.24 |
0.76 |
|||
over-dominant |
over-dominant |
|||||||||
YRI |
GG |
21 |
8.28±0.22 |
0.646 |
TT |
47 |
8.24±0.24 |
0.372 |
||
GC |
44 |
8.16±0.26 |
0.075 |
TC |
35 |
8.15±0.26 |
0.09 |
|||
CC |
23 |
8.24±0.23 |
0.575 |
CC |
2 |
8.46±0.28 |
0.227 |
|||
Dominant |
65 |
8.20±0.25 |
0.488 |
Dominant |
37 |
8.17±0.27 |
0.159 |
|||
Complete |
44 |
8.26±0.23 |
0.059 |
Complete |
49 |
8.25±0.24 |
0.064 |
|||
over-dominant |
over-dominant |
|||||||||
All |
GG |
128 |
8.39±0.25 |
0.01 |
TT |
199 |
8.36±0.26 |
0.002 |
||
GC |
108 |
8.28±0.27 |
0.002 |
TC |
48 |
8.22±0.24 |
0.001 |
|||
CC |
28 |
8.32±0.23 |
0.162 |
CC |
3 |
8.26±0.36 |
0.535 |
|||
Dominant |
136 |
8.29±0.26 |
0.001 |
Dominant |
51 |
8.22±0.24 |
0.001 |
|||
Complete |
156 |
8.37±0.24 |
0.003 |
Complete |
202 |
8.36±0.26 |
0.001 |
|||
over-dominant |
over-dominant |
|||||||||
The results are in bold if P < 0.05.
* Genotyping data and transcript expression levels for mTOR by genotypes were from the HapMap phase II release 23 data (rs1034528) and HapMap phase III release 3 data (rs17036508)
# Two-tailed Student’s t test
^ P values for the trend test of mTOR transcript expression among 3 genotypes for each SNP from a general linear model
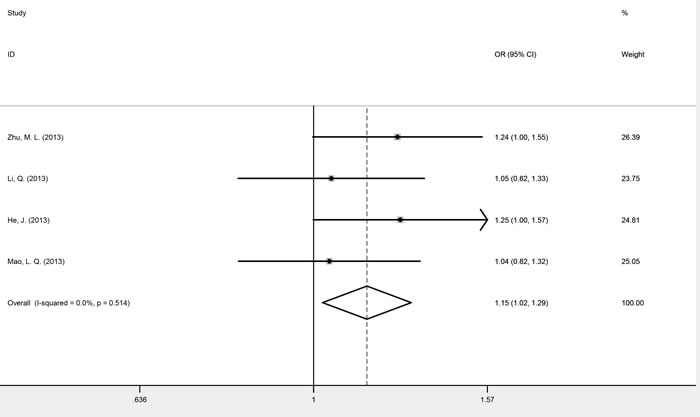
Figure 4: Forest plots of fixed-effects ORs for mTOR rs1883965 and cancer risk based on a complete over-dominant model (GA versus GG/AA).
Discussion
As the central controller of cellular growth and proliferation, mTOR induces several anabolic processes such as protein synthesis [32], lipogenesis [33, 34] and nucleotide biosynthesis [35, 36], suppresses catabolic processes such as autophagy [37] and lysosome biogenesis [38], and regulates whole body energy metabolism [39] by forming two distinct multiprotein complexes, mTORC1 and mTORC2. Blocking mTOR activation by an mTOR inhibitor, such as everolimus or temsirolimus, exhibits an anti-neoplastic effect and is approved by the Food and Drug Administration and the European Medicines Agency for the treatment of limited types of cancers [40]. As well as their effect on cancer which had developed already, mTOR inhibitors play even more significant roles in cancer prevention [41]. Using sirolimus after renal transplantation could reduce the risk of malignancies for transplant recipients, who are at higher risk of cancer because of immunosuppression [42, 43]. Additionally, rapamycin has been shown to delay carcinogenesis and prolong lifespan in p53-deficient mice [44, 45]. This indicates that mTOR has a critical role to play in oncogenesis. As the mTOR pathway is a central controller of cellular growth, excessive activation caused by mutations or other changes in upstream pathways confers a growth advantage to cancer cells. But beyond that, Overstimulation of the mTOR pathway also accelerates organismal aging and then contributes to oncogenesis indirectly [46].
Genetic alterations are widespread throughout mTOR and influence protein function by changing gene expression. Mutant mTOR proteins caused by point mutations around the kinase domain of mTOR demonstrate constitutive activation [11, 47, 48], and have been shown to affect cell cycle progression and cell size in human cancers [11]. Polymorphisms occur more frequently than mutations and are stably inherited within a population. Therefore, determining their impact on the mTOR protein and oncogenesis is of great importance.
The present systematic review evaluated the overall effect of mTOR polymorphisms on cancer risk, and the updated meta-analysis evaluated the most commonly investigated mTOR polymorphisms: rs2536, rs2295080, rs1883965, rs1034528, rs17036508, rs3806317 and rs1064261. We identified a significant correlation between heterozygotes of SNPs rs1883965, rs1034528 and rs17036508 and increased cancer risk compared with homozygotes. Significant results were also identified for SNP rs2295080 in the subgroup of genitourinary cancers and acute leukemia. No clear associations between the other meta-analyzed polymorphisms and cancer risk were observed.
SNP rs2536: a controversial association with cancer risk
The rs2536 (T > C) polymorphism in the mTOR 3′-UTR was predicted to affect miRNA-binding site activity based on the SNPinfo database. Li et al. [31] previously reported that co-transfection of the rs2536 G allele and A allele with miR-767-3p exhibited different promoter activities. However, previous studies regarding the relationship between rs2536 and cancer risk are inconsistent. In a study by Li et al. [30], rs2536 was correlated with an increased risk of prostate cancer, while an earlier Chinese case-control study [23] focusing on the risk of childhood acute lymphoblastic leukemia reported the opposite effect. Other case-control studies concentrating on esophageal carcinoma [19], gastric cancer [14], prostate cancer [29], renal cell cancer [10], hepatocellular carcinoma [49], and meningioma [28] found no significant association, nor did a previous meta-analysis [26].
The present pooled analysis also found no significant association between rs2536 and cancer risk, after removing the main source of heterogeneity and performing stratified analyses by cancer type. However, several studies indicated that although the main effect was not obvious, rs2536 was included in the best model to predict the risk of esophageal carcinoma [19] and prostate cancer [30], together with polymorphisms known to be associated with cancer susceptibility and environmental factors such as body mass index (BMI). This means that rs2536 should not be simply categorized as “not important”, because it may interact with environmental factors or other genetic variations and is linked to cancer development through joint effects.
SNP rs2295080: inconsistent roles in genitourinary cancers and acute leukemia
The rs2295080 (T > G) polymorphism located in the mTOR upstream region was predicted to be within a TFBS by the SNPinfo database, which has been further confirmed by the lower nuclear protein binding activity of the G allele in human gastric cancer cell line SGC-7901 [15]. Moreover, patients with gastric cancer [15] and renal cell cancer [10] carrying the rs2295080 G allele showed decreased mTOR mRNA levels compared with those with the wild-type T allele. Additionally, rs2295080 has been linked to decreased mTOR promoter activity in several cell lines [10, 15, 25]. Many previous studies have shown that the rs2295080 G allele is associated with a decreased risk of gastric cancer [15], colon cancer [25], prostate cancer [29, 30], and renal cell cancer [10], and this was supported by a previously published meta-analysis [26]. However, recently, some opposite findings were reported in gastric cancer [18], esophageal carcinoma [20], and childhood acute leukemia [24].
We found that the rs2295080 G allele was associated with a significantly lower risk of genitourinary cancers in the dominant model, and a higher risk of acute leukemia in the recessive model. Therefore, the biological effect of rs2295080 might be cancer-specific. Notably, an obvious divergence of rs2295080 effects was observed in cancers of the digestive system, which might be partially explained by a high degree of heterogeneity, especially for gastric cancer [50]. A more detailed classification based on clinical, histologic, and molecular features will help to elucidate the relationship between rs2295080 and gastrointestinal cancers.
SNP rs1883965: increased cancer risk under the complete over-dominant model
The SNP rs1883965 (G > A) is located within the first intron of mTOR, so is more likely to be involved in the regulation of transcription and be associated with disease compared with SNPs in other introns [51]. The SNPinfo database indicated that rs1883965 is located in a TFBS, which may affect the level or timing of gene expression. Two previous studies indicated increased associations between the rs1883965 A allele and the risks of esophageal carcinoma [19] and gastric cancer [14], and our present meta-analysis found the heterozygote GA to be significantly associated with increased cancer risk compared with homozygotes GG and AA. Interestingly, we observed slightly decreased mTOR mRNA expression in YRI individuals carrying the rs1883965 heterozygote GA (P = 0.043). Such discrepant results may not be entirely attributed to racial differences, but could reflect the small sample size of gene expression data, which increases the probability of false-positive findings. Therefore, more studies are essential to obtain a more reliable conclusion regarding the association between rs1883965 and mTOR transcription.
SNPs rs1034528 and rs17036508: associated with increased cancer risk under the complete over-dominant model
SNPs rs1034528 (G > C) and rs17036508 (T > C) are both located within intronic regions of mTOR. Bioinformatics analysis revealed that rs1034528 is located within a TFBS and causes a frameshift coding change. Its FS score of 0.398 is the highest among those mTOR SNPs investigated. SNP rs17036508 was predicted to be located within a miRNA binding site and an exonic splicing enhancer or silencer motif, affecting the splicing of pre-RNA. Previously, the associations between rs1034528 and rs17036508 and gastric and prostate cancer were investigated and the rs1034528 C allele was shown to be a risk factor in two independent studies [18, 30]. In the present study, we found that heterozygote carriers of rs1034528 and rs17036508 were more likely to develop cancer compared with homozygotes. However, expression analysis using HapMap data indicated that homozygotes had higher mTOR transcript expression levels. Because the mTOR signaling pathway usually promotes oncogenesis, this finding is unexpected but could be explained by the fact that mTOR mutants caused by different amino acid substitutions have different abilities to phosphorylate substrates S6K1 and 4E-BP1, even though they are expressed at similar levels after nutrient starvation [11]. Thus, it is conceivable that a frameshift within the coding region (rs1034528) or splicing variants (rs17036508) confers hyperactivation to the mTOR protein, which promotes the development of cancer regardless of the expression level. Alternatively, rs1034528 and rs17036508 are respectively located in 5′ upstream region and 3′-UTR of the angiopoietin-like 7 gene (ANGPTL7), itself within intron 28 of mTOR. ANGPTL7 expression was reported to be up-regulated by hypoxia in cancer cells and to exert a pro-angiogenetic effect, which is essential in the early stages of tumor development [52]. Therefore, these two polymorphisms might mediate tumor formation by regulating the expression of mTOR and ANGPTL7 simultaneously.
Other mTOR polymorphisms: further investigation required
rs1064261 (T > C) and rs1057079 (A > G) are synonymous SNPs within exonic regions. Although not altering amino acid sequences, they were predicted to interrupt the exonic splicing enhancer or silencer motif, or even abolish a protein domain. Positive correlations of the rs1064261 C allele with an increased risk of neuroendocrine tumors [53] and gastric cancer in men [17] have been reported, while its interaction with rs2295080 was also identified in esophageal squamous cell carcinoma [20]. However, our previous work found no association between rs1064261 and total or phosphorylated mTOR protein in gastric cancer mucosa [17]. The present meta-analysis also revealed no association between rs1064261 and overall cancer risk. As for SNP rs1057079, carriers of the G allele were at higher risk of developing colon cancer and breast cancer [13, 54] and ethnic differences might exist for the effect of rs1057079 on cancer risk [54].
Although several intronic SNPs were excluded from the present meta-analysis and the integrated results of their relationships with cancer risk were not discussed because of the limited number of studies, some of them exhibited potential biological activity. SNPs rs12125777 (C > T) and rs12124983 (C > T) were identified to interfere with transcriptional regulation by bioinformatic analysis; these predictions were confirmed by clinical evidence [27, 53] and so warrant further research. While no functional information currently exists for SNPs rs2024627 (C > T) and rs718206 (A > T), they were shown to be significantly associated with increased colon cancer risk by a case-control study [13]. These SNPs might not be causative of disease but could exist in high linkage disequilibrium with other functional SNPs.
Gene-gene and gene-environment interactions
Integrated risk estimates of clinical evidence reveal that the mTOR SNPs studied to date only have a mild effect on cancer development. The FS integrative scoring system also defined these polymorphisms as having relatively moderate deleterious effects, because no mTOR SNPs have yet been assigned an FS score as high as 0.5, which is the median score of disease-related SNPs [55].
Although the magnitude of the effect of an individual mTOR SNP on cancer susceptibility appears to be weak, its interaction with functionally relevant variants and environmental factors might have a greater effect on oncogenesis. Carriers of combined risk alleles have been previously shown to have a significantly increased risk of developing various types of cancer, mostly in a dose-dependent manner. For example, Li et al. [30] found that individuals carrying four adverse genotypes from six mTOR polymorphisms (rs2536, rs1883965, rs1034528, rs17036508, rs3806317, and rs2295080) exhibited a higher susceptibility of developing prostate cancer (adjusted OR = 1.74, 95% CI 1.20-2.51) compared with those with one or zero adverse genotypes. Such cumulative effects were also observed across SNPs in mTOR and mTOR pathway-related genes (PIK3R1, AKT2, and PTEN) [10, 20, 29], or in genes encoding components of mTOR complex 1 (mLST8 and RPTOR) [19]. Several studies assessed mTOR haplotype effects on cancer risk [13, 14, 20, 30, 49]. Zhu et al. [20] explored the relationships between haplotypes of rs2295080, rs1064261 and rs1057079 and the risk of esophageal squamous cell carcinoma. Although no significant association was observed when SNPs were analyzed individually, there were clear associations between three of the seven identified haplotypes and increased cancer risk compared with the most frequent haplotype. Interactions of rs2295080 with either rs1057079 or rs1064261 were also found.
Possible interactions between mTOR polymorphisms and environmental factors such as smoking status, drinking status, age, sex and BMI have also been reported. Both the effects of individual SNPs and combined risk genotypes were greater in some high-risk subgroups for many cancers such as older adults and smokers [14-16, 18-20, 25, 29, 30]. Furthermore, statistical gene-environment interactions between mTOR SNPs and BMI were verified in esophageal squamous cell carcinoma [20] and breast cancer [27]. It has been reported in mouse heart tissue that phosphorylated S6, which reflects the activity of mTOR, is positively related to body weight [56]. Because the mTOR pathway regulates energy metabolism and as cancer can be regarded as a metabolic disorder, it is not surprising that BMI might be a mediator between mTOR variants and cancer susceptibility. However, the underlying mechanisms may vary depending on cancer type and remain to be investigated.
Limitations
A number of limitations of this systematic review and meta-analysis should be noted. First, although we collected all published clinical evidence investigating mTOR SNPs and cancer risk, the pooled sample size of this meta-analysis was still relatively small, especially for rs1034528, rs17036508, rs1064261, and rs3806317. This weakened the statistical power and limited our ability to perform more accurate subgroup analyses for specific cancer types. Second, the ethnicity of all available studies for meta-analysis was Han Chinese, so our findings may not be applicable to other populations. However, because Han Chinese is the largest ethnic group in the world and as the gene pool reflects a long history of immigrations and intermarriages with other ethnic groups [57], these data represent the complexity of the impact of mTOR polymorphisms on cancer development. Third, all studies included in the systematic review were published in English or Chinese, yet publications in other languages may contain different relevant studies. This may be the main source of publication bias in our meta-analysis. Finally, although the SNPinfo database and F-SNP aim to reduce the number of false-positive results, computational predictions of certain SNPs are only estimates and should be confirmed by functional studies.
Future directions
The study of mTOR polymorphisms has mainly focused on cancer susceptibility in recent years. To date, only 20 of 129 common SNPs within mTOR have been investigated in relation to cancer risk. Future studies may benefit from genotyping additional polymorphisms to identify more functionally significant variants. Additionally, although the risk effects of the mTOR SNPs so far examined are too small to be regarded as clinically useful, their interactions with other genetic variants or environmental factors have been shown to contribute to further increases in cancer risk either additively or synergistically. The mechanisms of these joint effects deserve further research. mTOR polymorphisms may also be associated with clinical outcomes and response to chemoradiotherapy. Several polymorphisms, such as rs2295080, rs11121704, and rs12139042, have been shown to be significantly associated with lung and esophageal cancer [58-60], but more attention should be given to the association of mTOR polymorphisms with treatment response to inhibitors of the mTOR pathway. In vitro functional studies should also be conducted to confirm these functional predictions and reveal the underlying molecular mechanisms behind the observed associations. Finally, some investigations have found that mTOR inhibitors are able to prolong lifespan not just by inhibiting the growth of tumors, but by postponing the aging process [41, 61]. This means that mTOR polymorphisms may also play roles in other age-related diseases, such as cardiovascular and neurodegenerative disorders, and further investigation is required.
Materials and methods
This systematic review and meta-analysis was conducted following the PRISMA (Preferred Reporting Items for Systematic Reviews and Meta-Analyses) recommendations [62].
Search strategy
We searched the PubMed, Embase, Chinese National Knowledge Infrastructure and Wanfang Data databases to identify potentially relevant studies published before November 3, 2015, without language restrictions. The following keywords were used jointly as search terms: “mTOR” or “FRAP” or “RAFT1” or “RAPT1”, “polymorphism” or “variant” or “mutation” and “cancer” or “tumor” or “carcinoma” or “carcinoma” or “malignancy”. The full electronic search strategy for PubMed is shown in Appendix 2. We also manually searched the reference lists to identify other potential articles. If overlapping data by the same first author were found, the article with the largest number of subjects was included.
Inclusion and exclusion criteria
Studies were eligible if they met the following criteria: (1) evaluated the association between mTOR polymorphisms and cancer risk; (2) written in English or Chinese; and (3) case-control studies. Studies were excluded if they were: (1) reviews or comments; or (2) animal or cell line studies. Eligible studies were determined by two researchers (ZNJ and LX) independently. Disagreement was resolved by discussion or consulting another researcher (CYH).
Data extraction and quality assessment
Relevant information, including the first author’s name, year of publication, country in which the study was conducted, ethnicity, cancer type, control source (population-based or hospital-based), genotyping methods, matching criteria for controls, number of cases and controls, and genotype distribution of cases and controls, was extracted from each eligible study by two independent researchers (ZNJ and LX).
The quality of eligible studies in this analysis was evaluated according to the NOS [63], which contains three perspectives: selection (four scores), comparability (two scores), and exposure (three scores). The quality of each study was independently assessed by two researchers (ZNJ and LX).
Statistical analysis
HWE was evaluated in the controls of each study using the chi-square test. The crude odds ratio (OR) and corresponding 95% confidence interval (CI) were calculated by the Z test to assess the strength of the association between genotype and cancer risk; P < 0.05 was considered statistically significant.
To identify the best matching genetic model for mTOR polymorphisms in the occurrence of malignancies, we used the methods recommended by Thakkinstian [64]. OR1, OR2, and OR3 were calculated for genotypes VV versus WW, WV versus WW, and VV versus WV for each polymorphism that qualified for meta-analysis to detect the existence of heterogeneity. Appropriate genetic models were then determined in terms of the relationship between the three pairwise differences:
(1) Recessive model: if OR1 = OR3≠1 and OR2 = 1.
(2) Dominant model: if OR1 = OR2≠1 and OR3 = 1.
(3) Complete over-dominant model: if OR1 = 1, OR2 = 1/OR3≠ 1.
(4) Co-dominant model: if OR1 > OR2 > 1 and OR1 > OR3 > 1, or OR1 < OR2 < 1 and OR1 < OR3 < 1.
Using the indicated genetic model collapsed the three genotypes into two groups (except in the case of a co-dominant model):
(1) If a dominant model was indicated, V carriers (VV plus WV) versus WW.
(2) If a recessive model was indicated, VV versus W carriers (WV plus WW).
(3) If a complete over-dominant model was indicated, (VV plus WW) versus WV.
(4) If a co-dominant model was indicated, VV versus WV, and VV versus WW.
Between-study heterogeneity was evaluated using the Q-statistical test and I2 test [65]. The random-effects model (the DerSimonian and Laird method) [66] and fixed-effects model (the Mantel-Haenszel method) [67] were taken to calculate summary estimates of heterogeneous studies (Q test, P < 0.1 or I2 > 50 %) and homogenous studies, respectively. Potential sources of heterogeneity were explored using sensitivity analysis carried out by removing a single study from the meta-analysis each time, or subgroup analyses with cancer types. Potential publication bias was estimated using Begg’s rank correlation [68] and Egger’s regression asymmetry test [69] (P < 0.1 was considered significant). STATA software version 11.0 (STATA, College Station, TX) was used for statistical analyses.
SNP functional assessment
To cover as many bioinformatics web services and public databases as possible, we used two integration platforms of SNP analysis resources: the SNPinfo database [70] (http://snpinfo.niehs.nih.gov/snpinfo/snpfunc.htm) and the functional single nucleotide polymorphism (F-SNP) database [55, 71] (http://compbio.cs.queensu.ca/F-SNP/). Potential biological effects of the investigated mTOR SNPs were evaluated, including changes in protein coding, transcriptional regulation, splicing sites, and micro (mi)RNA-binding sites. Correlations between mTOR polymorphism genotypes and gene expression levels from 270 HapMap phase II and III individuals from four populations (CEU, CHB, JPT and YRI) were conducted online, using the SNPexp web tool [72] (http://tinyurl.com/snpexp).
Conflicts of Iinterest
There is no confict of interest.
Grant Support
This study is supported by grants from National Basic Research Program of China (973 Program Ref No.2010CB529304)
References
1. Edinger AL and Thompson CB. Akt maintains cell size and survival by increasing mTOR-dependent nutrient uptake. Molecular biology of the cell. 2002; 13:2276-2288.
2. Fingar DC, Richardson CJ, Tee AR, Cheatham L, Tsou C and Blenis J. mTOR controls cell cycle progression through its cell growth effectors S6K1 and 4E-BP1/eukaryotic translation initiation factor 4E. Molecular and cellular biology. 2004; 24:200-216.
3. Zoncu R, Efeyan A and Sabatini DM. mTOR: from growth signal integration to cancer, diabetes and ageing. Nature reviews Molecular cell biology. 2011; 12:21-35.
4. Laplante M and Sabatini DM. mTOR signaling in growth control and disease. Cell. 2012; 149:274-293.
5. Yuan T and Cantley L. PI3K pathway alterations in cancer: variations on a theme. Oncogene. 2008; 27:5497-5510.
6. Wang R, Geng J, Wang JH, Chu XY, Geng HC and Chen LB. Overexpression of eukaryotic initiation factor 4E (eIF4E) and its clinical significance in lung adenocarcinoma. Lung cancer (Amsterdam, Netherlands). 2009; 66:237-244.
7. Sahin F, Kannangai R, Adegbola O, Wang J, Su G and Torbenson M. mTOR and P70 S6 kinase expression in primary liver neoplasms. Clinical cancer research. 2004; 10:8421-8425.
8. Johnson SM, Gulhati P, Rampy BA, Han Y, Rychahou PG, Doan HQ, Weiss HL and Evers BM. Novel expression patterns of PI3K/Akt/mTOR signaling pathway components in colorectal cancer. Journal of the American College of Surgeons. 2010; 210:767-776, 776-768.
9. Chung JY, Hong SM, Choi BY, Cho H, Yu E and Hewitt SM. The expression of phospho-AKT, phospho-mTOR, and PTEN in extrahepatic cholangiocarcinoma. Clinical cancer research. 2009; 15:660-667.
10. Cao Q, Ju X, Li P, Meng X, Shao P, Cai H, Wang M, Zhang Z, Qin C and Yin C. A functional variant in the MTOR promoter modulates its expression and is associated with renal cell cancer risk. PloS one. 2012; 7:e50302.
11. Sato T, Nakashima A, Guo L, Coffman K and Tamanoi F. Single amino-acid changes that confer constitutive activation of mTOR are discovered in human cancer. Oncogene. 2010; 29:2746-2752.
12. Brookes AJ. The essence of SNPs. Gene. 1999; 234:177-186.
13. Slattery ML, Herrick JS, Lundgreen A, Fitzpatrick FA, Curtin K and Wolff RK. Genetic variation in a metabolic signaling pathway and colon and rectal cancer risk: mTOR, PTEN, STK11, RPKAA1, PRKAG2, TSC1, TSC2, PI3K and Akt1. Carcinogenesis. 2010; 31:1604-1611.
14. He J, Wang MY, Qiu LX, Zhu ML, Shi TY, Zhou XY, Sun MH, Yang YJ, Wang JC, Jin L, Wang YN, Li J, Yu HP and Wei QY. Genetic variations of mTORC1 genes and risk of gastric cancer in an Eastern Chinese population. Molecular carcinogenesis. 2013; 52 Suppl 1:E70-79.
15. Xu M, Tao G, Kang M, Gao Y, Zhu H, Gong W, Wang M, Wu D, Zhang Z and Zhao Q. A polymorphism (rs2295080) in mTOR promoter region and its association with gastric cancer in a Chinese population. PloS one. 2013; 8:e60080.
16. Wang M, Zhu M, He J, Shi T, Li Q and Wei Q. P0217 Potentially functional polymorphisms in the mTOR gene and gastric adenocarcinoma susceptibility in an eastern Chinese population. European Journal of Cancer. 2014; 50:e70.
17. Piao Y, Li Y, Xu Q, Liu JW, Xing CZ, Xie XD and Yuan Y. Association of MTOR and AKT Gene Polymorphisms with Susceptibility and Survival of Gastric Cancer. PloS one. 2015; 10:e0136447.
18. Wang MY, Li QX, He J, Qiu LX, Wang YN, Li J, Sun MH, Wang XF, Yang YJ, Wang JC, Jin L and Wei QY. Genetic variations in the mTOR gene contribute toward gastric adenocarcinoma susceptibility in an Eastern Chinese population. Pharmacogenetics and genomics. 2015; 25:521-530.
19. Zhu ML, Yu H, Shi TY, He J, Wang MY, Li QX, Sun MH, Jin L, Yang YJ, Wang JC, Xiang JQ and Wei QY. Polymorphisms in mTORC1 genes modulate risk of esophageal squamous cell carcinoma in eastern Chinese populations. Journal of thoracic oncology. 2013; 8:788-795.
20. Zhu J, Wang M, Zhu M, He J, Wang JC, Jin L, Wang XF, Xiang JQ and Wei Q. Associations of PI3KR1 and mTOR polymorphisms with esophageal squamous cell carcinoma risk and gene-environment interactions in Eastern Chinese populations. Scientific reports. 2015; 5:8250.
21. Wang LE, Ma H, Hale KS, Yin M, Meyer LA, Liu H, Li J, Lu KH, Hennessy BT, Li X, Spitz MR, Wei Q and Mills GB. Roles of genetic variants in the PI3K and RAS/RAF pathways in susceptibility to endometrial cancer and clinical outcomes. Journal of cancer research and clinical oncology. 2012; 138:377-385.
22. Shu X, Lin J, Wood CG, Tannir NM and Wu X. Energy balance, polymorphisms in the mTOR pathway, and renal cell carcinoma risk. Journal of the National Cancer Institute. 2013; 105:424-432.
23. Huang L, Huang J, Wu P, Li Q, Rong L, Xue Y, Lu Q, Li J, Tong N, Wang M, Zhang Z and Fang Y. Association of genetic variations in mTOR with risk of childhood acute lymphoblastic leukemia in a Chinese population. Leukemia & lymphoma. 2012; 53:947-951.
24. P.W. Zhao, X. Yue, H. Xiong, J.X. Li, H. Li and He. XL. Analysis of polymorphism of mTOR gene in children acute leukemia. Journal of Clinical Pediatrics (China). 2015; 33:423.
25. Xu M, Gao Y, Yu T, Wang J, Cheng L, Cheng L, Cheng D and Zhu B. Functional promoter rs2295080 T > G variant in MTOR gene is associated with risk of colorectal cancer in a Chinese population. Biomedicine & pharmacotherapy. 2015; 70:28-32.
26. Shao J, Li Y, Zhao P, Yue X, Jiang J, Liang X and He X. Association of mTOR polymorphisms with cancer risk and clinical outcomes: a meta-analysis. PloS one. 2014; 9:e97085.
27. Cheng T-YD, Shankar J, Zirpoli G, Yao S, Roberts M, Hong C-C, Bandera EV and Ambrosone CB. Interaction between genetic variants in mTOR and body size on breast cancer risk in African-American and European-American women. Cancer Research. 2014; 74:3280-3280.
28. Zhang HY. Polymorphisms in mTOR Gene and Risk of Meningioma in Chinese Population (Master’s Thesis). Capital Medical University, Beijing, China. 2014.
29. Chen J, Shao P, Cao Q, Li P, Li J, Cai H, Zhu J, Wang M, Zhang Z, Qin C and Yin C. Genetic variations in a PTEN/AKT/mTOR axis and prostate cancer risk in a Chinese population. PloS one. 2012; 7:e40817.
30. Li Q, Gu C, Zhu Y, Wang M, Yang Y, Wang J, Jin L, Zhu ML, Shi TY, He J, Zhou X, Ye DW and Wei Q. Polymorphisms in the mTOR gene and risk of sporadic prostate cancer in an Eastern Chinese population. PloS one. 2013; 8:e71968.
31. Li Q. Functional genetic variants in the mTORC1 related genes contribute to prostate cancer susceptibility and clinical outcomes (Doctoral Thesis). Fudan University, Shanghai, China. 2014.
32. Ma XM and Blenis J. Molecular mechanisms of mTOR-mediated translational control. Nature reviews Molecular cell biology. 2009; 10:307-318.
33. Porstmann T, Santos CR, Griffiths B, Cully M, Wu M, Leevers S, Griffiths JR, Chung Y-L and Schulze A. SREBP activity is regulated by mTORC1 and contributes to Akt-dependent cell growth. Cell metabolism. 2008; 8:224-236.
34. Yecies JL, Zhang HH, Menon S, Liu S, Yecies D, Lipovsky AI, Gorgun C, Kwiatkowski DJ, Hotamisligil GS and Lee C-H. Akt stimulates hepatic SREBP1c and lipogenesis through parallel mTORC1-dependent and independent pathways. Cell metabolism. 2011; 14:21-32.
35. Robitaille AM, Christen S, Shimobayashi M, Cornu M, Fava LL, Moes S, Prescianotto-Baschong C, Sauer U, Jenoe P and Hall MN. Quantitative phosphoproteomics reveal mTORC1 activates de novo pyrimidine synthesis. Science. 2013; 339:1320-1323.
36. Ben-Sahra I, Howell JJ, Asara JM and Manning BD. Stimulation of de novo pyrimidine synthesis by growth signaling through mTOR and S6K1. Science. 2013; 339:1323-1328.
37. Koren I, Reem E and Kimchi A. DAP1, a novel substrate of mTOR, negatively regulates autophagy. Current Biology. 2010; 20:1093-1098.
38. Settembre C, Zoncu R, Medina DL, Vetrini F, Erdin S, Erdin S, Huynh T, Ferron M, Karsenty G and Vellard MC. A lysosome-to-nucleus signalling mechanism senses and regulates the lysosome via mTOR and TFEB. The EMBO journal. 2012; 31:1095-1108.
39. Albert V and Hall MN. mTOR signaling in cellular and organismal energetics. Current opinion in cell biology. 2015; 33:55-66.
40. Polivka J and Janku F. Molecular targets for cancer therapy in the PI3K/AKT/mTOR pathway. Pharmacology & therapeutics. 2014; 142:164-175.
41. Blagosklonny MV. Rapalogs in cancer prevention: anti-aging or anticancer? Cancer biology & therapy. 2012; 13:1349-1354.
42. Campistol JM, Eris J, Oberbauer R, Friend P, Hutchison B, Morales JM, Claesson K, Stallone G, Russ G, Rostaing L, Kreis H, Burke JT, Brault Y, Scarola JA and Neylan JF. Sirolimus therapy after early cyclosporine withdrawal reduces the risk for cancer in adult renal transplantation. Journal of the American Society of Nephrology. 2006; 17:581-589.
43. Mathew T, Kreis H and Friend P. Two-year incidence of malignancy in sirolimus-treated renal transplant recipients: results from five multicenter studies. Clinical transplantation. 2004; 18:446-449.
44. Komarova EA, Antoch MP, Novototskaya LR, Chernova OB, Paszkiewicz G, Leontieva OV, Blagosklonny MV and Gudkov AV. Rapamycin extends lifespan and delays tumorigenesis in heterozygous p53+/- mice. Aging (Albany NY). 2012; 4:709-714. doi: 10.18632/aging.100498.
45. Comas M, Toshkov I, Kuropatwinski KK, Chernova OB, Polinsky A, Blagosklonny MV, Gudkov AV and Antoch MP. New nanoformulation of rapamycin Rapatar extends lifespan in homozygous p53-/- mice by delaying carcinogenesis. Aging (Albany NY). 2012; 4:715-722. doi: 10.18632/aging.100496.
46. Blagosklonny MV. Molecular damage in cancer: an argument for mTOR-driven aging. Aging (Albany NY). 2011; 3:1130-1141. doi: 10.18632/aging.100422.
47. Ohne Y, Takahara T, Hatakeyama R, Matsuzaki T, Noda M, Mizushima N and Maeda T. Isolation of hyperactive mutants of mammalian target of rapamycin. The Journal of biological chemistry. 2008; 283:31861-31870.
48. Urano J, Sato T, Matsuo T, Otsubo Y, Yamamoto M and Tamanoi F. Point mutations in TOR confer Rheb-independent growth in fission yeast and nutrient-independent mammalian TOR signaling in mammalian cells. Proceedings of the National Academy of Sciences of the United States of America. 2007; 104:3514-3519.
49. Mao LQ. Association of mTOR polymorphisms and genetic susceptibility of hepatocellular carcinoma (Master’s Thesis). Guangxi Medical University, Xining, Guangxi, China. 2013.
50. Tan IB, Ivanova T, Lim KH, Ong CW, Deng N, Lee J, Tan SH, Wu J, Lee MH and Ooi CH. Intrinsic subtypes of gastric cancer, based on gene expression pattern, predict survival and respond differently to chemotherapy. Gastroenterology. 2011; 141:476-485. e411.
51. Chen R, Davydov EV, Sirota M and Butte AJ. Non-synonymous and synonymous coding SNPs show similar likelihood and effect size of human disease association. PloS one. 2010; 5:e13574.
52. Parri M, Pietrovito L, Grandi A, Campagnoli S, De Camilli E, Bianchini F, Marchiò S, Bussolino F, Jin B and Sarmientos P. Angiopoietin-like 7, a novel pro-angiogenetic factor over-expressed in cancer. Angiogenesis. 2014; 17:881-896.
53. Ter-Minassian M, Wang Z, Asomaning K, Wu MC, Liu C-Y, Paulus JK, Liu G, Bradbury PA, Zhai R and Su L. Genetic associations with sporadic neuroendocrine tumor risk. Carcinogenesis. 2011; 32:1216-1222.
54. Slattery ML, John EM, Torres-Mejia G, Lundgreen A, Herrick JS, Baumgartner KB, Hines LM, Stern MC and Wolff RK. Genetic variation in genes involved in hormones, inflammation and energetic factors and breast cancer risk in an admixed population. Carcinogenesis. 2012.
55. Lee PH and Shatkay H. An integrative scoring system for ranking SNPs by their potential deleterious effects. Bioinformatics. 2009; 25:1048-1055.
56. Leontieva OV, Novototskaya LR, Paszkiewicz GM, Komarova EA, Gudkov AV and Blagosklonny MV. Dysregulation of the mTOR pathway in p53-deficient mice. Cancer biology & therapy. 2013; 14:1182-1188.
57. Xu S, Yin X, Li S, Jin W, Lou H, Yang L, Gong X, Wang H, Shen Y, Pan X, He Y, Yang Y, Wang Y, Fu W, An Y, Wang J, et al. Genomic dissection of population substructure of Han Chinese and its implication in association studies. American journal of human genetics. 2009; 85:762-774.
58. Hildebrandt MA, Yang H, Hung M-C, Izzo JG, Huang M, Lin J, Ajani JA and Wu X. Genetic variations in the PI3K/PTEN/AKT/mTOR pathway are associated with clinical outcomes in esophageal cancer patients treated with chemoradiotherapy. Journal of clinical oncology. 2009; 27:857-871.
59. Pu X, Hildebrandt MA, Lu C, Lin J, Stewart DJ, Ye Y, Gu J, Spitz MR and Wu X. PI3K/PTEN/AKT/mTOR pathway genetic variation predicts toxicity and distant progression in lung cancer patients receiving platinum-based chemotherapy. Lung cancer (Amsterdam, Netherlands). 2011; 71:82-88.
60. Li Q, Yang J, Yu Q, Wu H, Liu B, Xiong H, Hu G, Zhao J, Yuan X and Liao Z. Associations between single-nucleotide polymorphisms in the PI3K-PTEN-AKT-mTOR pathway and increased risk of brain metastasis in patients with non-small cell lung cancer. Clinical Cancer Research. 2013; 19:6252-6260.
61. Blagosklonny MV. Selective anti-cancer agents as anti-aging drugs. Cancer biology & therapy. 2013; 14:1092-1097.
62. Liberati A, Altman DG, Tetzlaff J, Mulrow C, Gøtzsche PC, Ioannidis JP, Clarke M, Devereaux PJ, Kleijnen J and Moher D. The PRISMA statement for reporting systematic reviews and meta-analyses of studies that evaluate health care interventions: explanation and elaboration. Annals of internal medicine. 2009; 151:W-65-W-94.
63. Wells G, Shea B, O’connell D, Peterson J, Welch V, Losos M and Tugwell P. (2000). The Newcastle-Ottawa Scale (NOS) for assessing the quality of nonrandomised studies in meta-analyses.
64. Thakkinstian A, McElduff P, D’Este C, Duffy D and Attia J. A method for meta-analysis of molecular association studies. Statistics in medicine. 2005; 24:1291-1306.
65. Higgins JP and Thompson SG. Quantifying heterogeneity in a meta-analysis. Statistics in medicine. 2002; 21:1539-1558.
66. DerSimonian R and Laird N. Meta-analysis in clinical trials. Controlled clinical trials. 1986; 7:177-188.
67. Mantel N and Haenszel W. Statistical aspects of the analysis of data from retrospective studies of disease. Journal of the National Cancer Institute. 1959; 22:719-748.
68. Begg CB and Mazumdar M. Operating characteristics of a rank correlation test for publication bias. Biometrics. 1994; 50:1088-1101.
69. Egger M, Davey Smith G, Schneider M and Minder C. Bias in meta-analysis detected by a simple, graphical test. BMJ (Clinical research ed). 1997; 315:629-634.
70. Xu Z and Taylor JA. SNPinfo: integrating GWAS and candidate gene information into functional SNP selection for genetic association studies. Nucleic acids research. 2009; 37:W600-W605.
71. Lee PH and Shatkay H. F-SNP: computationally predicted functional SNPs for disease association studies. Nucleic acids research. 2008; 36:D820-D824.
72. Holm K, Melum E, Franke A and Karlsen TH. SNPexp-A web tool for calculating and visualizing correlation between HapMap genotypes and gene expression levels. BMC bioinformatics. 2010; 11:600.
73. Lin J, Wang J, Greisinger AJ, Grossman HB, Forman MR, Dinney CP, Hawk ET and Wu X. Energy balance, the PI3K-AKT-mTOR pathway genes, and the risk of bladder cancer. Cancer Prevention Research. 2010; 3:505-517.
74. Campa D, Hüsing A, Stein A, Dostal L, Boeing H, Pischon T, Tjønneland A, Roswall N, Overvad K and Østergaard JN. Genetic variability of the mTOR pathway and prostate cancer risk in the European Prospective Investigation on Cancer (EPIC). PloS one. 2011; 6:e16914.