
INTRODUCTION
Prostate cancer is the most frequent type of cancer among males in developed countries and one of the leading causes of cancer mortality. The clinical course of prostate cancer is very heterogeneous and ranges from indolent to aggressive tumors. However, there is currently no way to safely distinguish patients who need treatment from those who do not. Therefore, it is crucial to find and characterize novel diagnostic and prognostic prostate cancer markers.
MicroRNAs (miRs) are ~19-22 nt short non coding RNAs, which are known to be regulators of gene expression. They are transcribed as primary miRs (pri-miRs) by RNA Polymerase II and are further processed to precursor miRs (pre-miRs) by DROSHA [1]. DICER1 cleaves them to mature miRs, which exert their functions by guiding the RNA induced silencing complex (RISC) with its catalytic component Argonaute (Ago) to RNAs in the cytoplasm, thereby inhibiting translation and degrading target RNA [1]. Deregulation of miRs is associated with various diseases including cancer, and it has been shown that miR abundances in tissue or serum of prostate cancer patients correlate with tumor aggressiveness [2], suggesting miRs as biomarkers for diagnosis, prognosis and response to therapy in prostate cancer [3–5].
Previously, we identified circulating miR-375 as a progression marker of prostate cancer [2]. MiR-375 abundance in serum of prostate cancer patients correlates with the Gleason Score and lymph node metastasis [6, 7], castration resistant metastatic prostate cancer [8], and poor prognosis [9]. In high-risk tumors, miR-375 levels along with prostate specific antigen (PSA) improved prediction accuracy compared to PSA alone [2]. MiR-375 has been described both as a tumor suppressor and an oncogene in various cancer entities (reviewed in [10]). However, despite the high consistency among several studies describing miR-375 as a suitable prostate cancer biomarker, its function in this tumor remains poorly understood [6, 11–13]. Thus, further efforts are needed to appropriately characterize the role of miR-375.
To fully understand the role of miR-375 in prostate cancer, it is necessary to identify its target genes. Because the accuracy of miR target prediction algorithms is low [14], and previous biochemical methods for identifying the targets of specific miRs are technically and analytically difficult [15–17], we used a combination of Ago-RIP-Seq and RNA-Seq following overexpression of miR-375 in PC-3 prostate cancer cells. We applied a novel analysis strategy based on generalized linear models for this experimental setup and integrated tissue data and gene ontology analysis (GO), to prioritize miR-375 target genes. We identified Polycomb complex member and tumor suppressor gene CBX7 as major miR-375 target. CBX7 repression induced malignant progression and provides a rationale for the tumor promoting role of miR-375 in vitro and in vivo.
RESULTS
Ago-RIP-Seq identifies miR-375 target genes
Functional miRs are incorporated into the Ago complex and bind to their target RNAs. To identify targets of miR-375, we overexpressed miR-375 in PC-3 cells (200-fold, Figure 1A), lysed them (total lysate (TL) miR-375 and TL control) after 48 h, and immunoprecipitated Ago complexes from total lysates with pan-Ago antibodies (Ago-IP) and from controls with isotype IgG antibodies (IgG-IP). As expected, miR-375 was enriched in the Ago-IP fractions of PC-3 miR-375 cells (12-fold compared to IgG-IP of PC-3 miR-375 cells and 74-fold compared to Ago-IP of PC-3 control cells, Figure 1B). The specificity of the Ago protein pulldown was confirmed by western blot (Figure 1C). The RNA extracts of the TL, Ago- and IgG-IP fractions of three independent Ago-IP experiments were analyzed by high-throughput sequencing (Ago-RIP-Seq), that yielded between 18.9 and 28.5 (median 23.7) million reads (Supplementary Table S1, E-MTAB-3691).
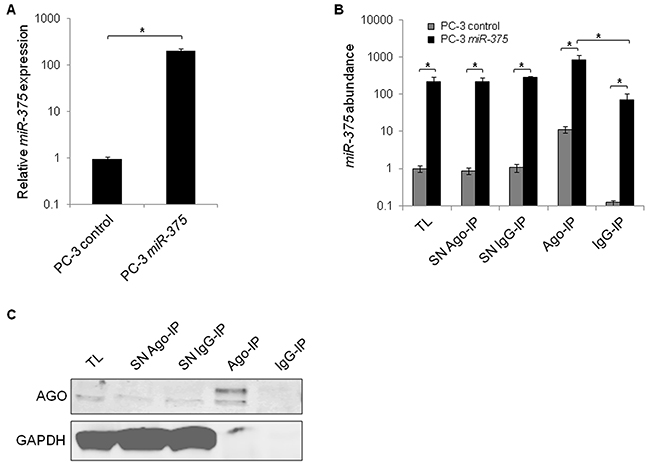
Figure 1: Enrichment of miR-375 and Ago protein in Ago-RIP-Seq. A. qRT-PCR analysis of miR-375 expression in PC-3 miR-375 and PC-3 control (empty vector transfection) cells. Relative miR-375 expression was adjusted to RNU6B. B. MiR-375 abundance in Ago-RIP fractions as measured by qRT-PCR. TL = total lysate, IP = immunoprecipitation, SN = IP supernatant. C. Specificity of Ago-IP demonstrated on western blot stained for Ago and GAPDH. Ago is pulled down, whereas GAPDH as negative control is not. All experiments were performed in three replicates. *P ≤ 0.05. All error bars show s.d.. Experiments were performed 48 h after transfection.
To statistically model the Ago-RIP-Seq experiment, we defined transfection of PC-3 cells with either miR-375 or control as the factor treatment with the levels miR-375 and control, respectively (Figure 2A). Immunoprecipitation (IP) was the second factor with the levels Ago, IgG, and TL. IgG and TL were used to adjust for background signals (Figure 1B). We then analyzed this two-factorial setup by fitting a generalized linear model (GLM) to the experimental design. We defined the comparisons Ago-IPIgG and Ago-IPTL to identify potential direct miR-375 targets (Figure 2B). As target expression is known to be reduced by miRs, in parallel, we also compared these RNA profiles with transcriptome changes after miR-375 overexpression using RNA-Seq (comparison lysate, Figure 2B, Supplementary Table S2). Potential miR-375 targets were defined by positive log2FC values in Ago-IPIgG and Ago-IPTL and negative log2FC in lysate (Figure 2B). The integration of Ago-RIP-Seq and RNA-Seq data yielded 3071 potential direct miR-375 targets (Supplementary Table S3), which is in accordance with other genome-wide miR target studies [18].
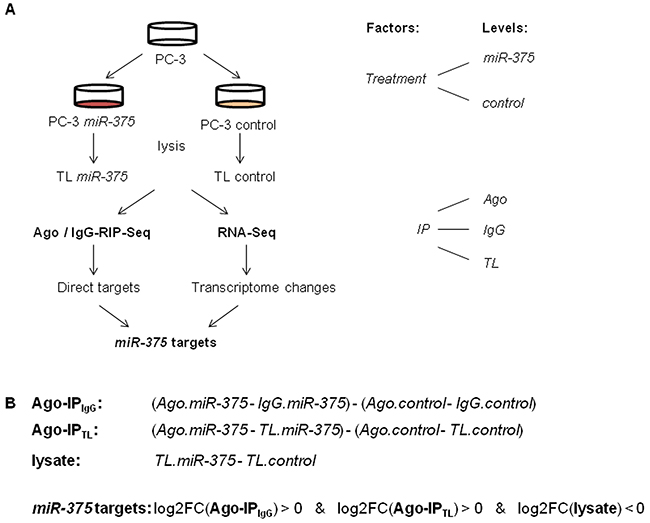
Figure 2: A. Experimental design of Ago-RIP-Seq and RNA-Seq to detect miR-375 targets. Lysis was performed 48 h after transfection. B. Comparisons calculated to detect potential direct miR-375 targets and transcriptomal changes, and definition of potential direct miR-375 targets.
Global analysis identifies genes regulated by the Polycomb repressive complex and tumor-promoting processes as major miR-375 targets
To globally investigate gene regulation by miR-375, we conducted gene set analysis (GSA) using the PIANO algorithm [19]. The gene sets BENPORATH_ES_WITH_H3K27ME3 (“H3K27me3 marked”) [20], BENPORATH_PRC2_TARGETS (“PRC2 targets”) [20], and KRAS.PROSTATE_UP.V1_DN (“KRAS”) [21] were top ranked, that is, highly regulated, in Ago-IPIgG (Supplementary Figure S1). These gene sets were also highly ranked in lysate (data not shown). As the Polycomb repressive complex 2 (PRC2) is known to transcriptionally silence targets by trimethylation of histones at H3 position K27, “H3K27me3 marked” and “PRC2 targets” are largely overlapping gene sets. PRC2 promotes oncogenic processes [22], while “KRAS” consists of genes downregulated in oncogenic KRAS G12 mutant expressing prostatic epithelial cells [21].
To further prioritize miR-375 targets for functional analysis, we selected genes being enriched at least 4-fold in the Ago-IP fractions and downregulated by a factor of at least 1.5 in the lysate of PC-3 miR-375 compared to PC-3 control (Supplementary Figure S2). As an additional selection criterion, due to the technical variance of lowly expressed genes, the expression of target genes were required to be represented by at least 8 counts per million (cpm) in each experiment. This prioritization yielded 121 direct miR-375 targets (Supplementary Table S4). The majority of these (88%) were protein coding genes. GO using Ingenuity pathway analysis (IPA) placed “cancer” (p = 0.0420 to 3.66 × 10⁻⁶), “cell cycle” (p = 0.0481 to 0.0013), “cell growth and proliferation” (p = 0.0434 to 0.0013), and “cell-to-cell signaling and interaction” (p = 0.0481 to 0.0013) among the most significantly associated GO categories. The gene coding for the MAP kinase signaling protein ERK, which regulates proliferation, migration and cell survival, was found to be the central node in the top network.
We next re-annotated our microarray data set (GSE29079), which consists of tumor (n = 47) and benign (n = 47) prostate tissue specimens showing differential miR-375 expression [2], according to the method described in [23], to enable assignment of signals to newly annotated transcripts including long noncoding RNAs (using Ensembl v75 and the long noncoding RNA collection of Cabili et al. [24]). The scaling method Jetta [25] was subsequently used for differential expression analysis between tumor and benign samples. Sixty-three of the top 121 direct miR-375 targets were downregulated in tumors overexpressing miR-375 by a factor of 2.9 (p = 1.46 × 10⁻¹⁶; Supplementary Table S4). These 63 genes were most prominently described by the GO network “cell proliferation”, and cell cycle regulator CCND1 was key upstream regulator (p = 0.0048). CCND1 was also significantly upregulated in PC-3 miR-375 compared to PC-3 control (1.4-fold, p = 0.03, Supplementary Table S2).
To validate these findings, we selected eleven genes (B3GNTL1, BCAS4, CBX7, CBY1, CHIC1, DNM1, EFHC1, MAN2C1, PTPMT1, RBL1, and TNS4), which are potential tumor-suppressors according to GO and a manual literature search and are predicted miR-375 target genes [26]. We quantified them by qRT-PCR using TL fractions of PC-3 miR-375 and PC-3 control cells as well as of LNCaP miR-375 and LNCaP control cells 48 h after transfection and observed reduced mRNA expression levels following miR-375 overexpression in all cases (Figure 3). Nine out of the eleven genes could be assigned to the pathway “cell cycle, cellular development, cancer” (Supplementary Figure S3).
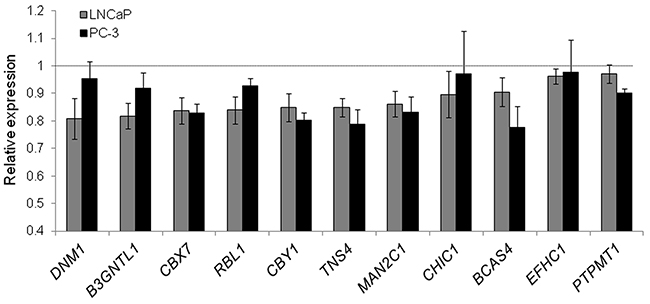
Figure 3: Validation of miR-375 targets in LNCaP and PC-3 cells by qRT-PCR. Relative expression of target RNAs in TL of LNCaP (grey) and PC-3 miR-375 (black) cells normalized to TL of LNCaP or PC-3 control cells, respectively, after adjustment to GAPDH. All experiments were performed in three replicates. All error bars show s.d.. Significant difference in the expression of all target genes in LNCaP miR-375/PC-3 miR-375 compared to LNCaP control/PC-3 control was observed (P ≤ 0.05), except for DNM1, CHIC1 and EFHC1 in PC-3 cells. Experiments were performed 48 h after transfection.
Potential miR-375 targets are validated by miR sponge technology
MiR sponges have recently been introduced as molecular tools validating direct miR targets [27]. As the sponges decoy miRs and hence reduce the pool of endogenous miRs able to repress their targets, direct targets of miRs are de-repressed upon sponge introduction into cells. To validate the potential miR-375 targets, we first tested the stability, specificity and functionality of miR-375 sponges. Transfecting a pREP4-GFP reporter construct with ten miR-375 binding sites in its 3’-UTR into PC-3 cells showed that sponge-mediated inhibition was favored over degradation: GFP protein was reduced by 51% (Figure 4A, Supplementary Figure S4), but GFP mRNA was decreased by only 18% (Figure 4B) 48 h after transfection. The miR-375 sponges were specific, because translation was repressed by endogenous miR-375 leading to lower GFP signal relative to the control sponge when sponge plasmids were expressed GFP at subsaturating levels 48 h after transfection (Figure 4C). The specificity of sponge repression by miR-375 was further confirmed by sponge inhibition after ectopic miR-375 expression 48 h after transfection (Figure 4D). To test the functionality of the sponges, we cloned an artificial miR-375 target containing two complementary miR-375 binding sites into a pMirGlo luciferase reporter vector and measured its de-repression upon miR-375 sponge introduction after 48 h. The artificial target was de-repressed by the miR-375 sponge (1.4-fold) compared to the control sponge demonstrating that the sponges were functional 48 h after transfection (Figure 4E).
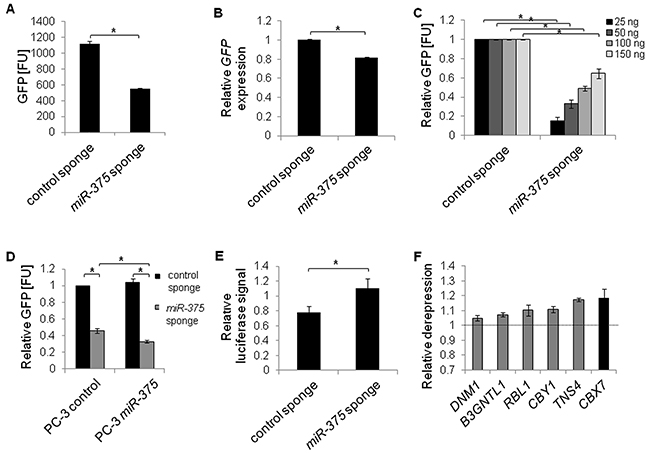
Figure 4: MiR-375 target validation by miR sponges in PC-3 cells. A and B. Stability of miR-375 sponges was confirmed by measuring GFP protein (A) or mRNA expression (B), from pREP4-GFP sponge plasmids. FU = fluorescence units. C and D. Specificity of miR-375 sponges. GFP protein levels (FU) from varying concentrations of sponge plasmids with endogenous miR-375 (C), and following overexpression of miR-375 (D). E. Functionality of miR-375 sponges. Relative luciferase signal of pMirGlo-miR-375-target luciferase reporter following miR-375 sponge or control sponge introduction, respectively, was adjusted to the Renilla signal and normalized to a non-targeting control. F. Derepression of miR-375 targets following expression of miR-375 sponge compared to control sponge. GAPDH served as internal control. All differences between miR-375 sponge and control sponge in F were statistically significant (*P ≤ 0.05). All experiments were performed in three replicates. *P ≤ 0.05. All error bars show s.d. Measurements were performed 48 h after transfection.
After confirming stability, specificity and functionality of the miR-375 sponges, we measured the expression of miR-375 target genes in PC-3 cells transfected with either the miR-375 or control sponge, focusing on the six miR-375 target genes that showed the strongest downregulation in the qRT-PCR measurements in LNCaP miR-375 cells (Figure 3). Ectopic expression of miR-375 sponges in PC-3 cells resulted in upregulation of all six tested genes (B3GNTL1, CBX7, CBY1, DNM1, RBL1, TNS4 Figure 4F) compared to the control sponge. We therefore defined these genes as the top validated miR-375 targets. Among these, CBX7 (chromobox homolog 7; Polycomb repressive complex member) exhibited the highest deregulation (1.2-fold). The observed degree of deregulation upon sponge induction is in accordance with the effects observed by Ebert et al. [27], who established the sponge technology.
MiR-375 enhances prostate cancer progression in vitro and in vivo
We hypothesized that miR-375 might exert a tumor-promoting role in prostate cancer for the following reasons: 1) The newly identified miR-375 targets were linked to tumor promoting networks, 2) miR-375 expression levels are enriched in prostate cancer compared to normal tissue [2], and 3) serum and tissue levels correlate with prostate cancer progression [2, 7].
We first tested whether miR-375 expression was elevated in prostate cancer cell lines LNCaP, DU145, PC-3, and VCaP (all derived from metastatic tissues) compared to the normal prostate cell line RWPE-1. MiR-375 was significantly enriched in all tumor cell lines, LNCaP (4.1-fold, p = 1.69 × 10⁻²), DU145 (6.7-fold, p = 0.0031), PC-3 (12.4-fold, p = 0.0012) and VCaP (1341.8-fold, p = 1.34 × 10⁻⁶), compared to RWPE-1 cells (Figure 5A). Thus, the in vitro data were consistent with the elevated levels of miR-375 in aggressive tumors [2]. To examine the effect of miR-375 enrichment in prostate cancer cells, we performed cellular assays after transient miR-375 overexpression. PC-3 and LNCaP cells overexpressing miR-375 had a higher proliferation rate compared to controls (1.3-fold, p = 1.9 × 10⁻⁶, and 1.8-fold, p = 2.3 × 10⁻⁷, respectively, Figure 5B, Supplementary Figure S5A) as well as increased migration (1.5-fold, p = 0.05, Figure 5C) and invasion (1.5-fold, p = 8.9 × 10⁻³, Figure 5D) of PC-3 cells 96 h after transfection.
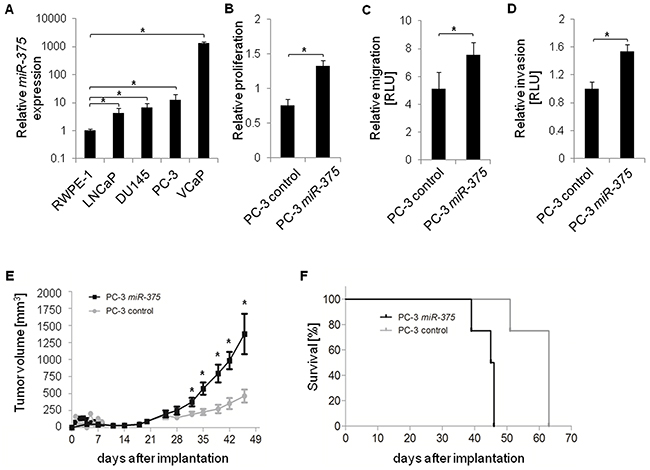
Figure 5: Functional analysis of miR-375 in vitro and in vivo. A. Relative miR-375 expression in various prostate cancer cell lines (LNCaP, DU145, PC-3, and VCaP) compared to control cells (RWPE-1). B-D. Relative proliferation (B), migration (C), and invasion (D) of PC-3 control cells and following miR-375 overexpression. Proliferation, migration and invasion were measured 96 h, 48 h and 48 h after transfection, respectively. RLU = Relative Light Units. Experiments of A-D were performed in three replicates, with the exception of the invasion assay which was performed in four replicates. Error bars of A-D show s.d. *P ≤ 0.05. Proliferation, migration and invasion rates were measured 96 h after transfection. E and F. Tumor growth (E) and survival rate (F) in xenograft mice (n = 8 per subclone, total of 16 mice) following implantation of control PC-3 cells or PC-3 miR-375 cells. Survival was defined as neither died nor having reached a tumor volume of 1500 mm3, where mice were sacrificed. Error bars of E show s.e.m. *P ≤ 0.05.
To examine whether tumorigenic processes are activated, we used the RNA-Seq data set obtained from TL of PC-3 miR-375 and PC-3 control (Supplementary Table S2) to conduct GO analyses of genes upregulated (> 2-fold) in PC-3 miR-375. MAPK1 (p = 0.0089) and the PI3K complex (p = 0.0402) were the most highly activated upstream regulators, consistent with the network analysis identifying PI3K/AKT, MAPK, TGFB, and JNK as central signaling pathways of upregulated genes (data not shown). These are all known to play important roles in tumor cell proliferation, migration and invasion.
To test the oncogenic effect of miR-375 in vivo, PC-3 miR-375 and PC-3 control cells were each injected into eight NMRI nu/nu mice, and tumor growth was monitored twice a week for 46 days. Thirty-two days after injection, the tumor volumes were significantly higher (p = 0.0148, 1.9-fold) in mice with PC-3 miR-375 and were further increased to 3.0-fold at 46 days after injection (p = 0.0283, Figure 5E, Supplementary Figure S5B, C). On day 39, the survival rate of mice with PC-3 miR-375 decreased to 75%, and none of these mice survived day 47 (Figure 5F). In contrast, all PC-3 control mice survived day 47, and a 75% survival rate was only reached 51 days after injection. The remaining PC-3 control mice died at day 63. Thus, survival of mice with PC-3 miR-375 was significantly lower than those with PC-3 control (median survival rates 45.5 days and 63 days, respectively, p = 0.0001, Log-rank test). Survival was defined as neither died nor having reached a tumor volume of 1500 mm3, where mice were sacrificed.
Taken together, the oncogenic role of miR-375 in prostate cancer was confirmed by GO analysis and functional assays, as miR-375 enhanced proliferation, migration and invasion in vitro. Moreover, the xenograft model demonstrated that miR-375 enhances tumor growth and progression and reduces survival in vivo.
The miR-375 target CBX7 is associated with prostate cancer progression and tumor specific death
To elucidate the oncogenic role of miR-375 in prostate cancer on the cellular level, we focused on the miR-375 target Polycomb repressive complex member CBX7 because it was de-repressed the strongest of the top six validated target genes by miR-375 sponges (factor 1.2, Figure 4F), and because GSA showed the involvement of miR-375 in Polycomb regulation (Supplementary Figure S1). Finally, CBX7 is proposed to play an anti-oncogenic role as measured by proliferation [28], and invasion [29], and CBX7 loss results in highly malignant phenotypes and poor prognoses in other entities (colon, bladder, pancreas, breast, liver and lung cancer) [30–34]. Consistent with this, and with the strong downregulation in our data (to 71%; p = 7.6 × 10⁻¹⁰, GSE29079) as well as two validation prostate cancer tissue data sets (TCGA, Supplementary Figure S6A; Taylor et al., GSE21032), we hypothesized that the tumor-promoting role of miR-375 might be explained by targeting CBX7. To confirm the direct targeting of CBX7 by miR-375, we cloned the 3’-UTR of CBX7 into a luciferase reporter vector and measured the degree of signal reduction following miR-375 overexpression in PC-3 cells after 48 h. The luciferase signal was significantly reduced by 26% (p = 0.0217, Figure 6A) in the miR-375-overexpressing cells, but not in those with the deletion control (lacking the miR-375 binding sequence AUACGUGGGGUGGGUCUGGACAAGG), the non-targeting control or the empty vector. In contrast, the luciferase signal in cells expressing the positive control, an artificial miR-375 target harboring two miR-375 binding sites, was repressed following miR-375 expression. Moreover, in silico analysis of the free binding energy [35] between miR-375 and CBX7 confirmed strong binding of miR-375 to the 3’-UTR of CBX7 (- 26.7 kcal/mol). The miR-375 binding site is depicted in Supplementary Figure S6B.
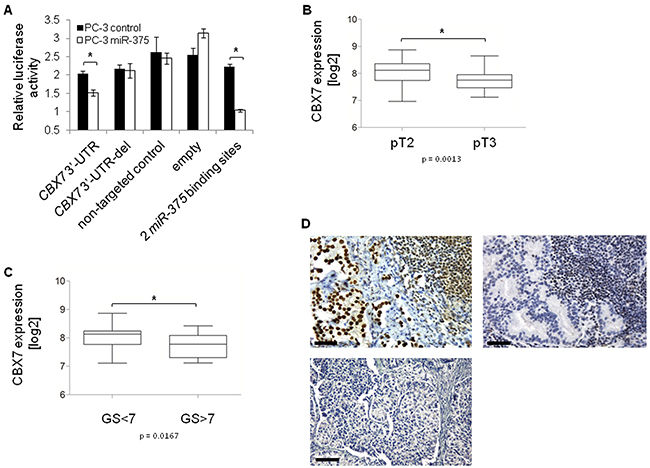
Figure 6: CBX7 is a major target of miR-375 in prostate cancer. A. Luciferase signal assay confirms that CBX7 is a direct target of miR-375. The experiment was performed in two replicates with quadruplicates. Error bars of A show s.d.. *P ≤ 0.05. The luciferase assay was performed 48 h after transfection. B. CBX7 expression is decreased in pT3 (n = 38) compared to pT2 (n = 54) tissues, and C. lower in GS>7 (n = 12) compared to GS<7 (n = 27) tissues (GSE29079). Error bars of B and C show s.e.m. *P ≤ 0.05. D. Tissue microarray with CBX7 immunohistochemical staining of 58 lymph node metastases. CBX7 staining is positive in 17 [29.3%] (upper panel, left), but negative in 41 [70.7%] (upper panel, right) lymph node metastases. 20x magnification, scale bar = 50 µm. The lower panel shows the negative control (only secondary antibody). 10x magnification, scale bar = 100 µm.
As we hypothesized that miR-375 mediated prostate cancer progression might be explained by its targeting of CBX7, we examined the associations between CBX7 expression in prostate cancer tissue samples and tumor status and Gleason Scores (GSE29079). CBX7 expression was significantly lower in advanced tumor stages (pT3 vs. pT2, p = 0.0013, Figure 6B) and in tumors with high (> 7) compared to low (< 7) Gleason Scores (p = 0.0167, Figure 6C). Dividing patients into subgroups with Gleason Score < 7 and > 7 was performed to clearly distinguish low risk from high risk patients.
Notably, CBX7 expression was also decreased in pT3 vs. pT2 and Gleason Score > 7 vs. < 7 tumors in an independent data set published by Taylor et al. (GSE21032). Hence, CBX7 was expressed inversely to miR-375 in advanced tumors. In parallel, we investigated CBX7 expression in lymph node metastases from 58 prostate cancer patients by tissue microarray. We found that the majority of lymph node metastases (70.7%, n = 41) did not express CBX7 (Figure 6D). CBX7 absence in lymph node metastases was independent from the CBX7 status of the primary prostate cancer samples of the same patients (p = 0.530, Pearson Chi2 test, two-sided, Supplementary Table S5). These data were in accordance with the high expression of miR-375 in lymph node metastasized prostate carcinoma [7]. In addition, CBX7 was not expressed in > 90% (11 of 12) of patients who had died of the tumor (median survival time: 40 months), but was not expressed in only 55% (11 of 20) of patients with no tumor specific death (median survival time: 75 months) (p = 0.03, Pearson Chi2 test, two-sided). Notably, the negative control (only secondary antibody) showed that the background was zero (Figure 6D).
Taken together, these data suggest that the oncogenic properties of miR-375 might be explained by its targeting of CBX7, as CBX7 expression was significantly decreased in primary tissues with high Gleason Scores and in those with advanced tumor stages. Furthermore, CBX7 absence was also associated with lymph node metastases and prostate cancer specific death.
Repression of CBX7 by miR-375 leads to upregulation of CBX8 and activation of transcriptional programs associated with malignant progression
CBX2, 7, and 8 are mutually exchangeable subunits of PRC1 [36]. Loss of CBX7 leads to higher abundances of CBX2 and CBX8, and preferential incorporation of CBX8 (and to a lesser extent CBX2) into PRC1 [36]. Therefore, we hypothesized that miR-375 might regulate the sensitive and dynamic equilibrium of CBX7 and CBX8 expression, which is known to impact transcriptional programs in development and cancer [36–38]. To this end, we investigated the expression of CBX genes in PC-3 cells overexpressing miR-375. CBX2 and CBX8 were upregulated in our RNA-Seq data of PC-3 miR-375 by 2.1-fold and 365-fold, respectively 48 h after transfection (Figure 7A, Supplementary Table S2). Furthermore, there was a clear inverse relationship between CBX7 and CBX8 (and to a minor extent CBX2) mRNA expression levels of tumor and normal samples in the TCGA tumor data set overexpressing miR-375 (Supplementary Figure S6A). The Pearson correlation analyses of miR-375/CBX7, CBX7/CBX8, and CBX7/CBX2 showed that CBX7 was significantly negative co-expressed to miR-375 (r = - 0.58, p < 0.0001, Supplementary Figure S6C), CBX8 (r = - 0.33, p < 0.0001, Supplementary Figure S6D), and CBX2 (r = - 0.34, p < 0.0001; Supplementary Figure S6E). These data were further corroborated in the data set published by Taylor et al. (GSE21032) showing significant downregulation of CBX7 (p = 7.00 × 10⁻¹³), and upregulation of CBX8 (p = 0.0031) as well as miR-375 (p = 6.36 × 10⁻⁷, data not shown). To investigate whether CBX7 loss leads to upregulation of CBX8 in prostate cancer cells, we transfected LNCaP cells with siRNAs against CBX7, thereby emulating the effect of miR-375 de-repression. CBX7 knockdown was confirmed by both qRT-PCR analysis and western blot 48 h after transfection (Figure 7B, 7C). As expected, all three CBX7 siRNAs resulted in loss of CBX7 and significantly increased levels of CBX8 mRNA (Figure 7B) and protein (Figure 7C). Notably, even small changes in CBX7 and CBX8 expression affect the sensitive and dynamic equilibrium of CBX7 and CBX8 [36, 37]. We concluded that miR-375-mediated CBX7 repression upregulates CBX8, thereby influencing the critical levels of CBX7 and CBX8 in PRC1 needed for distinct transcriptional programs.
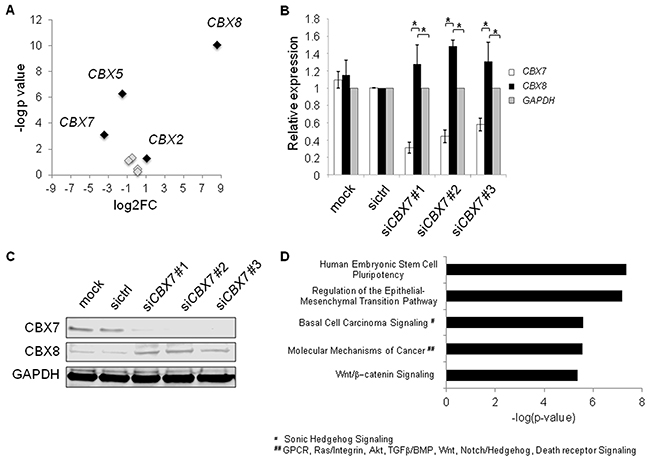
Figure 7: A. Expression of CBX genes in RNA-Seq data of miR-375 overexpressing PC-3 cells. MiR-375 regulated CBX genes (> 2-fold) are highlighted in black, whereas non-regulated CBX genes are depicted in grey. B and C. Knockdown using siCBX7 leads to enforced CBX8 expression in LNCaP cells on RNA (B), and protein (C) levels compared to mock or sictrl transfection. GAPDH was used as control. D. Top activated pathways of CBX7 targets following CBX7 knockdown in LNCaP cells as identified by microarray analysis. Experiments were performed in triplicates. *P ≤ 0.05. Error bars show s.d. Experiments were performed 48 h after transfection.
We next analyzed the molecular signatures following CBX7 silencing in prostate cancer cells after 48 h using global microarray analysis. We integrated known CBX7 targets [36, 37] with genes upregulated following CBX7 knockdown in LNCaP cells from the microarray analysis (Supplementary Table S6, E-MTAB-3730) and found activation of prominent cancer pathways such as epithelial to mesenchymal transition (EMT) and Wnt/β-catenin signaling pathways (Figure 7D). We also integrated known CBX7-regulated genes with genes overexpressed upon miR-375 in the RNA-Seq data set (Supplementary Table S2), and found the same activated pathways (Supplementary Figure S7), indicating that the activation of these pathways by CBX7 knockdown is mediated by miR-375 in prostate cancer cells. Taken together, these data suggest that miR-375 leads to the activation of oncogenic signatures and tumor progression by targeting CBX7.
DISCUSSION
The aim of this study was to characterize the promising prostate cancer progression marker miR-375. MiRs are assumed to regulate the majority of transcripts within a cell, and hence deregulation of miRs is frequently implicated in diseases including cancer. A key for understanding the role of a specific miR in tumorigenesis is the identification of its target genes. Several crosslinking-based, immunoprecipitation methods to profile miR:target binding have been developed in recent years [39, 40]. These genome-wide analyses have shown that canonical targeting rules like miR binding to the 3’-UTR of a target RNA or seed complementarity might apply to only a fraction of miR:mRNA interactions [15] and may thus explain the low accuracy of commonly used miR target prediction programs. Our Ago-RIP-Seq approach after miR overexpression was designed to overcome this limitation. It is also more precise than transcriptomic profiling after miR overexpression alone as the latter cannot dissect primary from secondary targets or indirect target modulation. Moreover, compared to the array-based Ago-RIP-Chip technology [18], Ago-RIP-Seq is more sensitive, does not rely on prior annotation of transcripts, and enables the identification of all RNA classes, including noncoding and antisense RNAs. This is important, as recent studies have shown that noncoding RNAs can be targeted by miRs and thereby affect tumorigenesis [41]. In addition, our vector-based overexpression of the miR at physiological concentrations overcomes the limitations of approaches relying on mimic miRs [16], where the degree of incorporation into functional Ago complexes as well as the extent of off-target effects due to supra-physical miR levels are unknown [42]. MiR overexpression in the physiological range can be assumed when the resulting miR levels do not exceed the abundance of the most highly expressed miR in the cell. In PC-3 cells, endogenous miR-99a was expressed 6-fold higher than overexpressed miR-375 (data not shown). Hence, we considered the overexpression as physiological. To correct for unspecific IP binding as well as secondary transcriptomic changes, that contribute to the high intrinsic noise of IP experiments [17, 43], we established a new experimental approach and sequenced total lysates as well as control isotype IgG-IP fractions of both miR overexpressing and control cells. We also devised a novel universal data analysis strategy for this two-factorial setup.
To prioritize novel potential miR-375 targets for functional characterization, we selected targets enriched in Ago-RIP fractions and decreased in total lysate fractions following miR-375 overexpression, and integrated tissue gene expression data, GSA and GO analysis, as well as literature searches. These analyses indicated a role of miR-375 in oncogenic processes via the regulation of genes involved in Polycomb complex mediated transcriptional control. In particular, Polycomb target genes carrying H3K27me3 marks were highly regulated by miR-375. We identified the upstream regulator and Polycomb group member CBX7 as a major target of miR-375. CBX7 encodes a PRC1 subunit, which is involved in gene repression by guiding PRC1 to PRC2-methylated (H3K27me3) promoters [44]. We reasoned that the widespread oncogenic gene expression changes mediated by miR-375 may be explained by its ability to repress CBX7. In support of this hypothesis, we observed strong CBX7 depletion in TL of miR-375 cells, high enrichment in Ago-IP fractions, and the highest de-repression of the top six validated targets following miR-375 sponge expression. In silico analysis and luciferase reporter assays in PC-3 cells confirmed the direct binding of miR-375 to the 3’UTR of CBX7 RNA. CBX7 expression was significantly decreased in tumors with a high Gleason Score, and in those, which extended through the prostate capsule, and hence showed an inverse expression pattern to miR-375. These observations were in concordance with the enhanced migration and invasion of miR-375 overexpressing prostate cancer cells. In contrast, CBX7 decreased invasion [29] and is proposed to be involved in cellular processes implicated in migration [45]. Moreover, we observed CBX7 loss in lymph node metastases and showed that this correlates with prostate cancer specific death. These findings are in agreement with other studies in colon [30], bladder [31], pancreatic [32], breast [33], gastric [46], thyroid [47], liver and lung [34] cancers, in which the loss of CBX7 is correlated with a highly malignant phenotype and the retention of CBX7 expression with a longer survival of colon [30] and pancreatic cancer patients [32]. The tumor-suppressing role of CBX7 has also recently been shown in Cbx7 knockout mice [34]. In lung cancer, CBX7 restoration resulted in decreased proliferation and increased apoptosis [48]. Moreover, in breast cancer, low expression of CBX7 may serve as prognostic marker [49]. Of note, these findings are in contrast to a study where an oncogenic role for CBX7 was suggested [50]. However, this finding was based on the observation of notable growth arrest in CBX7 knockdown LNCaP cells, which could neither be seen in other prostate cancer cell lines nor after CBX7 overexpression in LNCaP cells [45].
MiR-375-mediated repression of CBX7 leads to higher levels of CBX8 in prostate cancer cells. This was supported by downregulation of CBX7 and upregulation of CBX8 in miR-375 overexpressing prostate tissues. PRC1 containing either CBX7 or CBX8 is well known to modulate different developmental processes: For example, the exchange of CBX7 to CBX8 induces distinct transcriptional programs and differentiation processes in hematopoetic and embryonic stem cells [36, 37]. The balance of CBX7 and CBX8 expression is also known to play an important role in glioblastoma where CBX7 is depleted and CBX8 is abundantly expressed [51]. In agreement with this, other studies on colon [52], esophageal [53] and breast cancer [54] found that PRC1 containing CBX8 mediates oncogenic properties. Notably, a recent study in prostate cancer indicated that CBX2- and CBX8-containing PRC1 promotes the progression of prostate cancer to a highly aggressive neuroendocrine tumor subtype [55]. To investigate the molecular signatures induced by CBX7 repression in prostate cancer cells, we performed expression profiling following siCBX7 knockdown and integrated our data with known CBX7 targets [36, 37]. We found that pathways commonly deregulated in cancer such as the EMT and Wnt/β-catenin signaling pathways were activated. CBX7 is capable of upregulating E-cadherin [56] indicating that it plays a critical role in later stages of cancer progression [47]. These data are also in line with a previously published study showing that CBX7 inhibits tumor progression by repression of the Wnt/β-catenin pathway in breast cancer [57]. When we compared the expression profiles of gene upregulated following miR-375 overexpression with the known CBX7 targets, we found the same pathways, indicating that the activation of these oncogenic signatures by CBX7 repression is influenced by miR-375. Hence, we reason that miR-375 exerts its oncogenic properties by targeting CBX7 and thus regulating important cancer pathways. This is in agreement with the increased expression of miR-375 in prostate cancer compared to normal tissues as well as in the prostate cancer cells DU-145, VCaP, LNCaP and PC-3 compared to benign RWPE-1 cells. It is also supported by our finding that overexpression of miR-375 leads to enhancement of proliferation, migration and invasion in vitro, induction of tumor growth and progression as well as reduced survival in vivo.
Our data suggest that targeting the Polycomb complex regulated epigenome might be a reasonable strategy to inhibit prostate cancer progression [58]. This could be achieved by either employing the tumor suppressive role of CBX7, as it has been proposed for breast cancer [57], or by controlling miR-375 levels. To this end, it has been shown that a miR-based therapy is promising in an in vivo preclinical prostate cancer model (reviewed in [59]). MiR-375 sponges, which we have shown to inhibit miR-375 and to de-repress CBX7 in vitro, may potentially be applied in vivo. Recent reports have provided encouraging data for the successful application of the miR sponge technology to inhibit oncomiRs in vivo, thereby preventing metastasis formation [60].
MATERIALS AND METHODS
Cell lines
The cell lines LNCaP (CRL-1740) and PC-3 (CRL-1435) were purchased from ATCC between 2012 and 2013, and cultured according to manufacturer’s instructions. Their identity was verified by SNP profiling conducted at Multiplexion GmbH.
Xenograft model
This xenograft study was carried out in accordance with the recommendations in the Guide for the Care and Use of Laboratory Animals of the Society of Laboratory Animals (GV SOLAS). All animal experiments were approved by the Committee on the Ethics of Animal Experiments of the regional council (Regierungspräsidium Freiburg, Permit Number: G-13/13). Xenografts were established by subcutaneous injection of 5 × 10⁶ PC-3 miR-375 or PC-3 control cells into the left flank of male NMRI nu/nu mice, respectively (n = 8 per subclone, total of 16 mice; Harlan, Denmark). Tumor growth and body weight were recorded twice a week for 46 days. Tumor growth was followed by serial caliper measurement. Tumor volumes were calculated by using the formula (a × b2)/2, where length (a) was the largest dimension and width (b) the smallest dimension perpendicular to the length. When mice had not died yet, and individual tumors reached a volume of 1500 mm3 the mice were sacrificed and tumors were harvested. Values are prepresented as mean ±SEM.
Pre-miR-375 cloning
For miR-375 overexpression, pre-miR-375 was amplified from a DNA pool containing equal amounts of LNCaP, PC-3, H1299, DU145, A549, H1650 and H1975 DNA with the primers pre-miR-375_KpnI_F1 and pre-miR-375_BamHI_R1 listed in Supplementary Table S7. Amplicons were cloned into the KpnI/BamHI-linearized episomal expression vector pREP4 (Invitrogen) generating the pREP4_miR-375 vector. The pre-miR:vector clone was confirmed by Sanger sequencing (GATC Biotech AG, Konstanz, Germany) using pREP fwd, pREP rev and EBV reverse primer, respectively (Supplementary Table S7).
MiR-375 sponge generation
MiR-375 sponge cloning was performed using a single directional ligation into the nonpalindromic SanDI site of the pREP4 vector as previously described [61]. As the episomal expression vector pREP4 harboring GFP contains multiple SanDI sites in the vector backbone, we first used the pcDNA3.1(+) vector for sponge subcloning after introducing a SanDI site into pcDNA3.1(+) using a linker and the NheI and XhoI sites. Vector:miR binding site duplex ligation using a ratio of 1:1000 generated clones with various numbers of miR-375 binding sites. The clones with ten miR-375 binding sites (which has been suggested to be optimal for sponge function [61]) were used for consecutive subcloning into the 3’-UTR of GFP within the pREP4 expression vector via the NheI and XhoI sites. As a negative control, we used the non-miR-target sequence described by Ebert et al. [27] for cloning into the 3’-UTR of GFP within the pREP4 expression vector. Linker sequence and miR binding site duplexes are provided in Table S7. Correct sponge cloning was verified by Sanger sequencing (GATC; Supplementary Table S7).
Ago immunoprecipitation (Ago-IP)
Ago-IP was performed as previously described [17] with the following modifications: cell lysates were incubated with Protein G Sepharose beads (GE Healthcare Europe GmbH) 48 h after transfection for preclearing. Anti-pan-Ago antibody 2A8 (10 µg, Abcam) or IgG1 isotype control G3A1 (Cell Signaling) were coupled to the beads; and IP was performed overnight rotating at 4 °C. Ago-IPs were performed in three independent biological replicates.
Library generation
cDNA libraries were generated from RNAs of the TL, Ago and IgG IP fractions by using the SMARTer Stranded Total RNA Sample Prep Kit (Takara Clontech). The samples (50 bp) were paired-end sequenced on an Illumina HiSeq 2000 sequencer. We obtained between 18.9 and 28.5 (median 23.7) million reads (Supplementary Table S7). Detailed information is given in the Supplementary Material and Methods.
Bioinformatic data analysis
Paired-end sequencing reads were mapped to the human reference genome (hg19) using STAR aligner (version 2.3.1z4). Read counts were calculated by HTSeq-count (version 0.6.0.) Parameter details are provided in the Supplementary Material and Methods.
Statistical modeling and analysis of differential Ago-RIP-Seq and RNA-Seq data sets
We normalized the Ago-RIP-Seq and RNA-Seq count data using the Trimmed Mean of M values “TMM” approach [62] within the edgeR package, as recommended for these types of experiments [63, 64], and fitted a negative binomial model to the read counts using the statistical pipeline of edgeR, R version 3.0.2. The negative binomial model is a widely used approach for RNA-Seq or related (e.g. RIP-Seq [65]) data. In parallel, we fitted a GLM to the resulting experimental design. The identification of direct miR-375 targets was achieved by using the concept of linear contrasts, that is, linear combinations of the factor-levels:
Following miR-375 overexpression, the fraction of miR-375 and its targets is increased in the Ago complex. As there are still many other miR:target pairs associated with Ago, adjustments of the Ago-IP of PC-3 miR-375 to the Ago-IP of PC-3 control was required to result in highly enriched miR-375:target pairs. To further reduce the noise in the RIP-Seq experiment [43] due to unspecific RNA binding to sepharose beads, the Ago-IP fractions were adjusted to IgG-IP (Ago-IPIgG) before comparing the Ago-IP of PC-3 miR-375 with the Ago-IP of PC-3 control as follows:
(Ago.miR-375 – IgG.miR-375) – (Ago.control – IgG.control) [Ago-IPIgG]
In addition, miR overexpression leads to widespread secondary changes within the gene expression profiles, which might impact the IP profiles [17]. Thus, it was also important to adjust the levels of RNAs detected in the Ago-IP fractions to their expression levels measured in the total lysates (Ago-IPTL) as follows:
(Ago.miR-375 – TL.miR-375) – (Ago.control – TL.control) [Ago-IPTL ]
Moreover, as miR targets are decreased after miR expression, we also defined the comparison lysate for identifying whole transcriptomal changes, as follows:
(TL.miR-375 – TL.control) [lysate]
The contrasts Ago-IPIgG, Ago-IPTL and lysate define the type of comparison between factor levels. Their corresponding regression coefficients due to linear model fitting reflect the estimated fold change value (on log2 scale). Likelihood-ratio tests were applied for testing the regression coefficient on zero. Resulting p-values are Benjamini-Hochberg adjusted. Genes with an average count per million less than 1 were excluded from the analysis.
Statistical analysis
If not stated otherwise, two-sided unpaired t-tests were performed to determine whether there were significant differences between treatments and their corresponding controls. A P ≤ 0.05 was indication of a statistically significant difference. All values presented as the mean±SD.
Accession numbers
Sequencing data and microarray data are deposited under ArrayExpress accession numbers E-MTAB-3691 and E-MTAB-3730, respectively.
ACKNOWLEDGMENTS
We thank Sabrina Gerhardt for excellent technical assistance and Sabine Klauck for critical reading of the manuscript. We gratefully acknowledge the Genomics and Proteomics Core Facility at DKFZ for high-throughput sequencing and microarray profiling.
FUNDING
This study was supported by DKFZ internal funding.
CONFLICTS OF INTEREST
The authors have no conflict of interest.
REFERENCES
1. Bartel DP. MicroRNAs: genomics, biogenesis, mechanism, and function. Cell. 2004; 116:281-297.
2. Brase JC, Johannes M, Schlomm T, Falth M, Haese A, Steuber T, Beissbarth T, Kuner R and Sultmann H. Circulating miRNAs are correlated with tumor progression in prostate cancer. International journal of cancer. 2011; 128:608-616.
3. Endzelins E, Melne V, Kalnina Z, Lietuvietis V, Riekstina U, Llorente A and Line A. Diagnostic, prognostic and predictive value of cell-free miRNAs in prostate cancer: a systematic review. Molecular cancer. 2016; 15:41.
4. Fabris L, Ceder Y, Chinnaiyan AM, Jenster GW, Sorensen KD, Tomlins S, Visakorpi T and Calin GA. The Potential of MicroRNAs as Prostate Cancer Biomarkers. European urology. 2016.
5. Filella X and Foj L. miRNAs as novel biomarkers in the management of prostate cancer. Clinical chemistry and laboratory medicine. 2016.
6. Costa-Pinheiro P, Ramalho-Carvalho J, Vieira FQ, Torres-Ferreira J, Oliveira J, Goncalves CS, Costa BM, Henrique R and Jeronimo C. MicroRNA-375 plays a dual role in prostate carcinogenesis. Clinical epigenetics. 2015; 7:42.
7. Hart M, Nolte E, Wach S, Szczyrba J, Taubert H, Rau TT, Hartmann A, Grasser FA and Wullich B. Comparative microRNA profiling of prostate carcinomas with increasing tumor stage by deep sequencing. Molecular cancer research. 2014; 12:250-263.
8. Watahiki A, Macfarlane RJ, Gleave ME, Crea F, Wang Y, Helgason CD and Chi KN. Plasma miRNAs as Biomarkers to Identify Patients with Castration-Resistant Metastatic Prostate Cancer. International journal of molecular sciences. 2013; 14:7757-7770.
9. Huang X, Yuan T, Liang M, Du M, Xia S, Dittmar R, Wang D, See W, Costello BA, Quevedo F, Tan W, Nandy D, Bevan GH, Longenbach S, Sun Z, Lu Y, et al. Exosomal miR-1290 and miR-375 as prognostic markers in castration-resistant prostate cancer. European urology. 2015; 67:33-41.
10. Yan JW, Lin JS and He XX. The emerging role of miR-375 in cancer. International journal of cancer. 2014; 135:1011-1018.
11. Tiryakioglu D, Bilgin E, Holdenrieder S, Dalay N and Gezer U. miR-141 and miR-375 induction and release are different from PSA mRNA and PCA3 upon androgen stimulation of LNCaP cells. Biomedical reports. 2013; 1:802-806.
12. Choi N, Park J, Lee JS, Yoe J, Park GY, Kim E, Jeon H, Cho YM, Roh TY and Lee Y. miR-93/miR-106b/miR-375-CIC-CRABP1: a novel regulatory axis in prostate cancer progression. Oncotarget. 2015; 6:23533-23547. doi: 10.18632/oncotarget.4372.
13. Szczyrba J, Nolte E, Wach S, Kremmer E, Stohr R, Hartmann A, Wieland W, Wullich B and Grasser FA. Downregulation of Sec23A protein by miRNA-375 in prostate carcinoma. Molecular cancer research. 2011; 9:791-800.
14. Thomas M, Lieberman J and Lal A. Desperately seeking microRNA targets. Nature structural & molecular biology. 2010; 17:1169-1174.
15. Helwak A, Kudla G, Dudnakova T and Tollervey D. Mapping the human miRNA interactome by CLASH reveals frequent noncanonical binding. Cell. 2013; 153:654-665.
16. Tan SM, Kirchner R, Jin J, Hofmann O, McReynolds L, Hide W and Lieberman J. Sequencing of captive target transcripts identifies the network of regulated genes and functions of primate-specific miR-522. Cell reports. 2014; 8:1225-1239.
17. Meier J, Hovestadt V, Zapatka M, Pscherer A, Lichter P and Seiffert M. Genome-wide identification of translationally inhibited and degraded miR-155 targets using RNA-interacting protein-IP. RNA biology. 2013; 10:1018-1029.
18. Tan LP, Seinen E, Duns G, de Jong D, Sibon OC, Poppema S, Kroesen BJ, Kok K and van den Berg A. A high throughput experimental approach to identify miRNA targets in human cells. Nucleic acids research. 2009; 37:e137.
19. Varemo L, Nielsen J and Nookaew I. Enriching the gene set analysis of genome-wide data by incorporating directionality of gene expression and combining statistical hypotheses and methods. Nucleic acids research. 2013; 41:4378-4391.
20. Ben-Porath I, Thomson MW, Carey VJ, Ge R, Bell GW, Regev A and Weinberg RA. An embryonic stem cell-like gene expression signature in poorly differentiated aggressive human tumors. Nature genetics. 2008; 40:499-507.
21. Tamayo P. KRAS.PROSTATE_UP.V1_DN, http://www.broadinstitute.org/gsea/msigdb/cards/KRAS.PROSTATE_UP.V1_DN.html, May 12th, 2016.
22. Bracken AP, Pasini D, Capra M, Prosperini E, Colli E and Helin K. EZH2 is downstream of the pRB-E2F pathway, essential for proliferation and amplified in cancer. The EMBO journal. 2003; 22:5323-5335.
23. Du Z, Fei T, Verhaak RG, Su Z, Zhang Y, Brown M, Chen Y and Liu XS. Integrative genomic analyses reveal clinically relevant long noncoding RNAs in human cancer. Nature structural & molecular biology. 2013; 20:908-913.
24. Cabili MN, Trapnell C, Goff L, Koziol M, Tazon-Vega B, Regev A and Rinn JL. Integrative annotation of human large intergenic noncoding RNAs reveals global properties and specific subclasses. Genes & development. 2011; 25:1915-1927.
25. Seok J, Xu W, Gao H, Davis RW and Xiao W. JETTA: junction and exon toolkits for transcriptome analysis. Bioinformatics. 2012; 28:1274-1275.
26. Xiao F, Zuo Z, Cai G, Kang S, Gao X and Li T. miRecords: an integrated resource for microRNA-target interactions. Nucleic acids research. 2009; 37:D105-110.
27. Ebert MS, Neilson JR and Sharp PA. MicroRNA sponges: competitive inhibitors of small RNAs in mammalian cells. Nature methods. 2007; 4:721-726.
28. Cacciola NA, Sepe R, Forzati F, Federico A, Pellecchia S, Malapelle U, De Stefano A, Rocco D, Fusco A and Pallante P. Restoration of CBX7 expression increases the susceptibility of human lung carcinoma cells to irinotecan treatment. Naunyn-Schmiedeberg’s archives of pharmacology. 2015.
29. Xie D, Shang C, Zhang H, Guo Y and Tong X. Up-regulation of miR-9 target CBX7 to regulate invasion ability of bladder transitional cell carcinoma. Medical science monitor. 2015; 21:225-230.
30. Pallante P, Terracciano L, Carafa V, Schneider S, Zlobec I, Lugli A, Bianco M, Ferraro A, Sacchetti S, Troncone G, Fusco A and Tornillo L. The loss of the CBX7 gene expression represents an adverse prognostic marker for survival of colon carcinoma patients. European journal of cancer. 2010; 46:2304-2313.
31. Hinz S, Kempkensteffen C, Christoph F, Krause H, Schrader M, Schostak M, Miller K and Weikert S. Expression parameters of the polycomb group proteins BMI1, SUZ12, RING1 and CBX7 in urothelial carcinoma of the bladder and their prognostic relevance. Tumour biology. 2008; 29:323-329.
32. Karamitopoulou E, Pallante P, Zlobec I, Tornillo L, Carafa V, Schaffner T, Borner M, Diamantis I, Esposito F, Brunner T, Zimmermann A, Federico A, Terracciano L and Fusco A. Loss of the CBX7 protein expression correlates with a more aggressive phenotype in pancreatic cancer. European journal of cancer. 2010; 46:1438-1444.
33. Mansueto G, Forzati F, Ferraro A, Pallante P, Bianco M, Esposito F, Iaccarino A, Troncone G and Fusco A. Identification of a New Pathway for Tumor Progression: MicroRNA-181b Up-Regulation and CBX7 Down-Regulation by HMGA1 Protein. Genes Cancer. 2010; 1:210-224. doi: 10.1177/1947601910366860.
34. Forzati F, Federico A, Pallante P, Abbate A, Esposito F, Malapelle U, Sepe R, Palma G, Troncone G, Scarfo M, Arra C, Fedele M and Fusco A. CBX7 is a tumor suppressor in mice and humans. The Journal of clinical investigation. 2012; 122:612-623.
35. Kruger J and Rehmsmeier M. RNAhybrid: microRNA target prediction easy, fast and flexible. Nucleic acids research. 2006; 34:W451-454.
36. Klauke K, Radulovic V, Broekhuis M, Weersing E, Zwart E, Olthof S, Ritsema M, Bruggeman S, Wu X, Helin K, Bystrykh L and de Haan G. Polycomb Cbx family members mediate the balance between haematopoietic stem cell self-renewal and differentiation. Nature cell biology. 2013; 15:353-362.
37. Morey L, Pascual G, Cozzuto L, Roma G, Wutz A, Benitah SA and Di Croce L. Nonoverlapping functions of the Polycomb group Cbx family of proteins in embryonic stem cells. Cell stem cell. 2012; 10:47-62.
38. Zhou Z, Yin Y, Jiang F, Niu Y, Wan S, Chen N and Shen M. CBX7 deficiency plays a positive role in dentin and alveolar bone development. Journal of molecular histology. 2016.
39. Loeb GB, Khan AA, Canner D, Hiatt JB, Shendure J, Darnell RB, Leslie CS and Rudensky AY. Transcriptome-wide miR-155 binding map reveals widespread noncanonical microRNA targeting. Molecular cell. 2012; 48:760-770.
40. Hafner M, Landthaler M, Burger L, Khorshid M, Hausser J, Berninger P, Rothballer A, Ascano M, Jr., Jungkamp AC, Munschauer M, Ulrich A, Wardle GS, Dewell S, Zavolan M and Tuschl T. Transcriptome-wide identification of RNA-binding protein and microRNA target sites by PAR-CLIP. Cell. 2010; 141:129-141.
41. Poliseno L, Salmena L, Zhang J, Carver B, Haveman WJ and Pandolfi PP. A coding-independent function of gene and pseudogene mRNAs regulates tumour biology. Nature. 2010; 465:1033-1038.
42. Thomson DW, Bracken CP, Szubert JM and Goodall GJ. On measuring miRNAs after transient transfection of mimics or antisense inhibitors. PloS one. 2013; 8:e55214.
43. Zambelli F and Pavesi G. RIP-Seq data analysis to determine RNA-protein associations. Methods in molecular biology. 2015; 1269:293-303.
44. Di Croce L and Helin K. Transcriptional regulation by Polycomb group proteins. Nature structural & molecular biology. 2013; 20:1147-1155.
45. Pallante P, Forzati F, Federico A, Arra C and Fusco A. Polycomb protein family member CBX7 plays a critical role in cancer progression. American journal of cancer research. 2015; 5:1594-1601.
46. Jiang Z, Guo J, Xiao B, Miao Y, Huang R, Li D and Zhang Y. Increased expression of miR-421 in human gastric carcinoma and its clinical association. Journal of gastroenterology. 2010; 45:17-23.
47. Pallante P, Sepe R, Federico A, Forzati F, Bianco M and Fusco A. CBX7 modulates the expression of genes critical for cancer progression. PloS one. 2014; 9:e98295.
48. Cacciola NA, Sepe R, Forzati F, Federico A, Pellecchia S, Malapelle U, De Stefano A, Rocco D, Fusco A and Pallante P. Restoration of CBX7 expression increases the susceptibility of human lung carcinoma cells to irinotecan treatment. Naunyn-Schmiedeberg’s archives of pharmacology. 2015; 388:1179-1186.
49. Meseure D, Vacher S, Drak Alsibai K, Nicolas A, Chemlali W, Caly M, Lidereau R, Pasmant E, Callens C and Bieche I. Expression of ANRIL - Polycomb Complexes - CDKN2A/B/ARF Genes in Breast Tumors: Identification of a Two-gene (EZH2/CBX7) Signature with Independent Prognostic Value. Molecular cancer research. 2016.
50. Bernard D, Martinez-Leal JF, Rizzo S, Martinez D, Hudson D, Visakorpi T, Peters G, Carnero A, Beach D and Gil J. CBX7 controls the growth of normal and tumor-derived prostate cells by repressing the Ink4a/Arf locus. Oncogene. 2005; 24:5543-5551.
51. Li G, Warden C, Zou Z, Neman J, Krueger JS, Jain A, Jandial R and Chen M. Altered expression of polycomb group genes in glioblastoma multiforme. PloS one. 2013; 8:e80970.
52. Yang S, Liu W, Li M, Wen J, Zhu M and Xu S. Insulin-Like Growth Factor-1 Modulates Polycomb Cbx8 Expression and Inhibits Colon Cancer Cell Apoptosis. Cell biochemistry and biophysics. 2014.
53. Xiao W, Ou C, Qin J, Xing F, Sun Y, Li Z and Qiu J. CBX8, a novel DNA repair protein, promotes tumorigenesis in human esophageal carcinoma. International journal of clinical and experimental pathology. 2014; 7:4817-4826.
54. Lee SH, Um SJ and Kim EJ. CBX8 suppresses Sirtinol-induced premature senescence in human breast cancer cells via cooperation with SIRT1. Cancer letters. 2013; 335:397-403.
55. Clermont PL, Lin D, Crea F, Wu R, Xue H, Wang Y, Thu KL, Lam WL, Collins CC, Wang Y and Helgason CD. Polycomb-mediated silencing in neuroendocrine prostate cancer. Clinical epigenetics. 2015; 7:40.
56. Federico A, Pallante P, Bianco M, Ferraro A, Esposito F, Monti M, Cozzolino M, Keller S, Fedele M, Leone V, Troncone G, Chiariotti L, Pucci P and Fusco A. Chromobox protein homologue 7 protein, with decreased expression in human carcinomas, positively regulates E-cadherin expression by interacting with the histone deacetylase 2 protein. Cancer research. 2009; 69:7079-7087.
57. Kim HY, Park JH, Won HY, Lee JY and Kong G. CBX7 inhibits breast tumorigenicity through DKK-1-mediated suppression of the Wnt/beta-catenin pathway. FASEB journal. 2015; 29:300-313.
58. Cao Q, Mani RS, Ateeq B, Dhanasekaran SM, Asangani IA, Prensner JR, Kim JH, Brenner JC, Jing X, Cao X, Wang R, Li Y, Dahiya A, Wang L, Pandhi M, Lonigro RJ, et al. Coordinated regulation of polycomb group complexes through microRNAs in cancer. Cancer cell. 2011; 20:187-199.
59. Pickl JM, Heckmann D, Ratz L, Klauck SM and Sultmann H. Novel RNA markers in prostate cancer: functional considerations and clinical translation. BioMed research international. 2014; 2014:765207.
60. Valastyan S, Reinhardt F, Benaich N, Calogrias D, Szasz AM, Wang ZC, Brock JE, Richardson AL and Weinberg RA. A pleiotropically acting microRNA, miR-31, inhibits breast cancer metastasis. Cell. 2009; 137:1032-1046.
61. Kluiver J, Gibcus JH, Hettinga C, Adema A, Richter MK, Halsema N, Slezak-Prochazka I, Ding Y, Kroesen BJ and van den Berg A. Rapid generation of microRNA sponges for microRNA inhibition. PloS one. 2012; 7:e29275.
62. Robinson MD and Oshlack A. A scaling normalization method for differential expression analysis of RNA-seq data. Genome biology. 2010; 11:R25.
63. Robinson MD, McCarthy DJ and Smyth GK. edgeR: a Bioconductor package for differential expression analysis of digital gene expression data. Bioinformatics. 2010; 26:139-140.
64. Chen YM, D; Robinson, M.; Smyth, GK. edgeR: differential expresssion analysis of digital gene expression data; User’s Guide.
65. Anders S and Huber W. Differential expression analysis for sequence count data. Genome biology. 2010; 11:R106.