
INTRODUCTION
Beta Protein 1(BP1), an isoform of DLX4, belongs to the homeobox family of genes, master regulatory genes implicated in early development and cell differentiation that are frequently deregulated in cancer [1, 2]. Aberrant expression of BP1 has been shown in women with breast cancer. HOXB7-transduced SkBr3 cell lines developed tumors in nude mice in the absence of irradiation, while control mice injected with SkBr3 cells did not form tumors under those conditions [3]. Importantly, repression of HOXA5 in breast cancer resulted in the loss of expression of the tumor suppressor p53 [4]. Moreover, constitutive expression of HOXA1 in MCF7 cells led to increased anchorage-independent growth and tumor formation in mice [5]. BP1 directly activates the anti-apoptotic gene BCL-2 and results in resistance to TNF-α. In sporadic breast cancer, BP1 negatively regulates the expression of breast cancer anti-estrogen resistance 1 (BRCA1) through binding to its intron, suggesting that overexpression of BP1 might be a potential inhibitor of BRCA1. Therefore, targeting BP1 may provide a new avenue for breast cancer management [6].
BP1 belongs to the Distal-less subfamily of the homeobox gene family [7]. In our earlier study, BP1 expression was examined in untreated invasive ductal breast carcinoma (IDC) using semi-quantitative RT-PCR [8]. Overall, BP1 mRNA expression was found in 80% of breast tumors, with an 11% rate of low BP1 mRNA in normal tissues, while 100% of ER-negative tumors expressed BP1. These data suggest BP1 might be a useful target for therapy in patients with ER-negative tumors. In a follow-up study, we examined IDC cases from the Armed Forces Institute of Pathology which included women from around the world [9]. Eighty one percent of invasive ductal carcinomas were BP1 positive by immunostaining, indicating excellent agreement between BP1 RNA expression (80%) and protein expression (81%).
Estrogens are crucial hormones involved not only in normal breast development but also in carcinogenesis of breast epithelium and progression of breast cancer [10]. Estrogens act through a specific receptor, the estrogen receptor (ER). Once activated by estrogen, ER forms a transcriptional complex with various co-activators and co-repressors on target gene promoters to regulate their expression [11] ER-negative breast cancers are unresponsive to anti-estrogen therapy. In general, these tumors have a higher histologic grade and a higher proliferative rate and are associated with poorer prognosis. In this paper we found estrogen independence associated with high BP1 expression in ER-positive tumors in cell lines and in mice. To determine the molecular mechanism that contributes in part or in whole to BP1-related breast cancer aggressiveness in ER+ tumors, in vitro experiments were carried out. Here we present a novel model of ER regulation and estrogen independence by BP1.
RESULTS
Increased levels of BP1 are associated with a more aggressive phenotype in MCF-7 cells in vitro
MCF-7 cells containing an empty vector (V1) or a plasmid stably overexpressing BP1 cDNA under control of the CMV promoter (O2 and O4) were tested using classical assays which assess the oncogenic characteristics of cells. These cell lines were previously shown to express increased levels of BP1 mRNA and protein [12]. In the first assay, cells were grown in the absence of serum to test growth factor independence. By day seven in the absence of serum (Figure 1A), cell lines overexpressing BP1 (O2 and O4) showed approximately two to three-fold higher viability compared with V1, a statistically significant difference (p < 0.05). These data suggest that high BP1 levels may protect against cell death in the absence of serum, consistent with the increased BCL-2 expression in BP1-overexpressing MCF-cells, as reported [12].
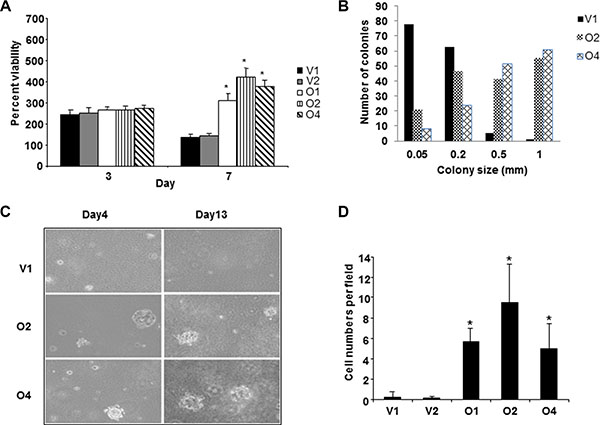
Figure 1: Overexpression of BP1 in MCF-7 cells is associated with aggressiveness. (A) Growth in the absence of serum. V1, O2 and O4 cell lines were grown without serum for seven days and cell number was measured using MTT assays. Data was normalized against day 0, which was set as 100%. Asterisks denote a statistical significance of p < 0.05 as compared to V1. (B) Colony formation in soft agar. V1, O2 and O4 cell lines were grown in soft agar as described in Materials and Methods. (C) Photomicrographs of cells grown in soft agar for four or 13 days. (D) Invasion of cells through Matrigel. BP1 overexpressing cell lines (O2 and O4) exhibited higher invasiveness compared to the empty vector control cell lines (V1) (p < 0.05). Three fields of unit area on each membrane were counted for cell numbers and the experiments were repeated twice.
Growth in soft agar was utilized to determine the anchorage independent growth of BP1- transfected MCF- 7 cells. This assay is considered a reliable method for detecting the malignant potential of cells [13]. While the total number of colonies was similar for the cell lines (V1 = 150, O2 = 161, O4 = 152), the cells overexpressing BP1 produced larger and more rapidly growing colonies (Figure 1B and 1C). Ninety-five percent of the colonies formed by V1 cells were equal to or less than 0.2 mm, while 88–93% of O2 and O4 colonies were greater than 0.2 mm. Both the O2 and the O4 cell lines had a significantly higher distribution of colony sizes compared to the V1 cell lines (p < 0.0001, Wilcoxon Rank Sum test). Even by day 4, the colonies derived from O2 and O4 were noticeably larger than those from V1 (Figure 1C).
Whereas MCF-7 cells are poorly invasive through Matrigel [14], we wished to determine whether BP1 could modulate their invasiveness. As shown in Figure 1D, O2 and O4 cells overexpressing BP1 increased invasion of MCF-7 cells by approximately 16-fold compared with control V1 cells, which was statistically significant (p < 0.05). These data suggest that BP1 levels may affect the metastatic potential of breast cancer, as previously demonstrated in ER-negative Hs578T breast cancer cells [15].
Characteristics of tumor growth in mice
It has previously been established that MCF-7 cells grow as a solid tumor when placed in the mammary glands of mice supplemented with estrogen [16]. To determine whether high BP1 levels would influence tumor characteristics, we injected V1, O2 or O4 cells into cleared fat pads of athymic nude mice, with 10 mice per group. Palpable tumors were present at 45 days post-surgery in the mammary glands of mice supplemented with an estrogen pellet (Figure 2A). Due to the relatively small number of mice, data from mice injected with O2 and O4 cells were combined. Tumors derived from O2 and O4 cells, labeled BP1 (Figure 2A), appeared to grow at a faster rate and were larger by day 58 than tumors from control V1 cells, but the small number of tumors precluded significance testing. No distant metastases were observed for any mice at the time of sacrifice. BP1 expression was retained in the tumors, shown by protein expression analysis. In mice supplemented with estrogen, BP1 expression was higher in tumors derived from O2 and O4 cells than in tumors derived from V1 cells (Figure 2B, red staining cells).
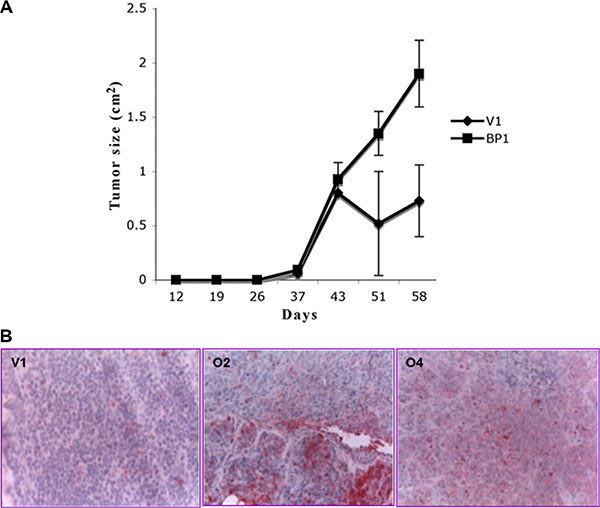
Figure 2: Tumor growth in mice is enhanced by increased BP1 expression. (A) Tumor size. Nude mice supplemented with a cholesterol-based estrogen pellet were injected in the cleared mammary fat pad with V1, O2 or O4 cell lines. Tumors were measured twice weekly and allowed to grow up to 58 days. (B) Immunostaining of tumors with anti-BP1 antibody. Anti-BP1 antibody was used to immunostain tumor sections. Since no tumors derived from V1 cells formed in the absence of an estrogen supplement, all sections are from estrogen supplemented mice. Figures are shown at 300X magnification.
Human breast tumor size correlates with BP1 expression
The possible clinical relevance of BP1 expression level with respect to tumor size in breast cancer patients was determined. Real-time PCR was used to measure the levels of expression of BP1 mRNA from 31 tumor samples. The levels of BP1 expression, relative to 18S RNA, ranged over 300-fold (Figure 3). For comparison, RNA was extracted from five normal breast tissues; BP1 levels ranged from 0.010 to 0.060 relative to 18S RNA. We found a positive correlation (r = 0.40, p = 0.02) between [log] BP1 expression and [log] tumor size. After statistically controlling for age and race, the partial correlation coefficient remained statistically significant (partial r = 0.49, p = 0.01). Thus, there is an association between higher BP1 mRNA expression levels and tumor size in patients.
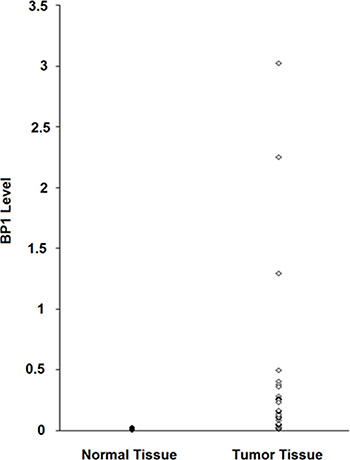
Figure 3: BP1 expression levels in breast tumors. RNA was extracted from 31 frozen tumors, followed by real-time PCR analysis. BP1 levels were normalized to 18S RNA. For comparison, RNA was extracted from five normal frozen breast tissues.
BP1 expression is associated with estrogen independence
In general, MCF-7 cells require exogenous estrogen to form tumors in nude mice [16]. However, approximately 20% of the mice implanted with cells stably transfected with BP1 (O2 or O4) were able to form tumors in the absence of estrogen, in contrast to 0% of mice injected with V1 cells (Table 1), but this difference was not statistically significant, probably due small sample size. Thus, BP1 overexpression in MCF-7 cells may induce estrogen-independent tumorigenesis in mice.
Table 1: Estrogen dependence of mammary tumor formation in mice correlates with BP1 expression
Cell Type Injected |
With Estrogen |
Without Estrogen |
|---|---|---|
V1 |
4/10 (40%) |
0/10 (0%) |
O2 |
10/15 (67%) |
2/10 (20%) |
O4 |
7/11 (64%) |
2/10 (20%) |
MCF-7 cell lines O2 and O4, which overexpress BP1, were compared with V1, a cell line containing the empty vector. The percentage of mice in each category is shown in parentheses.
BP1 regulates ER via two mechanisms
Direct regulation
A computer search revealed a consensus BP1 binding site [7] located in the first intron (IVS1) of the ER gene. An electrophoretic mobility shift assay (EMSA) verified that BP1 binds to this site in vitro. The consensus-binding site within a short stretch of IVS1 was used as a probe. As shown in Figure 4A, BP1 binds to the probe (lane 2, arrow). The shifted band is specific, demonstrated by competition with the unlabeled probe DNA (lanes 3 and 4) but not with non-specific DNA (lanes 5 and 6). A ChIP assay was performed to validate the EMSA results. DNA was precipitated using the BP1 antibody (anti-BP1) with O2 DNA or whole DNA (input) as positive controls, but not the IgG negative control (IgG control) (Figure 4B). The relative quantity of IVS1 precipitated by BP1 antibody is much higher in O2 cells than in V1 cells. The qRT-PCR data (Figure 4C, *p < 0.01) and Western blot analysis (Figure 4D) suggest that binding of BP1 transcriptionally upregulates ER.
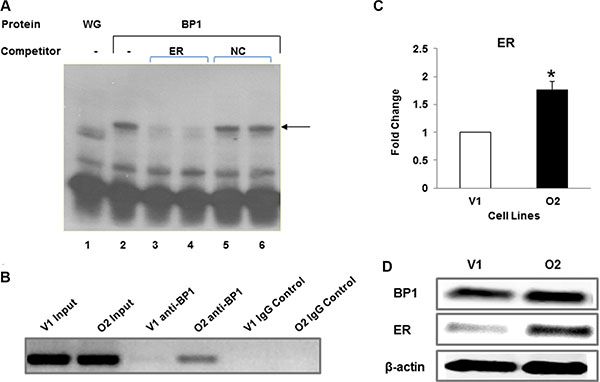
Figure 4: BP1 binds to and regulates ER. (A) Binding of BP1 to IVS1 of the estrogen receptor. Electrophoretic mobility shift assays were performed to detect potential binding of in vitro transcribed and translated BP1 to a consensus binding sequence located in IVS1 of the estrogen receptor. Binding of BP1 to a 32P end-labeled dsDNA probe containing the putative BP1 binding site and surrounding sequence is observed as a shifted band (arrow). Lane 1, wheat germ extract (WG) alone incubated with the probe. Lane 2, BP1 incubated with the probe. Lanes 3 and 4, unlabeled ER DNA (ER) was added to the incubation mixture containing BP1 protein at 500 X or 1000X molar excess, respectively. Lanes 5 and 6, a nonspecific negative control (NC) DNA to which BP1 protein does not bind was added at a 500 X or 1000X molar excess. (B) ChIP assay. DNA was precipitated using either the BP1 antibody (anti-BP1) or IgG negative control (IgG control) and whole DNA as positive control (input). The quantity of IVS1 DNA precipitated by BP1 antibody was compared in BP1 overexpressing cells (O2) and the empty vector (V1). (C) qRT-PCR. mRNA level of ER was measured by qRT-PCR comparing empty vector (V1) and BP1 overexpressor (O2) (*p < 0.01). Experiments were performed in triplicate. (D) Western blot analysis. Immunoblotting was performed with protein extracts from V1 and O2 cells as described in Materials and Methods.
Indirect regulation
Previously, we showed that BP1 negatively regulates BRCA1 [6]. P300 is a known histone acetyl transferase (HAT) protein which shares a dynamic relationship with BRCA1 and ER [17, 18]. This led us to investigate the relationship between BP1 and p300. We found a putative BP1 binding region in the first intron of the EP300 gene.
A ChIP assay was performed to verify the binding of BP1 to the first intron of P300. Figure 5A and 5B show that BP1 binds to the P300 gene in the first intronic region in MCF-7 cell derivatives and T47D cell lines, respectively. T47D cells are ER+ cell lines that have high endogenous levels of BP1 proteins [8]. BP1 binding is significantly higher in O2 cells than in V1 cells (Figure 5A). The qRT-PCR data (Figure 5C, *p < 0.05) and Western blot analysis (Figure 5D) show increased expression of p300 in cells overexpressing BP1 (O2) compared to V1 cells. Each experiment was repeated at least three times. Thus, BP1 transcriptionally upregulates P300.
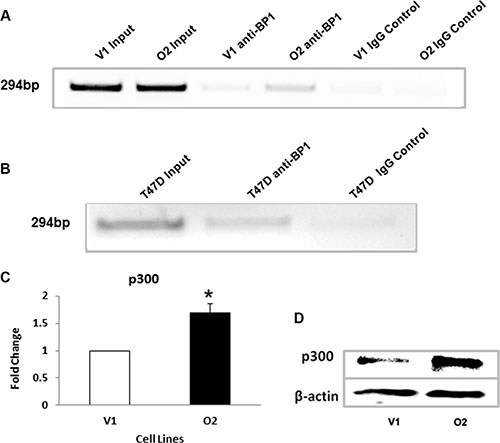
Figure 5: BP1 binds to and upregulates EP300. (A, B) ChIP assays. Chromatin immunoprecipitation was performed as described above to verify the binding of BP1 to the first intron of the EP300 gene in MCF-7 cell derivatives and T47D cell lines, respectively. (C) qRT-PCR. mRNA levels of p300 were measured by qRT-PCR comparing MCF-7 cells containing an empty vector (V1) and cells overexpressing BP1 (O2) (*p < 0.05). Experiments were performed in triplicate. (D) Western blot analysis. Immunoblotting was performed to determine the levels of p300 protein expression in V1 and O2 cells.
Increased levels of BP1 expression are associated with tamoxifen resistance
Our in vivo experiments indicate that BP1 may be a contributing factor to estrogen independence. Consistent with this, we observed elevated levels of ER in O2 cells. To determine if increased BP1 expression imparts tamoxifen resistance, we performed MTT assays over a period of 7 days with V1 and O2 cell lines (Figure 6A). O2 cells were more resistant to tamoxifen than V1 cells on days 1–7 (p < 0.0001). Pairwise comparative adjusted means and 95% confidence intervals are shown. The O2 means are consistently higher than the V1 means, with the only overlap in confidence intervals occurring on Day 7. Factorial analysis of covariance showed that the Condition x Day interaction was not statistically significant (p = 0.33). The lack of interaction between Condition and Day are apparent in Figure 6A, where the time trends are very similar for the O2 and V1 conditions.
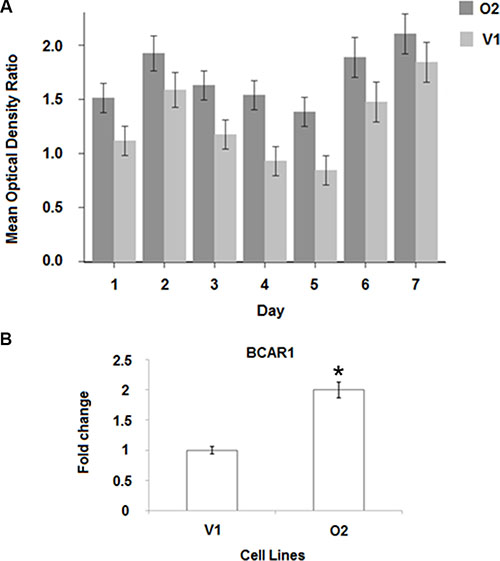
Figure 6: BP1 increases tamoxifen resistance. (A) MTT assay. V1 and O2 cells were challenged with 3 uM tamoxifen over seven days, as described in Materials and Methods. The 95% confidence limits are shown on the adjusted means. (B) mRNA levels of the tamoxifen resistance marker, BCAR1 (breast cancer anti-resistance). BP1 O2 cells have increased levels of BCAR1 mRNA compared with V1 cells (*p < 0.01).
Real-time PCR was used to determine the levels of BCAR1 mRNA, a marker of tamoxifen resistance [19], comparing V1 and O2 cells. As can be seen from Figure 6B, BCAR1 expression was almost two fold higher in O2 than in V1 cells (p < 0.01).
DISCUSSION
By a number of different measures, MCF-7 cells overexpressing BP1 were more aggressive: they grew in the absence of serum, formed larger colonies in soft agar, were relatively more infiltrative in an invasion assay and could form tumors in mice without external estrogen supplementation. This result was consistent with our earlier findings that BP1 positive breast tumors have a higher proliferation rate than BP1 negative tumors [9]. We also demonstrated in our earlier study that overexpression of BP1 significantly enhanced cell proliferation and metastatic potential in ER-negative Hs578T cells [15].
The observation that tumors developed in mice without estrogen supplementation was intriguing. Mechanisms of estrogen independence/tamoxifen resistance are not yet fully understood. Evidence in the literature points out that tumors acquire tamoxifen resistance in variety of ways, including but not limited to constitutive activation of ER by phosphorylation via increased growth factor signaling (non-genomic signaling pathway), leading to ligand independent activation of ER and thus insensitivity to estrogen, increased expression of co-activators, conversion of ER positive cells to ER negativity, lack of the 46 kDa ER protein, presence of the 36 kDa ER protein [20–24] or inappropriate increases in ER protein levels via increased stability [25–28]. Tamoxifen resistance/estrogen independence in BP1 overexpressing cells is due in part to increased stability. Also, ER, p300 and BRCA1 share a dynamic relationship, with BRCA1 inhibiting ER via ubiquitination, and p300 competitively stabilizing ER via acetylation [17, 29, 30]. Here we found that BP1 activates EP300; it is known that BP1 represses BRCA1 [6]. Thus, BP1 increases ER protein levels by both (i) a direct mechanism: BP1 transcriptionally upregulates ER and (ii) an indirect mechanism: BP1 transcriptionally upregulates p300, thus aiding increased stability of ER (Figure 7). We also demonstrate that cells overexpressing BP1 are more resistant to tamoxifen and express the tamoxifen resistant marker BCAR1; we have found a consensus BP1 binding site in BCAR1, suggesting that BP1 may directly regulate BCAR1.
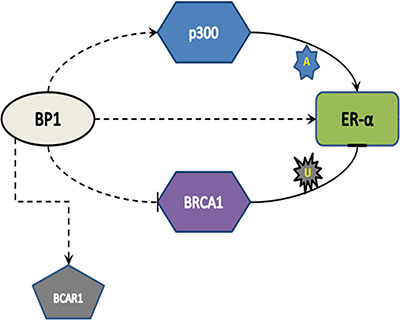
Figure 7: Model of BP1 regulation of ER. Dotted lines indicate a transcriptional mechanism, while solid lines indicate translational control (A: acetylation, U: Ubiquitination). BP1 binds to and activates EP300; p300 protein, which acetylates and “rescues” ER from BRCA1-mediated ubiquitination, is then up-regulated. Simultaneously, BP1 binds and transcriptionally activates ER. The increased ER protein expression and stability result in increased tamoxifen resistance.
Other HB genes have been implicated in an altered response to tamoxifen. Breast cancer cells overexpressing HOXB7 or HOXB13 show repression of the estrogen receptor leading to estrogen independence and resistance to tamoxifen [31, 32]. In contrast, here we show that BP1, also a HB gene, has the ability to confer tamoxifen insensitivity by both transcriptionally upregulating and stabilizing ER protein.
Our previous data demonstrated that the frequency of BP1 positivity, and the distribution and intensity of BP1 expression, increased with the progression of tumor development (normal→ hyperplasia→ in situ→ invasive), from a few randomly distributed BP1 positive cell clusters in normal controls to the vast majority of cells in the invasive tumors showing distinct BP1 immunoreactivity [9]. Other indicators of relative aggressive behavior are associated with BP1 expression in breast tumors. BP1 positivity is associated with (i) high tumor grade [33], a classical indicator of tumor aggressiveness [34]; (ii) tumors of African American women [8], known to show relative aggressive clinical behavior and associated with increased mortality [35, 36]; (iii) inflammatory breast cancer (IBC), a form of breast cancer with poor survival [37, 38], where we found that 100% of IBC tumors were BP1 positive, as well as nine lymph nodes from BP1 positive, metastatic IBC tumors [39]; (iv) increased expression of the proliferation marker Ki67 in BP1 positive breast and prostate tumors [9, 40]; (v) decreased apoptosis due to increased expression of BCL-2 [12]; (vi) increased expression of VEGF in BP1 positive ovarian tumors (BP1 is called DLX4 in Hara et al. [41]). ChIP-on-chip (Chromatin Immunoprecipitation on microarray promoter chip) combined with expression microarray studies have demonstrated that BP1 may regulate VEGF expression in Hs578T breast cancer cells as well [42]; (vii) epithelial to mesenchymal transition [43]. BP1 is expressed in a high percentage of ER negative tumors as well [8]. Here we show that BP1 overexpression correlates with increased metastatic potential, larger tumor size, less dependence on growth factors and resistance to tamoxifen treatment. A picture of the possible clinical importance of BP1 is now emerging.
Based on gene expression profiles, attempts have been made to classify breast tumors, with luminal A being most common subtype of breast cancer representing almost 50–60% of all diagnosed cases [44]. Luminal A tumors are generally characterized by low expression of the proliferation marker Ki67, sustained expression of ER, PR and BCL-2 and generally low HER2 expression [44, 45]. These types of tumors tend to have a more favorable tumor biology, good prognosis, low histological grade, respond well to tamoxifen/endocrine therapy and form smaller tumors [45]. Luminal B tumors constitute between 10–20% of all breast cancer cases. There are a number of characteristics in common between Luminal B tumors and BP1 positive tumors, as illustrated in this paper: (a) increased expression of proliferation genes, such as Ki67 [9, 44, 45]; (b) ER+, HER2 +/– and PR+/– in Luminal B tumors and frequent (73%) BP1 positivity in ER+ tumors [8, 44, 45]; (c) poor prognosis and high grade [33, 44, 45]; (d) reduced sensitivity to tamoxifen ([44, 45] and shown here associated with BP1 levels) and (e) larger tumors ([44, 45] and shown here for BP1). Therefore, we speculate that BP1 overexpression in Luminal A subtype cells can “propel” those cells to display more Luminal B-like characteristics. Further study with clinical patient samples is necessary to determine whether BP1 is a biomarker for Luminal B type tumors.
Our current data, along with previously published data, suggest that not only does BP1 expression increase with breast tumor progression but it is also involved in regulating gene expression patterns in tumors, driving them towards a more aggressive subtype. In particular, increased BP1 expression is associated with larger tumors, increased invasiveness of MCF-7 cells, and possibly with increased resistance to tamoxifen. Future clinical studies will provide important insights on BP1 as a biomarker and potential therapeutic target in ER positive breast cancer.
MATERIALS AND METHODS
Cell lines and viability assays
MCF-7 cells and derivatives that overexpress BP1 were described [12]. MCF-7 cells, as well as the empty vector and BP1 overexpressing MCF-7 cell lines, were maintained in RPMI 1640 containing 10% FBS and 1% penicillin/streptomycin (P/S), supplemented with 500μg/ml of G418. For viability assays, 2000 cells/well were seeded in triplicate in a 96-well plate and allowed to attach overnight. Media was replaced with serum-free RPMI 1640 the next day and was changed on day 3. For tamoxifen assays, 2000 cells/wells were seeded in a 96-well plate and allowed to attach overnight. The media was replaced with phenol red free RPMI 1640 containing 5% charcoal stripped serum (CSS) and 1% P/S. The media was changed after 24 hours and 3μM tamoxifen was added (Sigma, St. Louis, MO, USA). Tamoxifen containing media was replaced every 48 hours and readings were taken from day 1 to day 7. Growth was measured by the 3-(4,5-dimethylthiazol-2-yl)-(2,3-diphenyltetrazolium) bromide dye conversion assay (Sigma) at 570 nm. T47D cell lines were grown and maintained in RPMI 1640 containing 10% FBS and 1% penicillin/streptomycin.
Cell growth in soft agar
12,500 cells/ml were suspended in 0.3% agar supplemented with DMEM and 10% FBS and layered over 1ml of a 0.8% agar/medium base [46]. Cells were allowed to grow over a 14-day period; colonies were stained with nitroblue tetrazolium and counted using an Artek 880 colony counter.
Invasion assays
The cell invasive capacity was estimated using BioCoat Matrigel Invasion Chambers (8 mm pores, 24 wells) (BD Bioscience, Bedford, MA, USA) as described previously [15]. In brief, cells stably transfected with an empty vector or with BP1 cDNA plasmids were resuspended in serum-free DMEM medium (2.5 × 10⁵ cells/ml) and seeded in the top chamber of pre-wet inserts. After 48 h incubation, cells that migrated to the bottom surface of the insert were stained with Diff-Quick staining solution and quantified. The number of migrating cells was determined by counting five non-overlapping random fields on each chamber; four to five chambers were counted for each experimental point.
Tumor formation in mice
The use of mice in this study was approved by the NIH Institutional Animal Care and Use Committee (IACUC). All procedures were conducted in accordance with the NIH Guide for the Care and Use of Laboratory Animals. Athymic nude mice were maintained on a 12 hr light/12 hr dark schedule with free access to laboratory chow and water. 2 × 10⁶cells were injected into the cleared mammary fat pads of 4–6 week old female athymic nude mice [47]. At the same time, some of the mice were also implanted subcutaneously with a 10 mg cholesterol-based pellet containing 0.72 mg of 17-β-estradiol (Innovative Research of America, Sarasota, FL, USA). Tumors were measured at the indicated times in two dimensions using calipers. At sacrifice, tumors were either frozen or fixed in 10% normal buffered formalin.
Clinical samples
Human breast tumor samples were obtained from The George Washington University Department of Pathology with IRB approval. Breast tissue samples 0.5– 1.0 cm in diameter were obtained from frozen surgical resection specimens and characterized pathologically.
Electrophoretic mobility shift assays (EMSA) assays
EMSA was performed as described earlier [6, 7]. Complementary sequences in the first intervening sequence (IVS1) of the ER were annealed and 5′-end-labeled with 32P-ATP using T4 kinase (Invitrogen, Grand Island, NY, USA). The Wheat Germ Coupled Transcription /Translation kit (Promega, Madison, WI, USA) was used to generate BP1 protein from the plasmid pGEM7 containing the BP1 open reading frame. Unlabeled competitor oligonucleotides were added at 500X or 1000X molar excess to the binding reactions. The following DNA sequences were used as probes: ER:
5′-GGCAAAATGCAGCTCTTCCTATATGTATAC CCTGAATCTC-3′; negative control (NC):
5′-TCTTAGAGGGAGGGCTGAGGGTTTGAAG TCCAACTCCTAAGCC-3′.
Chromatin-immunoprecipitation (ChIP) assays
The BP1 consensus binding site (5′-WTCWATATG-3′) on EP300 [7] was predicted using the CISTER program [48]. Primers, flanking the putative BP1 binding site, were designed using primer3plus [49] tool and verified by primer-BLAST [50]. The primers used for ChIP assay are as follows: 5′-GGAGCATCCTCAGATTTTGG-3′ (EP300-Forward) and 5′-TGCCTTAACTATCTGCTGATTTTC-3′ (EP300-Reverse). The ChIP protocol was performed using the Millipore ChIP kit (Millipore, Billerica, MA, USA) as described previously [6, 42]. Briefly, BP1-overexpressing MCF-7 or T47D cells were crosslinked at 80% confluence in 10 mL RPMI 1640 media with 1% formaldehyde for ten minutes at 37ºC. Cells were washed twice with cold PBS containing 1x complete mini protease inhibitor (Roche Applied Science, Indianapolis, IN, USA), lysed in SDS lysis buffer and incubated for fifteen minutes on ice. Chromatin was sheared by sonication for 10 pulses, twice. Equal amounts of DNA were used as test and negative controls, and 1 μg was used as the input control. 10 μg of BP1 antibody (Bethyl Labs, Montgomery, TX, USA) or equal amounts of normal rabbit IgG (Cell signaling, Danvers, MA, USA ) were added along with salmon sperm DNA/Protein G PLUS/Protein A agarose beads, and incubated overnight at 4C. Further isolation and purification of the precipitated DNA was done according to Millipore’s protocol. Isolated DNA was resuspended in Tris-EDTA buffer for use in PCR. Platinum superscript master mix was used with a 10 μM final concentration of each primer and 1 μg of DNA as input or 5 μl of isolated/precipitated DNA in a final reaction volume of 45 μl. PCR was run for 40 cycles. The PCR product was analyzed on a 2% agarose gel and visualized.
Real-time PCR assays
Total RNA was prepared using the RNeasy Mini Kit (Qiagen Inc, Valencia, CA. USA). RNA samples underwent DNase I treatment (Promega, Madison, WI, USA) prior to first-strand cDNA synthesis with random hexamer primers using the Superscript II First-Strand cDNA Synthesis System (Invitrogen, Grand Island, NY, USA). Real-time PCR was carried out using the ABI 7300 model sequence detection system (Applied Biosystem, Foster City, CA, USA) with SYBR Green I PCR Mastermix (BioRad, Hercules, CA, USA). Primers for ER and EP300 were published [51–53]. Primers for BP1 were designed using Primer-BLAST and are as follows: 5′-CCTCCCCCAATTTGTCCTACTC-3′ (forward) and 5′-GGTTGCTGGCAGGACAGGTA-3′ (reverse). The amplification program included an initial denaturation at 95°C for 10 min., followed by 40 cycles of a two-stage PCR consisting of 95°C for 15s and 60°C for 1 min. Specificity for PCR amplifications was verified by observing a single peak dissociation curve for each gene. One microliter of the reverse transcribed cDNA was used for each real-time PCR reaction and all reactions were performed in triplicate. The expression values of genes from different samples were calculated by normalizing with 18S RNA and relative quantitation values were plotted.
Immunoblotting assays
Cells were grown to 70%–80% confluency and proteins extracted as previously described [12]. 30–65 μg of proteins were loaded on 4–20% SDS-PAGE gels (Bio-Rad, Hercules, CA, USA) and transferred to nitrocellulose membranes. Blots were probed overnight with rabbit anti-BP1 (Bethyl Labs, Montgomery, TX, USA) at a 1:5000 dilution, with rabbit antiER-α (Bethyl labs, Montgomery, TX, USA) at a 1:1000 dilution, mouse anti-p300 (Millipore, Billerica, MA, USA) at a 1:500 dilution, or mouse anti-beta-actin (Sigma, St. Louis, MO, USA) at a 1:5000 dilution. After washing, blots were incubated with either horseradish peroxidase-linked goat anti-mouse (1:2500 dilution) or goat anti-rabbit secondary antibodies (1:15,000 dilution). Signals were detected using SuperSignal West Dura Extended Duration Substrate (Pierce, Rockford, IL, USA).
Statistical analyses
For analysis of mouse data, due to the smaller sample sizes, data were first pooled for the mice receiving the two BP1- overexpressing cell lines when tested against the control mice. For the test of colony size differences, results are based on the pooled data from six independent replications (two experimental replications of three wells each). For tamoxifen experiments, in order to adjust for any ethanol (EtOH) effects on optical density, scores were calculated by subtraction (subtracting mean optical density under the EtOH condition for each day for O2 and V1 from the tamoxifen condition scores) and by ratio (dividing the tamoxifen condition scores by the mean optical density under the EtOH condition for each day for O2 and V1). The ratio adjustment method was used for all subsequent analyses because of greater homoscedasticity and reasonable evidence of normality. The statistical test of mean differences on study condition (O2 vs V1), follow-up day, and Condition x Day interaction was by factorial analysis of covariance. The qPCR data for ER and p300 were analyzed by one-sample t-test.
ACKNOWLEDGMENTS
We thank Maura Costello and Cassandra Campbell for their excellent technical assistance and Yassi Fallah for assistance with the manuscript.
CONFLICTS OF INTEREST
The authors declare no competing interests.
GRANT SUPPORT
Portions of this research were supported by grant K08 CA102875 (JJP), by the Intramural Research Program of the NIH, Center for Cancer Research, NCI (E.G. and B.K.V.), the Elaine H. Snyder Cancer Research Award (SWF) and by the Katherine Birch McCormick Foundation (PEB).
REFERENCES
1. Abate-Shen C. Deregulated homeobox gene expression in cancer: cause or consequence? Nature reviews. 2002; 2:777–785.
2. Berg PE, Kirolikar SP. DLX4 (distal-less homeobox 4). Atlas Genet Cytogenet Oncol Haematol. 2011; 15:658–661.
3. Care A, Felicetti F, Meccia E, Bottero L, Parenza M, Stoppacciaro A, Peschle C, Colombo MP. HOXB7: a key factor for tumor-associated angiogenic switch. Cancer research. 2001; 61:6532–6539.
4. Raman V, Martensen SA, Reisman D, Evron E, Odenwald WF, Jaffee E, Marks J, Sukumar S. Compromised HOXA5 function can limit p53 expression in human breast tumours. Nature. 2000; 405:974–978.
5. Zhang X, Zhu T, Chen Y, Mertani HC, Lee KO, Lobie PE. Human growth hormone-regulated HOXA1 is a human mammary epithelial oncogene. The Journal of biological chemistry. 2003; 278:7580–7590.
6. Kluk BJ, Fu Y, Formolo TA, Zhang L, Hindle AK, Man YG, Siegel RS, Berg PE, Deng C, McCaffrey TA, Fu SW. BP1, an isoform of DLX4 homeoprotein, negatively regulates BRCA1 in sporadic breast cancer. Int J Biol Sci. 2010; 6:513–524.
7. Chase MB, Fu S, Haga SB, Davenport G, Stevenson H, Do K, Morgan D, Mah AL, Berg PE. BP1, a homeodomain-containing isoform of DLX4, represses the beta-globin gene. Molecular and cellular biology. 2002; 22:2505–2514.
8. Fu SW, Schwartz A, Stevenson H, Pinzone JJ, Davenport GJ, Orenstein JM, Gutierrez P, Simmens SJ, Abraham J, Poola I, Stephan DA, Berg PE. Correlation of expression of BP1, a homeobox gene, with estrogen receptor status in breast cancer. Breast Cancer Res. 2003; 5:R82–87.
9. Man YG, Fu SW, Schwartz A, Pinzone JJ, Simmens SJ, Berg PE. Expression of BP1, a novel homeobox gene, correlates with breast cancer progression and invasion. Breast cancer research and treatment. 2005; 90:241–247.
10. Dickson RB, Lippman ME. Growth factors in breast cancer. Endocr Rev. 1995; 16:559–589.
11. Carroll JS, Meyer CA, Song J, Li W, Geistlinger TR, Eeckhoute J, Brodsky AS, Keeton EK, Fertuck KC, Hall GF, Wang Q, Bekiranov S, Sementchenko V, et al. Genome-wide analysis of estrogen receptor binding sites. Nature genetics. 2006; 38:1289–1297.
12. Stevenson HS, Fu SW, Pinzone JJ, Rheey J, Simmens SJ, Berg PE. BP1 transcriptionally activates bcl-2 and inhibits TNFalpha-induced cell death in MCF7 breast cancer cells. Breast Cancer Res. 2007; 9:R60.
13. Hanahan D, Weinberg RA. The hallmarks of cancer. Cell. 2000; 100:57–70.
14. Holst-Hansen C, Johannessen B, Hoyer-Hansen G, Romer J, Ellis V, Brunner N. Urokinase-type plasminogen activation in three human breast cancer cell lines correlates with their in vitro invasiveness. Clinical & experimental metastasis. 1996; 14:297–307.
15. Fu Y, Lian Y, Kim KS, Zhang L, Hindle AK, Brody F, Siegel RS, McCaffrey TA, Fu SW. BP1 Homeoprotein Enhances Metastatic Potential in ER-negative Breast Cancer. J Cancer. 2010; 1:54–62.
16. Osborne CK, Hobbs K, Clark GM. Effect of estrogens and antiestrogens on growth of human breast cancer cells in athymic nude mice. Cancer research. 1985; 45:584–590.
17. Fan S, Ma YX, Wang C, Yuan RQ, Meng Q, Wang JA, Erdos M, Goldberg ID, Webb P, Kushner PJ, Pestell RG, Rosen EM. p300 Modulates the BRCA1 inhibition of estrogen receptor activity. Cancer research. 2002; 62:141–151.
18. Ma Y, Fan S, Hu C, Meng Q, Fuqua SA, Pestell RG, Tomita YA, Rosen EM. BRCA1 regulates acetylation and ubiquitination of estrogen receptor-alpha. Mol Endocrinol. 2010; 24:76–90.
19. van der Flier S, Chan CM, Brinkman A, Smid M, Johnston SR, Dorssers LC, Dowsett M. BCAR1/p130Cas expression in untreated and acquired tamoxifen-resistant human breast carcinomas. Int J Cancer. 2000; 89:465–468.
20. Sarwar N, Kim JS, Jiang J, Peston D, Sinnett HD, Madden P, Gee JM, Nicholson RI, Lykkesfeldt AE, Shousha S, Coombes RC, Ali S. Phosphorylation of ERalpha at serine 118 in primary breast cancer and in tamoxifen-resistant tumours is indicative of a complex role for ERalpha phosphorylation in breast cancer progression. Endocrine-related cancer. 2006; 13:851–861.
21. Guo JP, Shu SK, Esposito NN, Coppola D, Koomen JM, Cheng JQ. IKKepsilon phosphorylation of estrogen receptor alpha Ser-167 and contribution to tamoxifen resistance in breast cancer. The Journal of biological chemistry. 2010; 285:3676–3684.
22. Fowler AM, Santen RJ, Allred DC. "Dwarf" estrogen receptor in breast cancer and resistance to tamoxifen. J Clin Oncol. 2009; 27:3413–3415.
23. Shi L, Dong B, Li Z, Lu Y, Ouyang T, Li J, Wang T, Fan Z, Fan T, Lin B, Wang Z, Xie Y. Expression of ER-{alpha}36, a novel variant of estrogen receptor {alpha}, and resistance to tamoxifen treatment in breast cancer. J Clin Oncol. 2009; 27:3423–3429.
24. Klinge CM, Riggs KA, Wickramasinghe NS, Emberts CG, McConda DB, Barry PN, Magnusen JE. Estrogen receptor alpha 46 is reduced in tamoxifen resistant breast cancer cells and re-expression inhibits cell proliferation and estrogen receptor alpha 66-regulated target gene transcription. Mol Cell Endocrinol. 2010; 323:268–276.
25. Schiff R, Osborne CK. Endocrinology and hormone therapy in breast cancer: new insight into estrogen receptor-alpha function and its implication for endocrine therapy resistance in breast cancer. Breast Cancer Res. 2005; 7:205–211.
26. Pinzone JJ, Stevenson H, Strobl JS, Berg PE. Molecular and cellular determinants of estrogen receptor alpha expression. Molecular and cellular biology. 2004; 24:4605–4612.
27. Ali S, Coombes RC. Endocrine-responsive breast cancer and strategies for combating resistance. Nature reviews. 2002; 2:101–112.
28. Fowler AM, Solodin N, Preisler-Mashek MT, Zhang P, Lee AV, Alarid ET. Increases in estrogen receptor-alpha concentration in breast cancer cells promote serine 118/104/106-independent AF-1 transactivation and growth in the absence of estrogen. FASEB J. 2004; 18:81–93.
29. Kim SH, Kang HJ, Na H, Lee MO. Trichostatin A enhances acetylation as well as protein stability of ERalpha through induction of p300 protein. Breast Cancer Res. 2010; 12:R22.
30. Fan S, Wang J, Yuan R, Ma Y, Meng Q, Erdos MR, Pestell RG, Yuan F, Auborn KJ, Goldberg ID, Rosen EM. BRCA1 inhibition of estrogen receptor signaling in transfected cells. Science. 1999; 284:1354–1356.
31. Jin K, Kong X, Shah T, Penet MF, Wildes F, Sgroi DC, Ma XJ, Huang Y, Kallioniemi A, Landberg G, Bieche I, Wu X, Lobie PE, et al. The HOXB7 protein renders breast cancer cells resistant to tamoxifen through activation of the EGFR pathway. Proceedings of the National Academy of Sciences of the United States of America. 2012; 109:2736–2741.
32. Shah N, Jin K, Cruz LA, Park S, Sadik H, Cho S, Goswami CP, Nakshatri H, Gupta R, Chang HY, Zhang Z, Cimino-Mathews A, Cope L, et al. HOXB13 mediates tamoxifen resistance and invasiveness in human breast cancer by suppressing ERalpha and inducing IL-6 expression. Cancer research. 2013; 73:5449–5458.
33. Yu M, Yang Y, Shi Y, Wang D, Wei X, Zhang N, Niu R. Expression level of beta protein 1 mRNA in Chinese breast cancer patients: a potential molecular marker for poor prognosis. Cancer Sci. 2008; 99:173–178.
34. Hanrahan EO, Valero V, Gonzalez-Angulo AM, Hortobagyi GN. Prognosis and management of patients with node-negative invasive breast carcinoma that is 1 cm or smaller in size (stage 1; T1a,bN0M0): a review of the literature. J Clin Oncol. 2006; 24:2113–2122.
35. Edwards MJ, Gamel JW, Vaughan WP, Wrightson WR. Infiltrating ductal carcinoma of the breast: the survival impact of race. J Clin Oncol. 1998; 16:2693–2699.
36. Mancino AT, Rubio IT, Henry-Tillman R, Smith LF, Landes R, Spencer HJ, Erkman L, Klimberg VS. Racial differences in breast cancer survival: the effect of residual disease. The Journal of surgical research. 2001; 100:161–165.
37. Chang S, Parker SL, Pham T, Buzdar AU, Hursting SD. Inflammatory breast carcinoma incidence and survival: the surveillance, epidemiology, and end results program of the National Cancer Institute, 1975–1992. Cancer. 1998; 82:2366–2372.
38. Baldini E, Gardin G, Evagelista G, Prochilo T, Collecchi P, Lionetto R. Long-term results of combined-modality therapy for inflammatory breast carcinoma. Clinical breast cancer. 2004; 5:358–363.
39. Man YG, Schwartz A, Levine PH, Teal C, Berg PE. BP1, a putative signature marker for inflammatory breast cancer and tumor aggressiveness. Cancer Biomark. 2009; 5:9–17.
40. Schwartz AM, Man YG, Rezaei MK, Simmens SJ, Berg PE. BP1, a homeoprotein, is significantly expressed in prostate adenocarcinoma and is concordant with prostatic intraepithelial neoplasia. Mod Pathol. 2009; 22:1–6.
41. Hara F, Samuel S, Liu JS, Rosen D, Langley RR, Naora H. A homeobox gene related to Drosophila Distal-less promotes ovarian tumorigenicity by inducing expression of vascular endothelial growth factor and fibroblast growth factor-2. American Journal of Pathology. 2007; 170:1594–1606.
42. Song Y, Dang C, Fu Y, Lian Y, Hottel J, Li X, McCaffrey T, Fu SW. Genome-wide analysis of BP1 transcriptional targets in breast cancer cell line Hs578T. Int J Biol Sci. 2009; 5:1–12.
43. Zhang L, Yang M, Gan L, He T, Xiao X, Stewart MD, Liu X, Yang L, Zhang T, Zhao Y, Fu J. DLX4 upregulates TWIST and enhances tumor migration, invasion and metastasis. Int J Biol Sci. 2012; 8:1178–1187.
44. Eroles P, Bosch A, Perez-Fidalgo JA, Lluch A. Molecular biology in breast cancer: intrinsic subtypes and signaling pathways. Cancer Treat Rev. 2012; 38:698–707.
45. Creighton CJ. The molecular profile of luminal B breast cancer. Biologics. 2012; 6:289–297.
46. Courtenay VD, Selby PJ, Smith IE, Mills J, Peckham MJ. Growth of human tumour cell colonies from biopsies using two soft-agar techniques. British journal of cancer. 1978; 38:77–81.
47. Deome KB, Faulkin LJ, Jr., Bern HA, Blair PB. Development of mammary tumors from hyperplastic alveolar nodules transplanted into gland-free mammary fat pads of female C3H mice. Cancer research. 1959; 19:515–520.
48. Frith MC, Hansen U, Weng Z. Detection of cis-element clusters in higher eukaryotic DNA. Bioinformatics. 2001; 17:878–889.
49. Untergasser A, Cutcutache I, Koressaar T, Ye J, Faircloth BC, Remm M, Rozen SG. Primer3—new capabilities and interfaces. Nucleic Acids Res. 2012; 40:e115.
50. Ye J, Coulouris G, Zaretskaya I, Cutcutache I, Rozen S, Madden TL. Primer-BLAST: a tool to design target-specific primers for polymerase chain reaction. BMC Bioinformatics. 2012; 13:134.
51. Ariazi EA, Clark GM, Mertz JE. Estrogen-related receptor alpha and estrogen-related receptor gamma associate with unfavorable and favorable biomarkers, respectively, in human breast cancer. Cancer research. 2002; 62:6510–6518.
52. Bieche I, Parfait B, Tozlu S, Lidereau R, Vidaud M. Quantitation of androgen receptor gene expression in sporadic breast tumors by real-time RT-PCR: evidence that MYC is an AR-regulated gene. Carcinogenesis. 2001; 22:1521–1526.
53. Le Corre L, Fustier P, Chalabi N, Bignon YJ, Bernard-Gallon D. Effects of resveratrol on the expression of a panel of genes interacting with the BRCA1 oncosuppressor in human breast cell lines. Clin Chim Acta. 2004; 344:115–121.