
Introduction
The world-wide prevalence of cases of type 2 diabetes and pre-diabetes have been spiralling out of control, and not only in developed countries, but also in third-world countries [1-4], with more than half a billion cases expected by 2030 [5]. Co-morbidities are also a major health burden on all health systems, and include hypoglycaemia, hypertension, dyslipidaemia, cardiovascular and heart related deaths, stroke, kidney disease, eye problems and also amputations [6]. Cardiovascular risk, vascular dysfunction, accelerated atherosclerosis and changed inflammatory marker profiles are closely associated with systemic inflammation; and this is also the case in type 2 diabetes individuals [7-16]. A chronic state of systemic inflammation also appears to be a central mechanism underlying the pathophysiology of insulin resistance and metabolic syndrome [16] and consequently also in type 2 diabetes. Most type 2 diabetes patients are on a plethora of medication including medication for comorbidities, and will need incrementally more complex therapeutic regimens to control hyperglycaemia as the disease progresses [17]. Cardiovascular disease and a pathological coagulation system, therefore remains the leading cause of mortality in patients with this condition [15].
Previously we showed that pathophysiological erythrocytes (RBCs), platelets and atypical fibrin fibre formation seen as an altered fibrin structure, are important hallmarks of inflammation [18-22], and these changes are also found in type 2 diabetes [7, 23, 24]. Diabetic fibrin fibres have a netted and matted appearance, and previous research suggested that in the condition, either hypercoagulability [25-27], reduced clot permeability and decreased susceptibility of clot to (fibrino)lysis may happen [21, 28-31]. Also, in type 2 diabetes, increased glucose levels may play an important role in fibrin fibre packaging, where glycation of fibrinogen may be a key culprit in a changed fibrin structure [32-34].
In this paper we looked at thromboelastic parameters using thromboelastography (TEG) and scanning electron microscopy (SEM) of an arbitrarily chosen poorly controlled patient sample, to see if the results could be used to determine if there is variability in the coagulation statuses of these patients. A typical generalized clinical treatment approach is usually to determine the level of hyperglycaemia and the presence of comorbidities (e.g. hyperlipidaemia and hypertension), followed by treatment of each identified complication. However, the coagulation profile is indicative of inflammatory status of an individual, and by tracking the coagulatory profile closely, the patient’s medication may be streamlined. This will allow the clinician to also determine the general inflammatory healthiness, ultimately resulting in a better-controlled condition. Here we argue that we are currently not following the right treatment approach, and in many cases, we fail in tracking the effects of the medication in the condition. To successfully implement and track a treatment regime that not only improves glucose regulation, but also reduces systemic inflammation, we need to follow an individualised approach. Information from viscoelastic parameters may play an fundamental role in such a precision-medicine approach, together with genome-based and other molecular techniques, as suggested by the NIH [35]. To address the increasing diabetes prevalence, we need to investigate the use of novel technologies; and in this approach, individualized disease tracking, forms an essential part in the diagnosis, as well as treatment.
Results
Tables 1, 2, 3 show comprehensive sample data. We included all individual data of the 2 groups, to make the point that the individual type 2 diabetes sample results are greatly variable. From our diabetes sample of 90, 46 were randomly chosen for TEG analysis. A Tukey analysis was performed (it compares the means of every TEG parameter to the means of every other parameter) and all comparative p-values were P > 0.9999 (this will be discussed in detail later).
Table 1: Demographics and medication usage and TEG of PPP of healthy individuals (n=71).
No. |
G |
Age |
R |
K |
Angle |
MA |
MRTG |
TMRTG |
TTG |
1 |
M |
22 |
9 |
9.7 |
53.1 |
20.7 |
1.71 |
10.7 |
131.1 |
2 |
M |
61 |
8.2 |
6.4 |
49.6 |
21.8 |
2.58 |
11.2 |
139.9 |
3 |
M |
20 |
9.6 |
6.1 |
49.1 |
26 |
1.53 |
12.1 |
142.5 |
4 |
M |
33 |
7.8 |
3.4 |
55.7 |
54.6 |
4.56 |
13.5 |
602.5 |
5 |
M |
18 |
11.8 |
6.7 |
52.3 |
25.1 |
1.71 |
15.4 |
167.8 |
6 |
M |
17 |
7.7 |
2.5 |
71.9 |
24.3 |
5.6 |
8.6 |
160.7 |
7 |
M |
47 |
2.5 |
2.1 |
73.1 |
32.6 |
17.76 |
5.1 |
240.1 |
8 |
M |
32 |
11.1 |
8.1 |
46.8 |
21.9 |
2.79 |
7.3 |
219.4 |
9 |
M |
20 |
7.9 |
7.2 |
45.8 |
26 |
2.06 |
11.1 |
175.7 |
10 |
M |
30 |
11.2 |
4.8 |
49.5 |
30.5 |
2.64 |
14.3 |
219.3 |
11 |
M |
31 |
10.8 |
6.3 |
48.6 |
28 |
1.75 |
14.3 |
194.3 |
12 |
M |
47 |
7.6 |
2.8 |
60.6 |
32.8 |
5.74 |
10.3 |
244.5 |
13 |
M |
53 |
11.2 |
6.1 |
49.5 |
29.2 |
2.33 |
14.6 |
206.3 |
14 |
M |
24 |
11.2 |
6.8 |
47.5 |
25 |
2.36 |
13.6 |
166.8 |
15 |
M |
23 |
9.3 |
14.2 |
44.6 |
20.3 |
1.31 |
12.8 |
128.0 |
16 |
M |
23 |
10.8 |
1.7 |
71.2 |
35.8 |
8.9 |
12.4 |
279.1 |
17 |
M |
23 |
14.5 |
4.4 |
47.3 |
29.6 |
3.4 |
18.3 |
210.6 |
18 |
M |
22 |
12.1 |
6.6 |
52.5 |
21.3 |
2.84 |
13.1 |
135.7 |
19 |
M |
23 |
9.3 |
6 |
66.5 |
21.2 |
7.08 |
10.3 |
134.5 |
20 |
M |
23 |
10.8 |
7.6 |
65.7 |
20.9 |
2.6 |
12.4 |
132.2 |
21 |
M |
23 |
7.7 |
4.6 |
72.9 |
21 |
5.39 |
8.5 |
133.4 |
22 |
M |
23 |
7.8 |
2.9 |
66.5 |
27.7 |
4.55 |
8.9 |
192.2 |
23 |
M |
30 |
6.7 |
4.2 |
73 |
22.1 |
5.59 |
7.4 |
142.0 |
24 |
M |
23 |
6.6 |
2.3 |
68.7 |
26.6 |
4.55 |
7.6 |
181.4 |
25 |
M |
23 |
14 |
9.2 |
50.1 |
28 |
1.43 |
15.3 |
194.9 |
26 |
M |
28 |
8.9 |
3.6 |
59.5 |
35.4 |
6.45 |
13.5 |
273.9 |
27 |
M |
20 |
10.2 |
11.4 |
50.3 |
22.2 |
1.53 |
12.1 |
142.5 |
28 |
M |
20 |
4 |
2.9 |
60.2 |
37 |
4.45 |
5.8 |
294.3 |
29 |
M |
19 |
7.1 |
1.4 |
74.6 |
35.5 |
12.24 |
8.7 |
276.8 |
30 |
M |
19 |
7.9 |
3.5 |
61.1 |
35.6 |
6.43 |
12.0 |
278.4 |
31 |
M |
19 |
11.9 |
11.2 |
59.9 |
20 |
2.61 |
13.2 |
125.2 |
32 |
M |
20 |
9.5 |
4.4 |
61.5 |
22.6 |
3.56 |
10.9 |
146.0 |
33 |
M |
52 |
6.8 |
1.7 |
71.8 |
39.9 |
10.37 |
8.7 |
333.0 |
34 |
M |
77 |
5.5 |
1.3 |
76.5 |
32.6 |
7.77 |
6.3 |
243.3 |
35 |
M |
84 |
18.8 |
3.6 |
54.4 |
31.9 |
3.59 |
21.4 |
234.3 |
36 |
M |
88 |
6.6 |
2.2 |
67.6 |
28.3 |
5.67 |
8.1 |
198.0 |
37 |
F |
28 |
9.9 |
8.1 |
50.8 |
23.5 |
2.01 |
8.9 |
143.5 |
38 |
F |
18 |
3.4 |
1.3 |
76 |
31.4 |
7.55 |
4.4 |
241.8 |
39 |
F |
24 |
7.3 |
3.6 |
67.3 |
37.9 |
3.89 |
8.3 |
305.4 |
40 |
F |
19 |
4.2 |
3 |
69.3 |
27 |
5.13 |
5.3 |
185.7 |
41 |
F |
66 |
4.1 |
1.5 |
74.7 |
32.9 |
7.5 |
5.0 |
247.2 |
42 |
F |
48 |
6.2 |
3.1 |
61.6 |
35.2 |
20.07 |
8.6 |
471.6 |
43 |
F |
29 |
6.6 |
3 |
59 |
30.9 |
4.46 |
8.9 |
222.3 |
44 |
F |
48 |
8.2 |
4.6 |
61.3 |
28.2 |
2.66 |
9.3 |
195.5 |
45 |
F |
32 |
3.2 |
2.7 |
62.5 |
28.6 |
5.83 |
5.2 |
201.6 |
46 |
F |
46 |
9.8 |
2.1 |
67.4 |
32.3 |
5.94 |
11.6 |
238.9 |
47 |
F |
24 |
4.9 |
1.2 |
77.6 |
31.5 |
8.85 |
5.8 |
253.5 |
48 |
F |
48 |
7.8 |
4.3 |
52.3 |
26.2 |
3.69 |
10.4 |
179.3 |
49 |
F |
18 |
9.6 |
15.8 |
43.4 |
20 |
1.36 |
12.4 |
127.1 |
50 |
F |
55 |
4.1 |
1.5 |
74.7 |
32.9 |
7.5 |
5.0 |
247.2 |
51 |
F |
23 |
12.1 |
3.6 |
56.3 |
24.7 |
3.83 |
14.2 |
164.2 |
52 |
F |
24 |
8.3 |
1.8 |
71.6 |
34 |
6.25 |
9.4 |
249.4 |
53 |
F |
30 |
11.5 |
7.4 |
51.9 |
25.9 |
1.82 |
13.6 |
175.4 |
54 |
F |
29 |
6.8 |
5.8 |
60.1 |
28.6 |
3.58 |
8.2 |
207.1 |
55 |
F |
20 |
7.3 |
8.3 |
67.7 |
20.4 |
4.19 |
8.3 |
128.6 |
56 |
F |
28 |
9.8 |
2.1 |
69 |
27.3 |
5.85 |
11.0 |
188.0 |
57 |
F |
19 |
9.7 |
5.1 |
61.1 |
21.7 |
3.33 |
11.1 |
138.9 |
58 |
F |
31 |
10.2 |
|
58 |
19.5 |
2.84 |
11.8 |
121.8 |
59 |
F |
40 |
5.5 |
1.6 |
71.9 |
34.1 |
7.91 |
6.8 |
259.7 |
60 |
F |
43 |
6.8 |
3 |
64.7 |
46.2 |
13.18 |
11.1 |
431.8 |
61 |
F |
46 |
7.2 |
1.3 |
74.3 |
32.3 |
8.42 |
8.5 |
240.2 |
62 |
F |
60 |
8.1 |
1.7 |
71.8 |
37.4 |
9.63 |
9.8 |
299.5 |
63 |
F |
61 |
9.8 |
2.7 |
61.8 |
40.1 |
4.66 |
12.0 |
336.1 |
64 |
F |
61 |
5.8 |
3.4 |
71 |
27.2 |
4.41 |
6.5 |
187.3 |
65 |
F |
76 |
9.2 |
2.5 |
66.1 |
27.5 |
4.63 |
10.7 |
190.7 |
66 |
F |
86 |
3.1 |
|
33.6 |
2.4 |
0.98 |
2.9 |
13.1 |
67 |
F |
87 |
7.2 |
2.4 |
64.1 |
36.4 |
5.27 |
9.5 |
287.2 |
68 |
F |
88 |
8 |
2 |
68.9 |
35 |
5.44 |
9.8 |
269.9 |
69 |
F |
88 |
5.6 |
2 |
69 |
31.9 |
6.31 |
7.0 |
234.6 |
70 |
F |
91 |
7.8 |
2.4 |
65.3 |
35.2 |
4.83 |
9.4 |
273.1 |
71 |
F |
92 |
16.1 |
3.7 |
53.7 |
34.8 |
4.09 |
19.7 |
267.9 |
Median |
29 |
8 |
3.5 |
61.6 |
28.3 |
4.55 |
10.3 |
201.6 |
|
SD |
23 |
3.02 |
3.11 |
10.01 |
7.41 |
3.52 |
3.5 |
86.7 |
|
Table 2: Demographics and medication usage and TEG of PPP of type 2 diabetes patients.
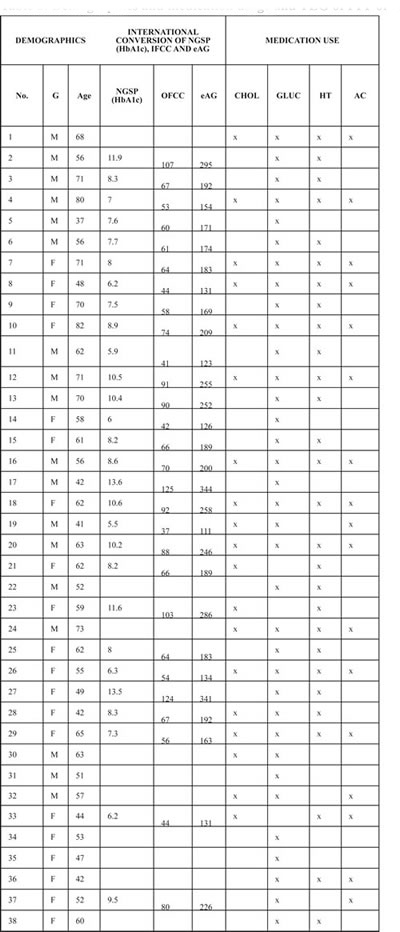
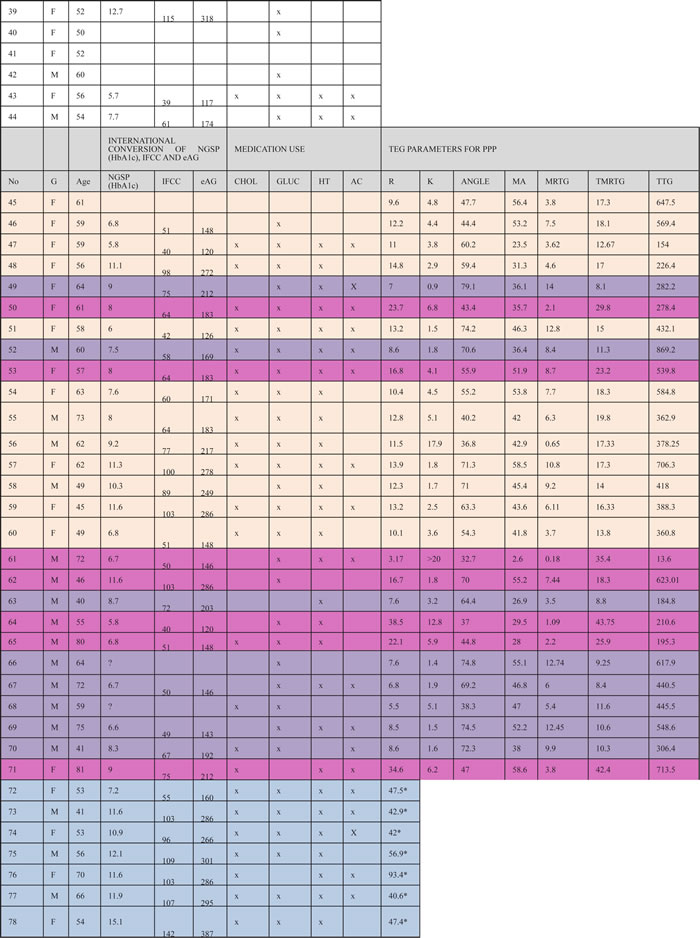
From patient 45 we did TEG analysis. Blue bars show hypocoagulable individuals; purple bars show hypercoagulable individuals; pink bars show pseudohypocoagulable profile and tan bar shows pseudo-standard clotting profile.
G: Gender
NGSP: HbA1c (%): (< 7%) percentages in red are too high; IFCC: HbA1c (mmol.mol) and eAG (mg.dL-1)
CHOLESTROL MEDICATION (CHOL): Dyslipidaemia: Simvastatin, Lipitor
GLUCOSE CONTROL (GLUC): Metformin / Oral
HYPERTENSION MEDICATION (HT): Coversyl, Amlodopin, Carvedilol, Adalat
ANTICOAGULANT MEDICATION (AC): Aspirin or Disprin
TEG of healthy individuals show trends typically associated with healthy viscoelastic parameters [36-38]. SEM micrographs of healthy individuals show well-structured elongated fibres, with open spaces that form a stable clot structure (Figure 2A). This is in line with previous structural analysis of healthy fibrin fibres [7, 19, 39-41]. The diabetes TEG analyses (Figure 1A and 1B) and SEM results Figure 2B to 2E) show four possible trends. These trends are:
1. No R-time established after 30 minutes; no TTG reached (Figure 1B) possible (hypocoagulable profile). Clot ultrastructure has a fine-netted appearance, with no visible elongated fibres (Figure 2B). See patient 72 to 90 and discussion in the next paragraphs. This suggests that the PPP never forms a stabilized fibrin clot in the TEG.
Table 3: Median and SD analysis of ALL diabetes patients.
DEMOGRAPHICS |
International conversions of NGSP, IFCC and eAG |
TEG PARAMETERS FROM PPP |
|||||||||
Age |
NGSP (HbA1c) |
IFCC |
eAG |
R |
K |
Angle |
MA |
MRTG |
TMRTG |
TTG |
|
Median |
59.0 |
8.3 |
67 |
192 |
12.2 |
3.4 |
59.4 |
43.6 |
6.1 |
17.0 |
418.0 |
SD |
± 9.9 |
± 2.3 |
± 24.9 |
± 65.6 |
± 9.3 |
± 3.8 |
± 14.4 |
± 12.9 |
± 3.9 |
± 9.6 |
± 202.6 |
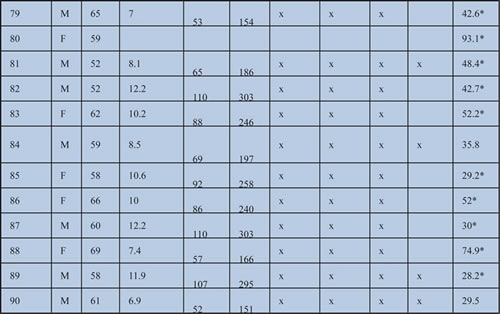
TEG parameters were calculated from patient 45, and patient 72 to 90 only have R-values.
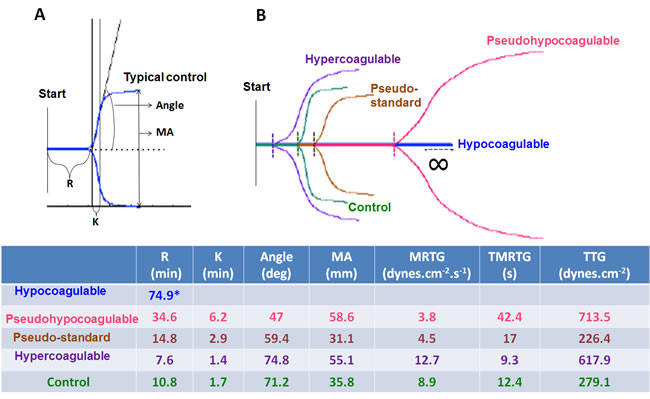
Figure 1: A. Healthy control plasma coagulation TEG trace showing the different parameters: R: Reaction time, first measurable clot formation; K: Achievement of clot firmness; Angle: Kinetics of clot development; MA: Maximum clot strength; MRTG: Maximum rate of thrombus generation; TMRTG: Time to maximum rate of thrombus generation; TTG: Final clot strength. B. Healthy TEG trace shown in green projected onto the 4 different trace types seen in type 2 diabetes.
2 R-time > 30 minutes, overall increased clot strength, and time to maximum thrombus generation is prolonged, with variable TTG (Figure 1B) (pseudo-hypocoagulable profile. SEM showed mainly a fine and netted clot, with limited thick fibres (as typically present in the controls) (Figure 2C). This suggests that the PPP forms a flimsy fibrin clot.
3. R-time from 8 up to 14.9 minutes and TTG or clot strength from 100 to 500 dynes.cm-2 (Figure 1B) (pseudo-standard clotting profile). SEM showed densely packed elongated fibres, arranged in plates with no fine nets (Figure 2D).
4. R-time < 8 minutes with TTG > 500 dynes.cm-2. TMRTG is increased, suggesting an increased clot strength (Figure 1B) (hypercoagulable profile). SEM showed matted plates, with limited areas that actually showed individual fibrin fibres or even fine nets (Figure 2E).
Table 4: TEG parameters typically generated for platelet poor plasma [43, 61, 62].
THROMBOELASTIC PARAMETERS |
|
R value: reaction time measured in minutes |
Time of latency from start of test to initial fibrin formation (amplitude of 2mm); i.e. initiation time |
K: kinetics measured in minutes |
Time taken to achieve a certain level of clot strength (amplitude of 20mm); i.e. amplification |
Α (Alpha): Angle (slope between the traces represented by R and K) Angle is measured in degrees |
The angle measures the speed at which fibrin build up and cross linking takes place, hence assesses the rate of clot formation; i.e. thrombin burst |
MA: Maximal Amplitude measured in mm |
Maximum strength/stiffness of clot. Reflects the ultimate strength of the fibrin clot, i.e. overall stability of the clot |
Maximum rate of thrombus generation (MRTG) measured in Dyn.cm-2.s-1 |
The maximum velocity of clot growth observed or maximum rate of thrombus generation using G, where G is the elastic modulus strength of the thrombus in dynes per cm-2 |
Time to maximum rate of thrombus generation (TMRTG) measured in minutes |
The time interval observed before the maximum speed of the clot growth |
Total thrombus generation (TTG) measured in Dyn.cm-2 |
The clot strength: the amount of total resistance (to movement of the cup and pin) generated during clot formation. This is the total area under the velocity curve during clot growth, representing the amount of clot strength generated during clot growth |
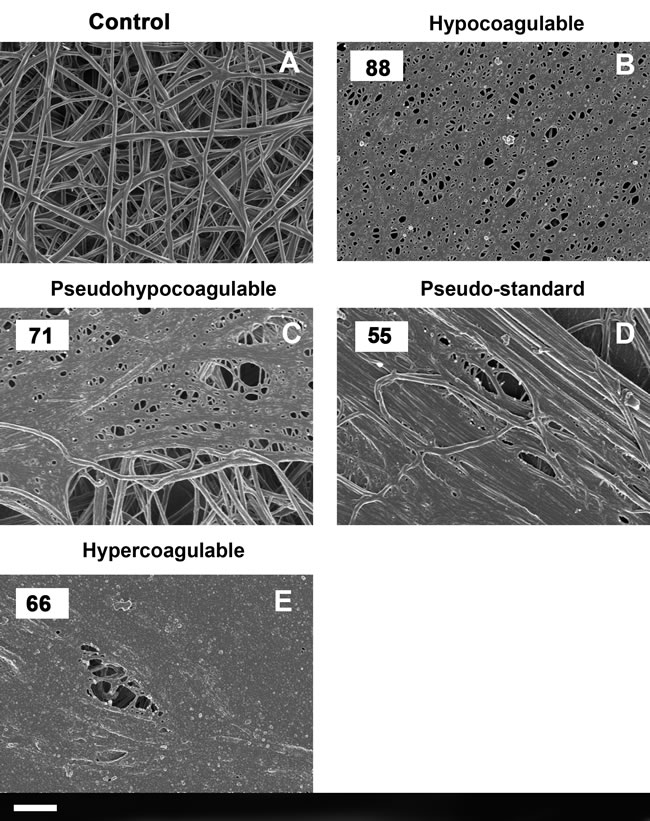
Figure 2: A. A typical healthy fibrin fibre net versus B. to E.) typical type 2 diabetes fibrin fiber nets according to the four types identified with TEG. (Numbers in the top left corner correspond with patient number in Table 3). Scale bar: 1 μm.
Discussion
Thromboelastography is a technique that shows coagulation kinetics data, and the technique has been extensively utilized in the monitoring of haemostasis during surgery. It is therefore known as a point-of-care instrument, and it can show hypercoagulable and hypofibrinolytic states. We have previously shown that it can be used to study viscoelastic properties in Alzheimer’s disease and that these properties correlate with ultrastructural (SEM) analysis of fibrin fibres [42, 43].
Type 2 diabetes is classified as an inflammatory condition, and most patients have glucose dysregulation and cardiovascular comorbidities, including hyperlipidaemia and hypertension. Inflammatory conditions are known to affect clotting, fibrin structure and also erythrocyte function and structure [18-22, 44]. In type 2 diabetes, this hypercoagulability is also mediated by enhanced erythrocyte pathology, which in turn, could promote thrombosis and hypercoagulation [7, 23, 24, 45]. Platelets are also known to play important roles in hypercoagulation and thrombosis [46, 47]; and are changed in diabetes [19, 48, 49]. Either hypercoagulability [25-27, 50-54]; or reduced clot permeability; or decreased susceptibility of clots to undergo (fibrino)lysis, have previously been reported [21, 26, 28-31, 51, 54-58]. Increased glucose levels may also play an important role in fibrin fibre packaging, where glycation of fibrinogen may cause changes in structural packaging of fibrinogen into fibrin [32-34, 57].
Type 2 diabetes is therefore a complex disease associated with a multifaceted systemic inflammatory profile, and although the type 2 diabetes patients in our sample group were on a plethora of medication, in many cases, they were still poorly controlled. Despite the fact that many were also on anticoagulant treatment, their TEG coagulation profiles still varied greatly, suggesting that their coagulation processes were not correctly controlled.
In Tables 1 and 2, we showed all individual data of the controls and diabetes sample. This was done to stress that the individual type 2 diabetes sample results are greatly variable. Table 3 shows median and SD of all diabetes patients. Patient 72 to 90 only have R-values. A Tukey analysis was performed (it compares the means of every TEG parameter to the means of every other parameter) of all the TEG parameters of the controls to that of the diabetes sample. All comparative p-values were P > 0.9999. These results suggest that if diabetes data is compared using the total sample, without taking individual variability into account, we may loose valuable information regarding the individual patient. Therefore our findings support our plea to follow an individualized medicine approach in the treatment and disease tracking of diabetes type 2 patients. Our results also show that the coagulation profiles of our patients can be classified into four groups, as seen with TEG, and confirmed with SEM. Now, for the first time we show the possibility of a graded clotting classification, as the patients’ coagulation profiles vary from hypocoagulable to hypercoagulable. We acknowledge that the results indicated as the “hypocoagulable group” (shown as patient 72 to 90) are unusual.
We note that:
• Throughout the thrombelastographic literature, the only time one sees “flatline” TEG traces is after near fatal snakebite, liver transplantation, or life threatening coagulopathies of congenital or acquired conditions. However, none of these patients had these conditions.
• Also, the anticoagulant medication used by the diabetic group would be expected to affect platelets, not plasmatic coagulation kinetics.
• Even in patients with “flatline” TEG results, fibrin fibres could be formed when thrombin was added to the PPP, and their fibres did not look overly different from what we have seen in the “typical” diabetes population.
• We have never seen such traces in healthy individuals.
Possible reasons for such traces might be:
• The fibrinogen could have auto-polymerized in the citrated sample after thawing.
• Patients might have had carbon monoxide exposure; such an event removes fibrinogen from the sample, resulting in loss of TEG signal.
• Wrong laboratory procedures e.g. pipette usage when calcium was added.
Although we confirm that none of the above happened, we also do not have any physiological explanation for this phenomenon at present, except that a “false” “flatline” R-time is shown due to an inability of the TEG to initiate clotting. Previously it was reported that it is easier to dissolve clots that consist of fewer thick fibres than those that consist of many thin fibres, and this is consistent with experimental and clinical observations [59]. As mentioned, increased glucose levels may also play an important role in fibrin fibre packaging where glycation of fibrinogen may cause changes in structural packaging of fibrinogen into fibrin [32-34, 57]. Further studies regarding the coagulation process of type 2 diabetes is therefore suggested.
We conclude by suggesting that the only way to treat any type 2 diabetes patient, is to follow an individualized patient tracking approach, instead of a generalized clinical approach. Such an individualised approach using information from viscoelastic parameters may play a fundamental role in a precision-medicine approach, together with genome-based analysis and metabolomics data. We are currently not winning the race to reduce diabetes prevalence; to the contrary, our staggering type 2 diabetes and pre-diabetes statistics attest the fact that this disease is out of control [4, 5]. We therefore need to improve our understanding of inflammation and the role of abnormal clotting seen in type 2 diabetes patients. Clotting and coagulation in general, is an important marker of healthiness. However, if we use clotting potential as a marker of healthiness, we need to validate novel applications in clinical practice. Techniques like TEG, the global thrombosis test (GTT) and possibly also SEM may allow us to accomplish a truly individualized approach to diabetes patient care. Eventually, data from such techniques may ultimately be used in precision medicine.
Materials and Methods
Healthy individuals were screened and chosen to participate in the study if they did not have any chronic condition, did not smoke or if female, use any hormone replacement or contraception. Diabetic individuals were chosen arbitrarily from the diabetic clinic at the Steve Biko Academic Hospital, South Africa. The patients were diagnosed according to the SEMSDA guidelines (http://www.semdsa.org.za/files/Diabetes%20Guidelines%202009.pdf). These guidelines follow the American Diabetes Association (ADA) criteria to define type 2 diabetes. Citrated blood was collected for thromboelastography (TEG) and scanning electron microscopy studies (SEM). Ethical clearance was obtained from the Health Sciences Ethical Committee of the University of Pretoria.
Blood was collected in 4mL plastic citrate tubes and this collection and all handling of samples were performed under very strictly controlled aseptic conditions. A medical practitioner identified and recruited the patients, and collected the data regarding the medication usage. The same individual collected all the blood samples from the type 2 diabetes group, as well as the blood from the recruited healthy individuals. Citrated blood was left at room temperature for at least 30 minutes at no longer than 2 hours, followed by centrifuging and collecting of platelet poor plasma (PPP), which was immediately stored at -80 degrees C. On the day of the analysis, 340 µl of PPP was placed in a cup in the computer-controlled thrombelastograph® haemostasis system (Model 5000, Hemoscope, Niles, IL), together with 20 µl of 200 mM CaCl2, to initiate clotting. We ran control samples and diabetes samples on the same days, in order to minimize TEG variability. We also randomly (blinded) repeated analysis of samples to confirm results.
Data were collected until maximum elastic modulus (MG) is reached or 60 min had elapsed [60]. TEG traces show the following parameters: R: Reaction time, first measurable clot formation; K: Achievement of clot firmness; Angle: Kinetics of clot development; MA: Maximum clot strength; MRTG: Maximum rate of thrombus generation; TMRTG: Time to maximum rate of thrombus generation; TTG Final clot strength (for a detailed discussion of parameters also see Table 4). The StatsDirect program was used for statistical analysis.
Extensive fibrin fibre networks for ultrastructural analysis were created using the same PPP stored for use in the TEG, by adding 20 µl of PPP to 10 µl thrombin (preparation as previously described [7]). Samples were viewed using a high-resolution crossbeam 540 Zeiss scanning electron microscope.
Acknowledgments
Thank you to Dr Prashilla Soma who managed the patient recruitment and phlebotomy.
conflicts of interest
The authors (EP and JB) do not have any conflict of interest to declare.
Funding
Funding: National Research Foundation (NRF) of South Africa (91548: Competitive Program) and Medical Research Council (MRC) of South Africa (Self-Initiated Research Program: A0X331). Grant holder: E Pretorius.
Author contribution
EP and JB equally contributed in researched data, writing and in reviewing/editing the manuscript.
REFERENCES
1. Chikowore T, Conradie KR, Towers GW and van Zyl T. Common Variants Associated with Type 2 Diabetes in a Black South African Population of Setswana Descent: African Populations Diverge. Omics. 2015; 19(10):617-626.
2. Camara A, Balde NM, Sobngwi-Tambekou J, Kengne AP, Diallo MM, Tchatchoua AP, Kake A, Sylvie N, Balkau B, Bonnet F and Sobngwi E. Poor glycemic control in type 2 diabetes in the South of the Sahara: the issue of limited access to an HbA1c test. Diabetes Res Clin Pract. 2015; 108(1):187-192.
3. Sharma M, Nazareth I and Petersen I. Trends in incidence, prevalence and prescribing in type 2 diabetes mellitus between 2000 and 2013 in primary care: a retrospective cohort study. BMJ Open. 2016; 6(1):e010210.
4. CDC. (2014). National Diabetes Statistics Report. (http://templatelab.com/national-diabetes-report-2014/) Centers for Disease Control and Prevention). Accessed May 2016.
5. Klein MS and Shearer J. Metabolomics and Type 2 Diabetes: Translating Basic Research into Clinical Application. J Diabetes Res. 2016; 2016:3898502.
6. American-Diabetes-Association. (2016). http://www.diabetes.org/. Accessed May 2016.
7. Pretorius E, Bester J, Vermeulen N, Alummoottil S, Soma P, Buys AV and Kell DB. Poorly controlled type 2 diabetes is accompanied by significant morphological and ultrastructural changes in both erythrocytes and in thrombin-generated fibrin: implications for diagnostics. Cardiovasc Diabetol. 2015; 14:30.
8. Cucuianu M and Coca M. Thrombotic tendency in diabetes mellitus. Revisiting and revising a study initiated 30 years ago. Rom J Intern Med. 2012; 50(2):107-115.
9. Kim HK, Kim JE, Park SH, Kim YI, Nam-Goong IS and Kim ES. High coagulation factor levels and low protein C levels contribute to enhanced thrombin generation in patients with diabetes who do not have macrovascular complications. J Diabetes Complications. 2014; 28(3):365-369.
10. Tousoulis D, Papageorgiou N, Androulakis E, Siasos G, Latsios G, Tentolouris K and Stefanadis C. Diabetes mellitus-associated vascular impairment: novel circulating biomarkers and therapeutic approaches. J Am Coll Cardiol. 2013; 62(8):667-676.
11. Schoenberger SD, Kim SJ, Sheng J, Rezaei KA, Lalezary M and Cherney E. Increased prostaglandin E2 (PGE2) levels in proliferative diabetic retinopathy, and correlation with VEGF and inflammatory cytokines. Invest Ophthalmol Vis Sci. 2012; 53(9):5906-5911.
12. Goldberg RB. Cytokine and cytokine-like inflammation markers, endothelial dysfunction, and imbalanced coagulation in development of diabetes and its complications. J Clin Endocrinol Metab. 2009; 94(9):3171-3182.
13. Wang X, Bao W, Liu J, Ouyang YY, Wang D, Rong S, Xiao X, Shan ZL, Zhang Y, Yao P and Liu LG. Inflammatory markers and risk of type 2 diabetes: a systematic review and meta-analysis. Diabetes Care. 2013; 36(1):166-175.
14. Kampoli AM, Tousoulis D, Briasoulis A, Latsios G, Papageorgiou N and Stefanadis C. Potential pathogenic inflammatory mechanisms of endothelial dysfunction induced by type 2 diabetes mellitus. Curr Pharm Des. 2011; 17(37):4147-4158.
15. Lathief S and Inzucchi SE. Approach to diabetes management in patients with CVD. Trends Cardiovasc Med. 2016; 26(2):165-179.
16. Welty FK, Alfaddagh A and Elajami TK. Targeting inflammation in metabolic syndrome. Transl Res. 2016; 167(1):257-280.
17. Barnett AH. Complementing insulin therapy to achieve glycemic control. Adv Ther. 2013; 30(6):557-576.
18. Buys AV, Van Rooy MJ, Soma P, Van Papendorp D, Lipinski B and Pretorius E. Changes in red blood cell membrane structure in type 2 diabetes: a scanning electron and atomic force microscopy study. Cardiovasc Diabetol. 2013; 12(1):25.
19. Pretorius E, Oberholzer HM, van der Spuy WJ, Swanepoel AC and Soma P. Qualitative scanning electron microscopy analysis of fibrin networks and platelet abnormalities in diabetes. Blood Coagul Fibrinolysis. 2011; 22(6):463-467.
20. Pretorius E, Lipinski B, Bester J, Vermeulen N and Soma P. Albumin stabilizes fibrin fiber ultrastructure in low serum albumin type 2 diabetes. Ultrastruct Pathol. 2013; 37(4):254-257.
21. Bochenek M, Zalewski J, Sadowski J and Undas A. Type 2 diabetes as a modifier of fibrin clot properties in patients with coronary artery disease. J Thromb Thrombolysis. 2013; 35(2):264-270.
22. Dunn EJ, Philippou H, Ariëns RA and Grant PJ. Molecular mechanisms involved in the resistance of fibrin to clot lysis by plasmin in subjects with type 2 diabetes mellitus. Diabetologia. 2006; 49(5):1071-1080.
23. Pretorius E. The adaptability of red blood cells. Cardiovasc Diabetol. 2013; 12:63.
24. Pretorius E and Kell DB. Diagnostic morphology: biophysical indicators for iron-driven inflammatory diseases. Integr Biol. 2014; 6:486-510.
25. Tripodi A, Branchi A, Chantarangkul V, Clerici M, Merati G, Artoni A and Mannucci PM. Hypercoagulability in patients with type 2 diabetes mellitus detected by a thrombin generation assay. J Thromb Thrombolysis. 2011; 31(2):165-172.
26. Ye Y, Perez-Polo JR, Aguilar D and Birnbaum Y. The potential effects of anti-diabetic medications on myocardial ischemia-reperfusion injury. Basic Res Cardiol. 2011; 106(6):925-952.
27. Beijers HJBH, Ferreira I, Spronk HMH, Bravenboer B, Dekker JM, Nijpels G, ten Cate H and Stehouwer CDA. Impaired glucose metabolism and type 2 diabetes are associated with hypercoagulability: potential role of central adiposity and low-grade inflammation--the Hoorn Study. Thromb Res. 2012; 129(5):557-562.
28. Alzahrani SH, Hess K, Price JF, Strachan M, Baxter PD, Cubbon R, Phoenix F, Gamlen T, Ariëns RAS, Grant PJ and Ajjan RA. Gender-specific alterations in fibrin structure function in type 2 diabetes: associations with cardiometabolic and vascular markers. J Clin Endocrinol Metab. 2012; 97(12):E2282-2287.
29. Hess K, Alzahrani SH, Mathai M, Schroeder V, Carter AM, Howell G, Koko T, Strachan MW, Price JF, Smith KA, Grant PJ and Ajjan RA. A novel mechanism for hypofibrinolysis in diabetes: the role of complement C3. Diabetologia. 2012; 55(4):1103-1113.
30. Walus-Miarka M, Wolkow P, Cyganek K, Mirkiewicz-Sieradzka B, Malecki MT and Undas A. Altered fibrin-clot properties are associated with retinopathy in type 2 diabetes mellitus. Diabetes & Metabolism. 2012; 38(5):462-465.
31. Konieczynska M, Fil K, Bazanek M and Undas A. Prolonged duration of type 2 diabetes is associated with increased thrombin generation, prothrombotic fibrin clot phenotype and impaired fibrinolysis. Thromb Haemost. 2014; 111(4):685-693.
32. Pieters M, Covic N, Loots du T, van der Westhuizen FH, van Zyl DG, Rheeder P, Jerling JC and Weisel JW. The effect of glycaemic control on fibrin network structure of type 2 diabetic subjects. Thromb Haemost. 2006; 96(5):623-629.
33. Pieters M, Covic N, van der Westhuizen FH, Nagaswami C, Baras Y, Toit Loots D, Jerling JC, Elgar D, Edmondson KS, van Zyl DG, Rheeder P and Weisel JW. Glycaemic control improves fibrin network characteristics in type 2 diabetes - a purified fibrinogen model. Thromb Haemost. 2008; 99(4):691-700.
34. Hoffman M. Alterations of fibrinogen structure in human disease. Cardiovasc Hematol Agents Med Chem. 2008; 6(3):206-211.
35. Collins FS and Varmus H. A new initiative on precision medicine. N Engl J Med. 2015; 372(9):793-795.
36. Nielsen VG, Kirklin H.K., Hoogendoorn H, Ellis T.C., Holman W.L. Thromboelastographic method to quantify the contribution of factor XIII to coagulation kinetics. Blood Coagul Fibrinolysis. 2007; 18(2):145-150.
37. Nielsen VG. Beyond cell based models of coagulation: analyses of coagulation with clot “lifespan” resistance-time relationships. Thromb Res. 2008; 122(2):145-152.
38. Nielsen VG, Lyerly RT and Gurley WQ. The effect of dilution on plasma coagulation kinetics determined by thrombelastography is dependent on antithrombin activity and mode of activation. Anesthesia and Analgesia. 2004; 99(6):1587-1592.
39. Lipinski B, Pretorius E, Oberholzer HM and van der Spuy WJ. Interaction of fibrin with red blood cells: the role of iron. Ultrastruct Pathol. 2012; 36(2):79-84.
40. Pretorius E. Quantifying changes in fibrin fiber network morphology. Ultrastruct Pathol. 2011; 35(4):150-154.
41. Pretorius E, Briedenhann S, Marx J and Franz RC. Structural changes in the fibrin network of a pretoria family with dysfibrinogenemia: a scanning electron microscopical study. Ultrastruct Pathol. 2006; 30(3):167-176.
42. Nielsen VG, Pretorius E, Bester J, Jacobsen WK, Boyle PK and Reinhard JP. Carbon monoxide and iron modulate plasmatic coagulation in Alzheimer’s disease. Curr Neurovasc Res. 2015; 12(1):31-39.
43. Bester J, Soma P, Kell DB and Pretorius E. Viscoelastic and ultrastructural characteristics of whole blood and plasma in Alzheimer-type dementia, and the possible role of bacterial lipopolysaccharides (LPS). Oncotarget Gerontology. 2015; 6(34):35284-35303.
44. Lang E, Qadri SM and Lang F. Killing me softly - suicidal erythrocyte death. Int J Biochem Cell Biol. 2012; 44(8):1236-1243.
45. Lang F and Qadri SM. Mechanisms and significance of eryptosis, the suicidal death of erythrocytes. Blood Purif. 2012; 33(1-3):125-130.
46. Wang Y, Carrim N and Ni H. Fibronectin orchestrates thrombosis and hemostasis. Oncotarget. 2015; 6(23):19350-19351. doi: 10.18632/oncotarget.5097.
47. Bergmeier W and Stefanini L. Platelet signaling--blood’s great balancing act. Oncotarget. 2015; 6(24):19922-19923. doi: 10.18632/oncotarget.5122.
48. Grove EL and Gregersen S. Antiplatelet therapy in patients with diabetes mellitus. Curr Vasc Pharmacol. 2012; 10(4):494-505.
49. Salem MA, Adly AA, Ismail EA, Darwish YW and Kamel HA. Platelets microparticles as a link between micro- and macro-angiopathy in young patients with type 1 diabetes. Platelets. 2015:1-7.
50. Carr ME. Diabetes mellitus: a hypercoagulable state. J Diabet Complic. 2001; 15(1):44-54.
51. Banga JD. Coagulation and fibrinolysis in diabetes. Semin Vasc Med. 2002; 2(1):75-86.
52. Thor M, Yu A and Swedenborg J. Markers of inflammation and hypercoagulability in diabetic and nondiabetic patients with lower extremity ischemia. Thromb Res. 2002; 105(5):379-383.
53. Aras R, Sowers JR and Arora R. The proinflammatory and hypercoagulable state of diabetes mellitus. Rev Cardiovasc Med. 2005; 6(2):84-97.
54. Grant PJ. Diabetes mellitus as a prothrombotic condition. J Intern Med. 2007; 262(2):157-172.
55. Cucuianu M, Fekete T, Marcusiu C, Mosler R and Dutu A. Fibrinolysis in diabetes mellitus. Role of overweight and hypertriglyceridemia. Medecine interne. 1984; 22(3):171-177.
56. Yano Y, Kitagawa N, Gabazza EC, Morioka K, Urakawa H, Tanaka T, Katsuki A, Araki-Sasaki R, Hori Y, Nakatani K, Taguchi O, Sumida Y and Adachi Y. Increased plasma thrombin-activatable fibrinolysis inhibitor levels in normotensive type 2 diabetic patients with microalbuminuria. The Journal of clinical endocrinology and metabolism. 2003; 88(2):736-741.
57. Dunn EJ, Ariëns RAS and Grant PJ. The influence of type 2 diabetes on fibrin structure and function. Diabetologia. 2005; 48(6):1198-1206.
58. Alzahrani SH and Ajjan RA. Coagulation and fibrinolysis in diabetes. Diabet Vasc Dis Res. 2010; 7(4):260-273.
59. Li W, Sigley J, Pieters M, Helms CC, Nagaswami C, Weisel JW and Guthold M. Fibrin Fiber Stiffness Is Strongly Affected by Fiber Diameter, but Not by Fibrinogen Glycation. Biophys J. 2016; 110(6):1400-1410.
60. Nielsen VG and Pretorius E. Iron-enhanced coagulation is attenuated by chelation A thrombelastographic and ultrastructural analysis. Blood Coagul Fibrinolysis. 2014; 25(8):845-850.
61. de Villiers S, Swanepoel A, Bester J and Pretorius E. Novel Diagnostic and Monitoring Tools in Stroke: an Individualized Patient-Centered Precision Medicine Approach. J Atheroscler Thromb. 2016; 23(5):493-504.
62. Nielsen VG and Boyer LV. Iron and carbon monoxide attenuate degradation of plasmatic coagulation by Crotalus atrox venom. Blood Coagul Fibrinolysis. 2015.