
INTRODUCTION
Worldwide, cancer is currently the main cause of death and a public health problem that seriously threatens human health [1]. Biological and epidemiological studies have shown that carcinogenesis is a sophisticated, multivariate process resulting from interactions between genetic and environmental factors [2]. However, the exact mechanism of carcinogenesis has not been fully elucidated. Many aspects of malignant cancers, including carcinogenesis, aberrant growth, metastasis, and angiogenesis, have been attributed to reactive oxygen species (ROS) [3]. Such ROS-mediated damage to cellular macromolecules is thought to accumulate as a function of age, thus promoting carcinogenesis [4, 5].
Catalase (CAT) is an important endogenous antioxidant enzyme that decomposes hydrogen peroxide to oxygen and water, thus limiting the deleterious effects of ROS[6]; accordingly, the CAT gene may play an important role in substance metabolism. CAT is located on the nuclear chromosome 11p13, and polymorphisms in this gene have been reported to associate with the development of many types of cancer, such as invasive cervical cancer and prostate cancer [7].
The rs1001179 polymorphism (C-262T) is located in the promoter region of CAT, where it influences transcription factor binding and alters the basal transcription and consequent expression of the encoded enzyme [8]. The rs794316 polymorphism (A-15 T) has been identified in the promoter region near the CAT start site, and the endogenous variability of this promoter likely plays a role in the host response to oxidative stress [9]. A large number of previous studies in humans have suggested a possible correlation between genetic polymorphisms of CAT and susceptibility to cancers, such as prostate cancer [10-14], breast cancer [15], and hepatocellular carcinoma [16-19]. However, those studies published inconsistent results. Accordingly, we conducted a meta-analysis to combine data from all of the available case-control studies in order to validate the association of CAT polymorphisms with cancer risk.
RESULTS
Characteristics of included studies
A flow chart of the study selection process is shown in Figure 1. Initially, 374 articles were identified. After reading the titles and abstracts of all the articles, 310 were excluded (164 articles were not related to cancer patients, 137 articles were not case-control studies and 9 articles were about other polymorphisms). After searching through the full texts of the remaining articles, an additional 15 were excluded, including 9 articles that contained no useful data and 6 articles that had re-reported data. Finally, a total of 37 studies from 29 published articles, involving 14,942 cases and 43,285 cancer-free controls, were included in this meta-analysis. The eligible studies presented data for several different cancer types, including prostate cancer, hepatocellular carcinoma, breast cancer, and colorectal cancer. Among these studies, 10 were based on Asian populations [9, 13, 15-17, 20-22], 20 on Caucasian populations [7, 10, 11, 14, 18, 23-33], 1 on an African population [14], and 6 on mixed-ethnicity populations [12, 19, 31, 34-36]. Furthermore, in 3 studies, the genotype distributions of the control groups departed from Hardy-Weinberg equilibrium (HWE) [7, 10, 20]. The characteristics of the eligible studies are presented in Table 1.
Table 1: Characteristics of the studies included in the meta-analysis
First author |
Year |
Country |
Ethnicity |
Genotyping medthod |
Source of control |
Cancer type |
Total sample size (case/control) |
HWE |
SNP |
Sousa |
2016 |
Brazil |
Mixed |
Taqman |
hospital |
HCC |
106/139 |
0.44 |
rs1001179 |
Castaldo |
2015 |
Portugal |
Caucasian |
PCR |
population |
CC |
119/106 |
0.00 |
rs1001179 |
Geybels |
2015 |
Netherland |
Caucasian |
PCR |
population |
PC |
1529/25184 |
0.00 |
rs1001179 |
Liu |
2015 |
China |
Asian |
PCR-RFLP |
hospital |
HCC |
266/248 |
0.68 |
rs1001179 |
Saadat |
2015 |
Iran |
Caucasian |
PCR |
population |
BC |
407/395 |
0.40 |
rs1001179 |
Su-1 |
2015 |
China |
Asian |
PCR-RFLP |
hospital |
HCC |
301/186 |
0.49 |
rs1001179 |
Su-2 |
2015 |
China |
Asian |
PCR-RFLP |
hospital |
HCC |
99/294 |
0.83 |
rs1001179 |
Banescu |
2014 |
Romania |
Caucasian |
PCR-RFLP |
population |
CML |
168/321 |
0.47 |
rs1001179 |
Aynali |
2013 |
Turkey |
Caucasian |
PCR-RFLP |
hospital |
Laryngeal cancer |
25/23 |
0.13 |
rs1001179 |
Tefik |
2013 |
Turkey |
Caucasian |
PCR-RFLP |
population |
PC |
155/195 |
0.07 |
rs1001179 |
Ding |
2012 |
China |
Asian |
PCR |
population |
PC |
1417/1008 |
0.86 |
rs1001179 |
Farawela |
2012 |
Egypt |
Caucasian |
PCR-RFLP |
population |
NHL |
100/100 |
0.49 |
rs1001179 |
Karunasinghe |
2012 |
New Zealand |
Mixed |
Taqman |
population |
PC |
258/567 |
0.42 |
rs1001179 |
Tsai |
2012 |
Taiwan |
Asian |
PCR |
hospital |
BC |
260/224 |
0.44 |
rs1001179 |
Chang |
2012 |
China |
Asian |
PCR-RFLP |
population |
CRC |
880/848 |
0.00 |
rs794316 |
Nahon |
2011 |
France |
Caucasian |
Taqman |
hospital |
HCC |
84/55 |
0.62 |
rs1001179 |
Ezzikouri |
2010 |
France |
Mixed |
PCR-RFLP |
population |
HCC |
96/222 |
0.59 |
rs1001179 |
He-1 |
2010 |
USA |
Caucasian |
Taqman |
population |
BCC |
270/796 |
0.89 |
rs1001179 |
He-2 |
2010 |
USA |
Caucasian |
Taqman |
population |
Melanoma |
211/796 |
0.89 |
rs1001179 |
He-3 |
2010 |
USA |
Caucasian |
Taqman |
population |
SCC |
266/796 |
0.89 |
rs1001179 |
Tang |
2010 |
USA |
Mixed |
Taqman |
population |
Pancreatic cancer |
551/602 |
0.97 |
rs1001179 |
Wu |
2010 |
Taiwan |
Asian |
PCR-RFLP |
hospital |
OCC |
122/122 |
0.18 |
rs794316 |
Funke |
2009 |
Germany |
Caucasian |
PCR |
population |
CRC |
632/605 |
0.11 |
rs1001179 |
Li |
2009 |
USA |
Caucasian |
Taqman |
population |
BC |
497/493 |
1.00 |
rs1001179 |
Quick-1 |
2008 |
USA |
Caucasian |
HM L/I MS |
population |
BC |
569/974 |
0.70 |
rs1001179 |
Quick-2 |
2008 |
USA |
Mixed |
HM L/I MS |
population |
BC |
47/108 |
0.22 |
rs1001179 |
Rajaraman-1 |
2008 |
USA |
Caucasian |
Taqman |
hospital |
Glioma |
330/438 |
0.57 |
rs1001179 |
Rajaraman-2 |
2008 |
USA |
Caucasian |
Taqman |
hospital |
Meningioma |
120/438 |
0.57 |
rs1001179 |
Rajaraman-3 |
2008 |
USA |
Caucasian |
Taqman |
hospital |
Acoustic neuroma |
63/438 |
0.57 |
rs1001179 |
Choi-1 |
2007 |
USA |
Caucasian |
HM L/I MS |
population |
PC |
463/1233 |
0.26 |
rs1001179 |
Choi-2 |
2007 |
USA |
African |
HM L/I MS |
population |
PC |
27/120 |
0.60 |
rs1001179 |
Cebrian |
2006 |
UK |
Caucasian |
Taqman |
population |
BC |
2171/2262 |
0.96 |
rs1001179 |
Ho |
2006 |
China |
Asian |
PCR-RFLP |
hospital |
LC |
230/240 |
0.44 |
rs1001179 |
Lightfoot |
2006 |
USA/UK |
Mixed |
Taqman |
population |
NHL |
909/1437 |
0.96 |
rs1001179 |
Ahn |
2005 |
USA |
Caucasian |
HM L/I MS |
population |
BC |
1008/1056 |
0.93 |
rs1001179 |
Lee-1 |
2002 |
South Korea |
Asian |
PCR-RFLP |
population |
GC |
80/108 |
0.47 |
rs794316 |
Lee-2 |
2002 |
South Korea |
Asian |
PCR-RFLP |
population |
HCC |
106/108 |
0.47 |
rs794316 |
PCR: polymerase chain reaction; RFLP: restriction fragment length polymorphism; HM L/I MS: high-throughput, matrixassisted, laser desorption/ionization time-of-flight mass spectrometry; HCC: hepatocellular carcinoma; CC: cervical cancer; BC: breast cancer; CML: chronic myeloid leukemia; NHL: non-Hodgkin lymphoma; BCC: basal cell carcinoma; SCC: squamous cell carcinoma; PC: Prostate cancer; CRC: colorectal cancer; OCC: Oral cavity cancer; GC: gastric cancer; LC: lung cancer; SNP: single-nucleotide polymorphisms; HWE: Hardy-Weinberg equilibrium.
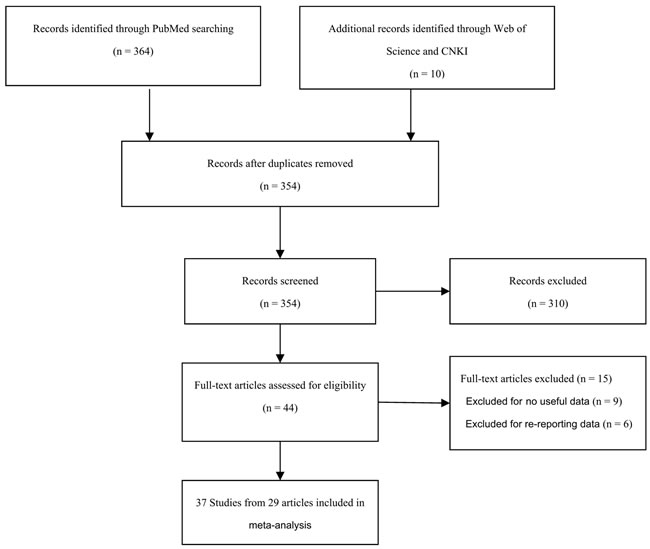
Figure 1: Flow diagram of included studies for the meta-analysis. CNKI = China National Knowledge Infrastructure.
Meta-analysis of CAT polymorphisms and cancer risk
As shown in Table 2, the minor allele frequencies varied widely among cancer patients across the eligible studies, ranging from 0.04 to 0.50 for rs1001179 polymorphism and 0.31 to 0.43 for rs794316 polymorphism. The average minor allele frequencies for these polymorphisms were 0.19 and 0.40, respectively.
Table 2: Genotype Distribution and Allele Frequency of CAT polymorphisms in Cases and Controls
First author |
Genotype (N) |
Allele frequency (N) |
MAF |
|||||||||||
Case |
Control |
Case |
Control |
|||||||||||
total |
AA |
AB |
BB |
total |
AA |
AB |
BB |
A |
B |
A |
B |
|||
rs1001179 |
||||||||||||||
Sousa 2016 |
106 |
68 |
35 |
3 |
139 |
103 |
32 |
4 |
171 |
41 |
238 |
40 |
0.19 |
|
Castaldo 2015 |
119 |
58 |
25 |
36 |
106 |
65 |
27 |
14 |
141 |
97 |
157 |
55 |
0.41 |
|
Geybels 2015 |
1529 |
887 |
539 |
103 |
25184 |
15794 |
8108 |
1282 |
2313 |
745 |
39696 |
10672 |
0.24 |
|
Liu 2015 |
266 |
239 |
27 |
0 |
248 |
223 |
24 |
1 |
505 |
27 |
470 |
26 |
0.05 |
|
Saadat 2015 |
407 |
261 |
129 |
17 |
395 |
240 |
132 |
23 |
651 |
163 |
612 |
178 |
0.20 |
|
Su-1 2015 |
301 |
273 |
27 |
1 |
186 |
168 |
18 |
0 |
573 |
29 |
354 |
18 |
0.05 |
|
Su-2 2015 |
99 |
92 |
7 |
0 |
294 |
264 |
29 |
1 |
191 |
7 |
557 |
31 |
0.04 |
|
Banescu 2014 |
168 |
105 |
49 |
14 |
321 |
168 |
132 |
21 |
259 |
77 |
468 |
174 |
0.23 |
|
Aynali 2013 |
25 |
13 |
10 |
2 |
23 |
12 |
11 |
0 |
36 |
14 |
35 |
11 |
0.28 |
|
Tefik 2013 |
155 |
58 |
64 |
33 |
195 |
107 |
68 |
20 |
180 |
130 |
282 |
108 |
0.42 |
|
Ding 2012 |
1417 |
1316 |
99 |
2 |
1008 |
940 |
67 |
1 |
2731 |
103 |
1947 |
69 |
0.04 |
|
Farawela 2012 |
100 |
26 |
49 |
25 |
100 |
28 |
53 |
19 |
101 |
99 |
109 |
91 |
0.50 |
|
Karunasinghe 2012 |
258 |
144 |
99 |
15 |
567 |
350 |
195 |
22 |
387 |
129 |
895 |
239 |
0.25 |
|
Tsai 2012 |
260 |
225 |
35 |
0 |
224 |
202 |
22 |
0 |
485 |
35 |
426 |
22 |
0.07 |
|
Nahon 2011 |
84 |
62 |
21 |
1 |
55 |
32 |
19 |
4 |
145 |
23 |
83 |
27 |
0.14 |
|
Ezzikouri 2010 |
96 |
76 |
14 |
6 |
222 |
173 |
45 |
4 |
166 |
26 |
391 |
53 |
0.14 |
|
He-1 2010 |
270 |
161 |
97 |
12 |
796 |
512 |
252 |
32 |
419 |
121 |
1276 |
316 |
0.22 |
|
He-2 2010 |
211 |
129 |
75 |
7 |
796 |
512 |
252 |
32 |
333 |
89 |
1276 |
316 |
0.21 |
|
He-3 2010 |
266 |
160 |
96 |
10 |
796 |
512 |
252 |
32 |
416 |
116 |
1276 |
316 |
0.22 |
|
Tang 2010 |
551 |
349 |
174 |
28 |
602 |
366 |
207 |
29 |
872 |
230 |
939 |
265 |
0.21 |
|
Funke 2009 |
632 |
374 |
235 |
23 |
605 |
348 |
231 |
26 |
983 |
281 |
927 |
283 |
0.22 |
|
Li 2009 |
497 |
295 |
176 |
26 |
493 |
303 |
167 |
23 |
766 |
228 |
773 |
213 |
0.23 |
|
Quick-1 2008 |
569 |
345 |
197 |
27 |
974 |
598 |
333 |
43 |
887 |
251 |
1529 |
419 |
0.22 |
|
Quick-2 2008 |
47 |
34 |
13 |
0 |
108 |
97 |
10 |
1 |
81 |
13 |
204 |
12 |
0.14 |
|
Rajaraman-1 2008 |
330 |
195 |
124 |
11 |
438 |
251 |
164 |
23 |
514 |
146 |
666 |
210 |
0.22 |
|
Rajaraman-2 2008 |
120 |
73 |
39 |
8 |
438 |
251 |
164 |
23 |
185 |
55 |
666 |
210 |
0.23 |
|
Rajaraman-3 2008 |
63 |
43 |
17 |
3 |
438 |
251 |
164 |
23 |
103 |
23 |
666 |
210 |
0.18 |
|
Choi-1 2007 |
463 |
281 |
157 |
25 |
1233 |
732 |
445 |
56 |
719 |
207 |
1909 |
557 |
0.22 |
|
Choi-2 2007 |
27 |
24 |
3 |
0 |
120 |
109 |
11 |
0 |
51 |
3 |
229 |
11 |
0.06 |
|
Cebrian 2006 |
2171 |
1351 |
707 |
113 |
2262 |
1362 |
787 |
113 |
3409 |
933 |
3511 |
1013 |
0.21 |
|
Ho 2006 |
230 |
209 |
19 |
2 |
240 |
217 |
23 |
0 |
437 |
23 |
457 |
23 |
0.05 |
|
Lightfoot 2006 |
909 |
554 |
298 |
57 |
1437 |
867 |
498 |
72 |
1406 |
412 |
2232 |
642 |
0.23 |
|
Ahn 2005 |
1008 |
614 |
349 |
45 |
1056 |
679 |
335 |
42 |
1577 |
439 |
1693 |
419 |
0.22 |
|
rs794316 |
||||||||||||||
Chang 2012 |
880 |
280 |
448 |
152 |
848 |
272 |
472 |
104 |
1008 |
752 |
1016 |
680 |
0.43 |
|
Wu 2010 |
122 |
57 |
55 |
10 |
122 |
62 |
54 |
6 |
169 |
75 |
178 |
66 |
0.31 |
|
Lee-1 2002 |
80 |
35 |
38 |
7 |
108 |
51 |
44 |
13 |
108 |
52 |
146 |
70 |
0.33 |
|
Lee-2 2002 |
106 |
51 |
42 |
13 |
108 |
51 |
44 |
13 |
144 |
68 |
146 |
70 |
0.32 |
|
A: the major allele; B: the minor allele; MAF: minor allele frequencies.
The main results of this meta-analysis are listed in Table 3. Thirty-three studies involving 13,754 cases and 42,099 controls were included for rs1001179. As shown in Table 3 and Figure 2, we observed an increased cancer risk associated with the rs1001179 polymorphism under the homozygote and recessive models (TT vs. CC: odds ratio [OR] = 1.19, 95% confidence interval [CI] = 1.04-1.37, P = 0.01; TT vs. CT+CC: OR = 1.19, 95% CI = 1.06- 1.34, P < 0.001.) In the cancer-specific analysis, the results showed significant correlations between the rs1001179 polymorphism and prostate cancer risk in different comparison models (T vs. C: OR = 1.21, 95% CI = 1.04-1.41, P = 0.02; TT vs. CC: OR = 1.57, 95% CI = 1.17-2.10, P = 0.00; TT+CT vs. CC: OR = 1.20, 95% CI = 1.01-1.42, P = 0.04; TT vs. CT+CC: OR = 1.40, 95% CI = 1.18-1.67, P < 0.001). However, no meaningful correlations were observed in analyses stratified by ethnicity or the source of controls.
Table 3: Meta-analysis of the association between CAT polymorphisms and cancer risk
Comparisons |
OR |
95%CI |
P value |
Heterogeneity |
Effects model |
|
I2 |
P value |
|||||
B vs A |
||||||
rs1001179 |
1.06 |
0.99-1.13 |
0.11 |
54% |
0.00 |
R |
HWE |
1.04 |
0.97-1.11 |
0.28 |
39% |
0.02 |
R |
Caucasian |
1.05 |
0.96-1.14 |
0.27 |
66% |
0.00 |
R |
Asian |
1.05 |
0.86-1.29 |
0.64 |
0% |
0.80 |
F |
Mixed |
1.10 |
0.92-1.32 |
0.29 |
54% |
0.07 |
R |
PC |
1.21 |
1.04-1.41 |
0.02 |
61% |
0.02 |
R |
HCC |
0.85 |
0.62-1.17 |
0.32 |
25% |
0.25 |
F |
BC |
1.04 |
0.93-1.17 |
0.50 |
52% |
0.05 |
R |
rs794316 |
1.10 |
0.98-1.24 |
0.11 |
0% |
0.88 |
F |
HWE |
1.06 |
0.84- 1.35 |
0.61 |
0% |
0.76 |
F |
BB vs AA |
||||||
rs1001179 |
1.20 |
1.08-1.34 |
0.00 |
20% |
0.16 |
F |
HWE |
1.12 |
1.00-1.27 |
0.05 |
0% |
0.70 |
F |
Caucasian |
1.16 |
0.97-1.38 |
0.10 |
41% |
0.03 |
R |
Asian |
1.37 |
0.37-5.14 |
0.64 |
0% |
0.80 |
F |
Mixed |
1.29 |
0.98-1.68 |
0.07 |
0% |
0.47 |
F |
PC |
1.57 |
1.17- 2.10 |
0.00 |
33% |
0.20 |
F |
HCC |
0.88 |
0.20- 3.82 |
0.87 |
45% |
0.12 |
F |
BC |
1.03 |
0.85- 1.25 |
0.75 |
0% |
0.82 |
F |
rs794316 |
1.34 |
1.03-1.74 |
0.00 |
0% |
0.58 |
F |
HWE |
1.09 |
0.62-1.91 |
0.76 |
0% |
0.52 |
F |
AB vs AA |
||||||
rs1001179 |
1.02 |
0.94- 1.09 |
0.68 |
39% |
0.01 |
R |
HWE |
1.01 |
0.93- 1.09 |
0.82 |
35% |
0.03 |
R |
Caucasian |
1.01 |
0.93- 1.11 |
0.76 |
47% |
0.01 |
R |
Asian |
1.03 |
0.84- 1.28 |
0.77 |
0% |
0.77 |
F |
Mixed |
1.05 |
0.80- 1.38 |
0.72 |
67% |
0.02 |
R |
PC |
1.14 |
0.99- 1.31 |
0.06 |
33% |
0.19 |
F |
HCC |
0.81 |
0.60- 1.09 |
0.17 |
0% |
0.73 |
F |
BC |
1.07 |
0.91- 1.25 |
0.43 |
60% |
0.02 |
R |
rs794316 |
0.97 |
0.81- 1.16 |
0.74 |
0% |
0.76 |
F |
HWE |
1.10 |
0.79- 1.52 |
0.59 |
0% |
0.81 |
F |
BB+AB vs AA |
||||||
rs1001179 |
1.04 |
0.96- 1.12 |
0.33 |
48% |
0.00 |
R |
HWE |
1.02 |
0.95- 1.11 |
0.54 |
39% |
0.02 |
R |
Caucasian |
1.03 |
0.94- 1.14 |
0.50 |
59% |
0.00 |
R |
Asian |
1.04 |
0.84- 1.29 |
0.70 |
0 % |
0.79 |
F |
Mixed |
1.09 |
0.86- 1.38 |
0.49 |
62% |
0.03 |
R |
PC |
1.20 |
1.01- 1.42 |
0.04 |
55% |
0.05 |
R |
HCC |
0.83 |
0.62- 1.11 |
0.21 |
0% |
0.56 |
F |
BC |
1.06 |
0.91- 1.23 |
0.44 |
59% |
0.02 |
R |
rs794316 |
1.04 |
0.87-1.23 |
0.68 |
0% |
0.92 |
F |
HWE |
1.10 |
0.80- 1.49 |
0.57 |
0% |
0.85 |
F |
BB vs AB+AA |
||||||
rs1001179 |
1.19 |
1.06- 1.34 |
0.00 |
10% |
0.31 |
F |
HWE |
1.12 |
1.00- 1.27 |
0.05 |
0% |
0.70 |
F |
Caucasian |
1.16 |
0.99- 1.35 |
0.06 |
29% |
0.11 |
F |
Asian |
1.38 |
0.37- 5.18 |
0.63 |
0 % |
0.80 |
F |
Mixed |
1.30 |
0.99- 1.70 |
0.05 |
0% |
0.50 |
F |
PC |
1.40 |
1.18- 1.67 |
0.00 |
0% |
0.48 |
F |
HCC |
0.95 |
0.23- 3.99 |
0.94 |
43% |
0.14 |
F |
BC |
1.04 |
0.86- 1.25 |
0.70 |
0% |
0.89 |
F |
rs794316 |
1.39 |
1.09-1.77 |
0.01 |
0% |
0.41 |
F |
HWE |
1.05 |
0.61- 1.79 |
0.87 |
0% |
0.46 |
F |
A: the major allele; B: the minor allele; F: fixed effects mode; R: random effects model; HCC: hepatocellular carcinoma; BC: breast cancer; PC: Prostate cancer; HWE: meta-analysis excluding the studies departing from HWE.
The association of the rs794316 polymorphism with cancer risk was investigated in 4 studies involving 1,188 cases and 1,186 controls. This polymorphism was associated with an increased cancer risk in the overall population under the two models (TT vs. AA: OR = 1.34, 95% CI = 1.03-1.74, P < 0.001; TT vs. AT+AA: OR = 1.39, 95% CI = 1.09-1.77, P = 0.01; Figure 3).
Table 4: Meta-regression analyses of potential source of heterogeneity
Heterogeneity factors |
Coefficient |
SE |
Z |
P |
95% CI |
|
LL |
UL |
|||||
Sample size |
0.047 |
0.042 |
1.12 |
0.273 |
-0.039 |
0.134 |
Publication year |
0.026 |
0.014 |
1.77 |
0.088 |
-0.004 |
0.056 |
Ethnicity |
0.146 |
0.159 |
0.92 |
0.368 |
-0.182 |
0.473 |
Genotype method |
-0.023 |
0.054 |
-0.42 |
0.676 |
-0.135 |
0.089 |
Source of control |
0.259 |
0.244 |
1.06 |
0.300 |
-0.244 |
0.761 |
SE: standard error; 95% CI: 95% confidence interval; LL: lower limit; UL: upper limit.
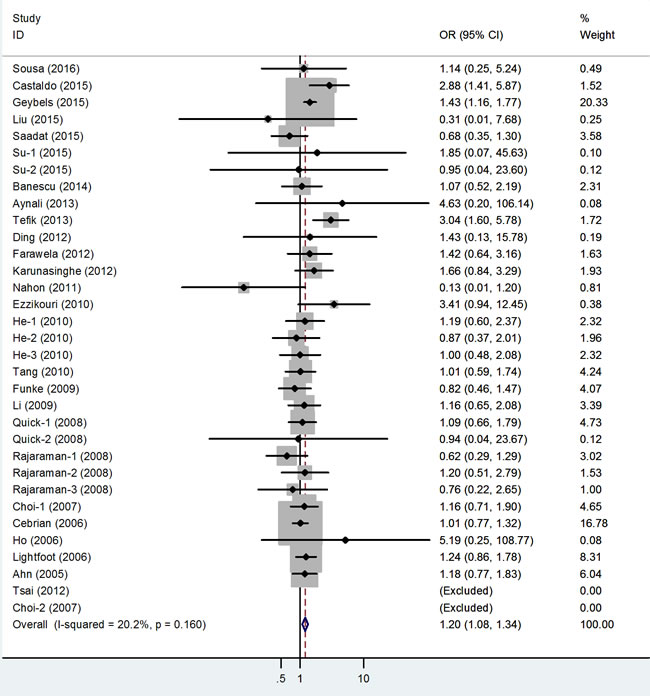
Figure 2: Forest plot of cancer risk related to rs1001179 polymorphism under TT versus CC genetic model. T = the minor allele in rs1001179 polymorphism, C = the major allele in rs1001179 polymorphism, CI = confidence interval, OR = odds ratio.
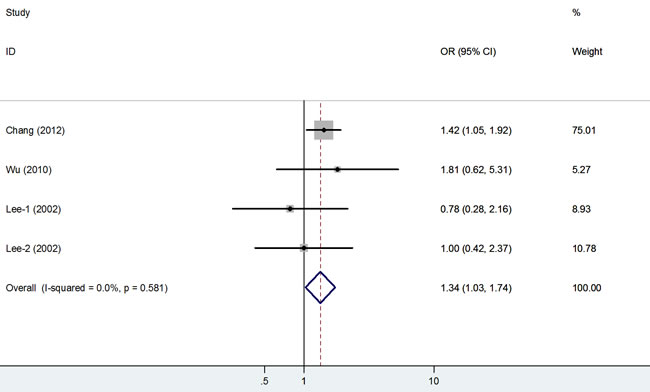
Figure 3: Forest plot of cancer risk related to rs794316 polymorphism under TT versus AA genetic model. T = the minor allele in rs794316 polymorphism, A = the major allele in rs794316 polymorphism, CI = confidence interval, OR = odds ratio.
Heterogeneity analysis and publication bias
In this meta-analysis, Q-statistic test was used to detect between-study heterogeneity that arose from methodological or clinical dissimilarity across studies. When the P value of the heterogeneity test was more than 0.1 (P ≥0.1), a fixed-effects model was performed. Otherwise, the random-effects model was used. To explore the other factors which may influence our results, we performed a meta-regression analysis. As shown in the Table 4, sample size was not the factor which could be involved in cancer susceptibility (P = 0.134). Furthermore, the results revealed that the publication year, ethnicity, genotype method and the source of controls were all not the factors that could impact on our results (P = 0.088, 0.368, 0.676 and 0.300, respectively). We also performed a funnel plot and Egger’s test to assess publication bias. As shown in Figure 4, the funnel plots failed to reveal any obvious asymmetries of the 2 polymorphisms in the overall population, and the results of Egger’s test revealed no publication bias (P > 0.05). Therefore, the results revealed that publication bias was not significant in this meta-analysis.
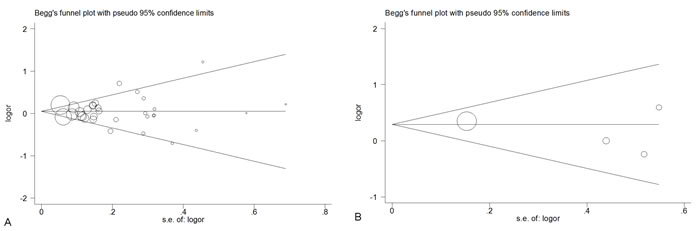
Figure 4: Begg’s funnel plot for publication bias test of CAT polymorphisms: rs1001179 (A), rs794316 (B), under the homozygous model.
Sensitivity analysis
A single study was deleted one at a time from the meta-analysis to reflect the influence of each individual dataset on the pooled ORs. The analysis results demonstrated that no single study greatly influenced the overall cancer risk estimations with respect to the CAT polymorphisms (Figure 5), which indicates that our results are statistically robust.
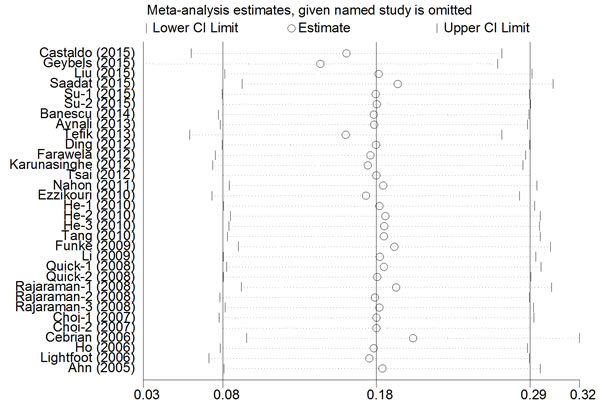
Figure 5: Sensitivity analysis of the association between CAT rs1001179 polymorphism and cancer risk under the homozygous model.
DISCUSSION
Previous case-control studies have investigated the association between the rs1001179 polymorphism and cancer risk. No significant associations were observed between rs1001179 polymorphism and hepatocellular carcinoma or breast cancer risk in studies by Liu et al. [17] and Saadat et al. [23], respectively. However, Geybels et al. [10] and Castaldo et al.[7] reported significant associations between rs1001179 polymorphism and increased prostate and cervical cancer risks, respectively, and Nahon et al. [18] and Su et al. [16] demonstrated that rs1001179 polymorphism was a protective factor with respect to hepatocellular carcinoma susceptibility.
We combined all the case-control studies concerning rs1001179 polymorphism and cancer risk to perform this meta-analysis, and found that individuals harboring the rs1001179 TT and rs794316 TT genotypes had a higher cancer risk than did those with other genotypes. This is likely attributable to the relationship between rs1001179 polymorphism and lower CAT activity, which further hinders the response to oxidative stress and might lead to tumorigenesis [37, 38]. The stratified analysis results indicated that the CAT rs1001179 polymorphism was only associated with prostate cancer, but not other cancers. These results were in accordance with others’ findings. Geybels et al. observed that the CAT rs1001179 polymorphism was associated with the risk of stage III/IV prostate cancer, which might be explained by the effect of CAT expression on oxidative stress and the link between increased oxidative stress and prostate cancer.
A previous meta-analysis including 9,777 cancer patients and 12,223 controls showed significant association between rs1001179 polymorphism and cancer risk in the recessive model [39]. Compared with that meta-analysis, our meta-analysis included 11 new independent studies of hepatocellular carcinoma [16, 17, 22, 34], chronic myeloid leukemia [24], laryngeal cancer [25], colorectal cancer [20], and oral cavity cancer [9]. Different from the previous result, we observed an association between the rs1001179 polymorphism and an increased cancer risk in the homozygote model. And it is worth mentioning that we found an association of the rs794316 polymorphism with cancer risk in recessive model and homozygote model, which wasn’t detected by anyone before.
Because the control group genotype distributions departed from HWE in 3 studies, we performed a subgroup analysis that excluded those studies. Regarding the rs1001179 polymorphism, the result was remained consistent with the overall analysis; in other words, an association between an increased cancer risk and rs1001179 polymorphism was observed in recessive model and homozygote model. Nevertheless, we observed no significant association between the rs794316 polymorphism and cancer risk with any of the genetic models, although this might be a consequence of the small number of studies.
Several limitations of this meta-analysis should be acknowledged. First, only Asian population was involved in the analysis of rs794316, and most studies of rs1001179 are for Caucasian and Asian population. Accordingly, it would be better to include more studies with various ethnic groups to identify their definite roles in different populations. Second, some detailed information (e.g., sex, age, lifestyle, and environmental factors) was not considered. Third, the overall outcomes were based on individual unadjusted ORs, whereas a more precise evaluation should be adjusted using other potentially suspect factors. Fourth, the genotyping methods used in the eligible studies differed widely, which might have influenced the results. Moreover, although we have summarized all data on rs794316 polymorphism and cancer risk, the number of relative studies still needs further expansion.
In summary, this meta-analysis has shown associations of the CAT rs1001179 and rs794316 polymorphisms with an increased cancer risk. Additional larger-scale multicenter studies with larger sample sizes are needed to further validate the possible roles of these polymorphisms in cancers.
MATERIALS AND METHODS
Search strategy
The PubMed, Web of Science, and Chinese National Knowledge Infrastructure (CNKI) databases were searched for publications from 2002 to January 2016 using the terms “cancer” or “tumor”, “CAT” or “Catalase”, “polymorphism” or “SNP”, “rs1001179” or “C-262T”, and “rs794316” or “A-15 T”. We also used the “Related Articles” option in PubMed to identify additional studies of the same topic. The reference lists of the retrieved articles were also screened. All included studies were selected using the following criteria: (a) studies must have featured a case-control design and focused on CAT polymorphism and cancer risk; (b) published data must have been sufficient to allow OR estimation with a 95% CI; and (c) for multiple publications reporting the same data or overlapping data, the largest or most recent publication was selected.
Data extraction
Initially, 2 investigators (Liu K and Liu XH) independently checked all potentially relevant studies, and disagreements were resolved through discussions with a third researcher. We extracted the following items from each article: first author, year of publication, country of origin, ethnicity, cancer types, control source, genotyping method, total numbers of cases and controls, and numbers of different genotypes among cases and controls. All data were extracted from published articles. All cancers were confirmed by histology or pathology. The non-cancer controls had no evidence of any malignant disease at the time of the study.
Statistical analysis
We used ORs and 95% CIs to evaluate the cancer risks associated with CAT polymorphisms. Heterogeneity between studies was evaluated using the I2 test, with a higher I2 value indicating a higher level of heterogeneity (I2 = 75-100%: extreme heterogeneity; I2 = 50-75%: great heterogeneity; I2 = 25-50%: moderate heterogeneity; I2 < 25%: no heterogeneity). During the heterogeneity evaluation, the fixed-effects model would be used if the P value was ≥0.10; otherwise, the random-effects model was used. Subgroup analyses were performed according to cancer type, control source, and ethnicity. A sensitivity analysis was performed to assess the stability of the final results by sequentially omitting each individual study at a time. Egger’s test and Begg’s test were adopted to assess publication bias. The meta-analysis assessed the following genetic models: dominant model (AB+BB vs. AA), recessive model (BB vs. AA + AB), homozygote comparison (BB vs. AA), heterozygote comparison (AB vs. AA), and allele comparison (B vs. A). All analyses were performed using the Stata software, version 12.0 (Stata Corp., College Station, TX, USA). A P value < 0.5 was considered statistically significant, and all P values were 2-sided.
CONFLICTS OF INTEREST
The authors have no conflicts of interest to declare.
GRANT SUPPORT
This study was supported by the National Natural Science Foundation, China (No. 81471670; 81274136); the China Postdoctoral Science Foundation (No. 2015T81037); the Fundamental Research Funds for the Central Universities, China (No. 2014qngz-04); and the specialized Research Fund of the Second Affiliated Hospital of Xi’an Jiaotong University, China [RC (GG) 201203].
REFERENCES
1. DeSantis CE, Lin CC, Mariotto AB, Siegel RL, Stein KD, Kramer JL, Alteri R, Robbins AS and Jemal A. Cancer treatment and survivorship statistics, 2014. CA Cancer J Clin. 2014; 64:252-271.
2. Pharoah PD, Dunning AM, Ponder BA and Easton DF. Association studies for finding cancer-susceptibility genetic variants. Nature reviews Cancer. 2004; 4:850-860.
3. Nishikawa M. Reactive oxygen species in tumor metastasis. Cancer letters. 2008; 266:53-59.
4. Costa A, Scholer-Dahirel A and Mechta-Grigoriou F. The role of reactive oxygen species and metabolism on cancer cells and their microenvironment. Seminars in cancer biology. 2014; 25:23-32.
5. Sarsour EH, Kumar MG, Chaudhuri L, Kalen AL and Goswami PC. Redox control of the cell cycle in health and disease. Antioxidants & redox signaling. 2009; 11:2985-3011.
6. Goyal MM and Basak A. Human catalase: looking for complete identity. Protein & cell. 2010; 1:888-897.
7. Castaldo SA, da Silva AP, Matos A, Inacio A, Bicho M, Medeiros R, Alho I and Bicho MC. The role of CYBA (p22phox) and catalase genetic polymorphisms and their possible epistatic interaction in cervical cancer. Tumour biology. 2015; 36:909-914.
8. Khodayari S, Salehi Z, Fakhrieh Asl S, Aminian K, Mirzaei Gisomi N and Torabi Dalivandan S. Catalase gene C-262T polymorphism: importance in ulcerative colitis. Journal of gastroenterology and hepatology. 2013; 28:819-822.
9. Wu SH, Lee KW, Chen CH, Lin CC, Tseng YM, Ma H, Tsai SM and Tsai LY. Epistasis of oxidative stress-related enzyme genes on modulating the risks in oral cavity cancer. Clinica chimica acta. 2010; 411:1705-1710.
10. Geybels MS, van den Brandt PA, van Schooten FJ and Verhage BA. Oxidative stress-related genetic variants, pro- and antioxidant intake and status, and advanced prostate cancer risk. Cancer epidemiology, biomarkers & prevention. 2015; 24:178-186.
11. Tefik T, Kucukgergin C, Sanli O, Oktar T, Seckin S and Ozsoy C. Manganese superoxide dismutase Ile58Thr, catalase C-262T and myeloperoxidase G-463A gene polymorphisms in patients with prostate cancer: relation to advanced and metastatic disease. BJU international. 2013; 112:E406-414.
12. Karunasinghe N, Han DY, Goudie M, Zhu S, Bishop K, Wang A, Duan H, Lange K, Ko S, Medhora R, Kan ST, Masters J and Ferguson LR. Prostate disease risk factors among a New Zealand cohort. Journal of nutrigenetics and nutrigenomics. 2012; 5:339-351.
13. Ding G, Liu F, Shen B, Feng C, Xu J and Ding Q. The association between polymorphisms in prooxidant or antioxidant enzymes (myeloperoxidase, SOD2, and CAT) and genes and prostate cancer risk in the Chinese population of Han nationality. Clinical genitourinary cancer. 2012; 10:251-255.
14. Choi JY, Neuhouser ML, Barnett M, Hudson M, Kristal AR, Thornquist M, King IB, Goodman GE and Ambrosone CB. Polymorphisms in oxidative stress-related genes are not associated with prostate cancer risk in heavy smokers. Cancer epidemiology, biomarkers & prevention. 2007; 16:1115-1120.
15. Tsai SM, Wu SH, Hou MF, Chen YL, Ma H and Tsai LY. Oxidative stress-related enzyme gene polymorphisms and susceptibility to breast cancer in non-smoking, non-alcohol-consuming Taiwanese women: a case-control study. Annals of clinical biochemistry. 2012; 49:152-158.
16. Su S, He K, Li J, Wu J, Zhang M, Feng C, Xia X and Li B. Genetic polymorphisms in antioxidant enzyme genes and susceptibility to hepatocellular carcinoma in Chinese population: a case-control study. Tumour biology. 2015; 36:4627-4632.
17. Liu Y, Xie L, Zhao J, Huang X, Song L, Luo J, Ma L, Li S and Qin X. Association between catalase gene polymorphisms and risk of chronic hepatitis B, hepatitis B virus-related liver cirrhosis and hepatocellular carcinoma in Guangxi population: a case-control study. Medicine. 2015; 94:e702.
18. Nahon P, Sutton A, Rufat P, Charnaux N, Mansouri A, Moreau R, Ganne-Carrie N, Grando-Lemaire V, N’Kontchou G, Trinchet JC, Pessayre D and Beaugrand M. A variant in myeloperoxidase promoter hastens the emergence of hepatocellular carcinoma in patients with HCV-related cirrhosis. Journal of hepatology. 2012; 56:426-432.
19. Ezzikouri S, El Feydi AE, Afifi R, Benazzouz M, Hassar M, Pineau P and Benjelloun S. Polymorphisms in antioxidant defence genes and susceptibility to hepatocellular carcinoma in a Moroccan population. Free radical research. 2010; 44:208-216.
20. Chang D, Hu ZL, Zhang L, Zhao YS, Meng QH, Guan QB, Zhou J and Pan HZ. Association of catalase genotype with oxidative stress in the predication of colorectal cancer: modification by epidemiological factors. Biomedical and environmental sciences. 2012; 25:156-162.
21. Ho JC, Mak JC, Ho SP, Ip MS, Tsang KW, Lam WK and Chan-Yeung M. Manganese superoxide dismutase and catalase genetic polymorphisms, activity levels, and lung cancer risk in Chinese in Hong Kong. Journal of thoracic oncology. 2006; 1:648-653.
22. Lee JH, Park RY, Lee CS, Jeoung EJ, Nam SY, Lee JG, Han KY, Lee HJ, Chung JH, Ahn YG, Yim SV, Cho JY and Park YH. No Association between Catalase Gene Polymorphism and Gastric Carcinoma and Hepatocellular Carcinoma in Koreans. Cancer research and treatment. 2002; 34:432-435.
23. Saadat M and Saadat S. Genetic Polymorphism of CAT C-262 T and Susceptibility to Breast Cancer, a Case-Control Study and Meta-Analysis of the Literatures. Pathology oncology research. 2015; 21:433-437.
24. Banescu C, Trifa AP, Voidazan S, Moldovan VG, Macarie I, Benedek Lazar E, Dima D and Duicu C. CAT, GPX1, MnSOD, GSTM1, GSTT1, and GSTP1 genetic polymorphisms in chronic myeloid leukemia: a case-control study. Oxid Med Cell Longev. 2014; 2014:875861.
25. Aynali G, Dogan M, Sutcu R, Yuksel O, Yariktas M, Unal F, Yasan H, Ceyhan B and Tuz M. Polymorphic variants of MnSOD Val16Ala, CAT-262 C < T and GPx1 Pro198Leu genotypes and the risk of laryngeal cancer in a smoking population. The Journal of laryngology and otology. 2013; 127:997-1000.
26. Farawela H, Khorshied M, Shaheen I, Gouda H, Nasef A, Abulata N, Mahmoud HA, Zawam HM and Mousa SM. The association between hepatitis C virus infection, genetic polymorphisms of oxidative stress genes and B-cell non-Hodgkin’s lymphoma risk in Egypt. Infection, genetics and evolution. 2012; 12:1189-1194.
27. He C, Qureshi AA and Han J. Polymorphisms in genes involved in oxidative stress and their interactions with lifestyle factors on skin cancer risk. Journal of dermatological science. 2010; 60:54-56.
28. Li Y, Ambrosone CB, McCullough MJ, Ahn J, Stevens VL, Thun MJ and Hong CC. Oxidative stress-related genotypes, fruit and vegetable consumption and breast cancer risk. Carcinogenesis. 2009; 30:777-784.
29. Funke S, Hoffmeister M, Brenner H and Chang-Claude J. Effect modification by smoking on the association between genetic polymorphisms in oxidative stress genes and colorectal cancer risk. Cancer epidemiology, biomarkers & prevention. 2009; 18:2336-2338.
30. Rajaraman P, Hutchinson A, Rothman N, Black PM, Fine HA, Loeffler JS, Selker RG, Shapiro WR, Linet MS and Inskip PD. Oxidative response gene polymorphisms and risk of adult brain tumors. Neuro-oncology. 2008; 10:709-715.
31. Quick SK, Shields PG, Nie J, Platek ME, McCann SE, Hutson AD, Trevisan M, Vito D, Modali R, Lehman TA, Seddon M, Edge SB, Marian C, Muti P and Freudenheim JL. Effect modification by catalase genotype suggests a role for oxidative stress in the association of hormone replacement therapy with postmenopausal breast cancer risk. Cancer epidemiology, biomarkers & prevention. 2008; 17:1082-1087.
32. Cebrian A, Pharoah PD, Ahmed S, Smith PL, Luccarini C, Luben R, Redman K, Munday H, Easton DF, Dunning AM and Ponder BA. Tagging single-nucleotide polymorphisms in antioxidant defense enzymes and susceptibility to breast cancer. Cancer research. 2006; 66:1225-1233.
33. Ahn J, Gammon MD, Santella RM, Gaudet MM, Britton JA, Teitelbaum SL, Terry MB, Nowell S, Davis W, Garza C, Neugut AI and Ambrosone CB. Associations between breast cancer risk and the catalase genotype, fruit and vegetable consumption, and supplement use. American journal of epidemiology. 2005; 162:943-952.
34. Sousa VC, Carmo RF, Vasconcelos LR, Aroucha DC, Pereira LM, Moura P and Cavalcanti MS. Association of Catalase and Glutathione Peroxidase 1 Polymorphisms with Chronic Hepatitis C Outcome. Annals of human genetics. 2016; 80:145-153.
35. Tang H, Dong X, Day RS, Hassan MM and Li D. Antioxidant genes, diabetes and dietary antioxidants in association with risk of pancreatic cancer. Carcinogenesis. 2010; 31:607-613.
36. Lightfoot TJ, Skibola CF, Smith AG, Forrest MS, Adamson PJ, Morgan GJ, Bracci PM, Roman E, Smith MT and Holly EA. Polymorphisms in the oxidative stress genes, superoxide dismutase, glutathione peroxidase and catalase and risk of non-Hodgkin’s lymphoma. Haematologica. 2006; 91:1222-1227.
37. Christiansen L, Petersen HC, Bathum L, Frederiksen H, McGue M and Christensen K. The catalase -262C/T promoter polymorphism and aging phenotypes. J Gerontol A Biol Sci Med Sci. 2004; 59:B886-889.
38. Nadif R, Mintz M, Jedlicka A, Bertrand JP, Kleeberger SR and Kauffmann F. Association of CAT polymorphisms with catalase activity and exposure to environmental oxidative stimuli. Free radical research. 2005; 39:1345-1350.
39. Shen Y, Li D, Tian P, Shen K, Zhu J, Feng M, Wan C, Yang T, Chen L and Wen F. The catalase C-262T gene polymorphism and cancer risk: a systematic review and meta-analysis. Medicine. 2015; 94:e679.