
INTRODUCTION
Thyroid cancer (TC) is the most common endocrine malignancy, being the fifth most frequent cancer in women [1]. TC incidence rates have been increasing in the last three decades all over the world [2]. The reason for the raised incidence of TCs remains controversial. While some studies point to improved diagnostic approaches [3, 4], others indicate that it may be correlated to environmental and lifestyle changes [5-8].
The majority of TCs are derived from follicular cells, being differentiated thyroid cancer (DTC), comprising papillary thyroid cancer (PTC) and follicular thyroid cancer (FTC), the most common subtypes and accounting for 90–95% of all cases [9]. Within PTCs, which encompass more than 80% of TCs, classical type of PTC (cPTC) corresponds to around 50% of the cases, whereas follicular variant PTC (fvPTC) corresponds to about 40% of all PTCs [10].
Despite the overall good prognosis of DTCs, a subset of DTC patients follows a more aggressive disease course, developing recurrent or metastatic disease [11]. The early identification of this cases is one of the most challenging tasks in thyroid oncology.
Osteopontin (OPN) is a secreted extracellular matrix (ECM) protein encoded by the highly conserved SPP1 gene [12]. Previous studies have found that total OPN (tOPN) is overexpressed in TCs [13-17], similarly as reported in other tumor models, being correlated with poor survival [17]. tOPN effects in tumor progression has been associated with its ability to induce ECM invasion and migration [18]. Proteolysis and remodeling of the ECM represent early events modulating cancer cell invasion through the surrounding stroma [19, 20], and OPN has been implicated in such processes [21, 22].
OPN primary transcript is subjected to alternative splicing, generating three OPN splicing variants (OPN-SV): the full-length OPNa and the shorter variants OPNb and OPNc (lacking exons 5 and 4, respectively) [23]. Recent studies have shown that OPN-SV are differentially expressed and may exhibit functional differences in normal tissue and their respective tumors [24]. For instance [25], in hepatocellular carcinoma (HCC), tumor tissues predominantly expressed OPNa and OPNb, while normal liver tissues mainly expressed OPNc. In this tumor model, OPNa and OPNb induced Hep3B cell migration, while OPNc had no significant effect. However, in SK-Hep1 cells OPNc suppressed the migratory activity, while OPNa induced no significant changes [25]. Our group previously demonstrated that OPNc, but not OPNa and OPNb, is specifically expressed in ovarian cancer samples. Furthermore, OPNc overexpression in OvCar-3 cells activates proliferation, migration, invasion and colony formation, as well as tumor formation in nude mice [26].
Based on these data, we then hypothesized that specific OPN-SV could be putative biomarkers in TCs. We here investigated the expression patterns and putative biological roles of tOPN and OPN-SV in DTC tumor progression.
RESULTS
tOPN protein is overexpressed in cPTC and is associated with vascular invasion and extrathyroid extension
In thyroid tumor tissues (Figure 1A-1H), tOPN staining was mainly localized in the cytoplasm of TC cells, although a few samples also showed focal membrane staining (Figure 1G and 1H). Total OPN protein expression was observed in 27 of 44 cPTCs (61.4%), in 6 of 16 fvPTCs (37.6%) and in 6 of 10 FTCs (60%). In the cPTC, staining intensity was faint in 31.8%, moderate in 20.5% and strong in 9.1% of the cases (Table 1). Staining score of the positive cases was moderate to high in the majority of the cases (Table 1). Representative sections of tOPN staining scores from 0 to 7 are also depicted in Figure 1. Tissues adjacent to thyroid tumor areas were virtually negative for tOPN staining (Figure 1I and 1J).
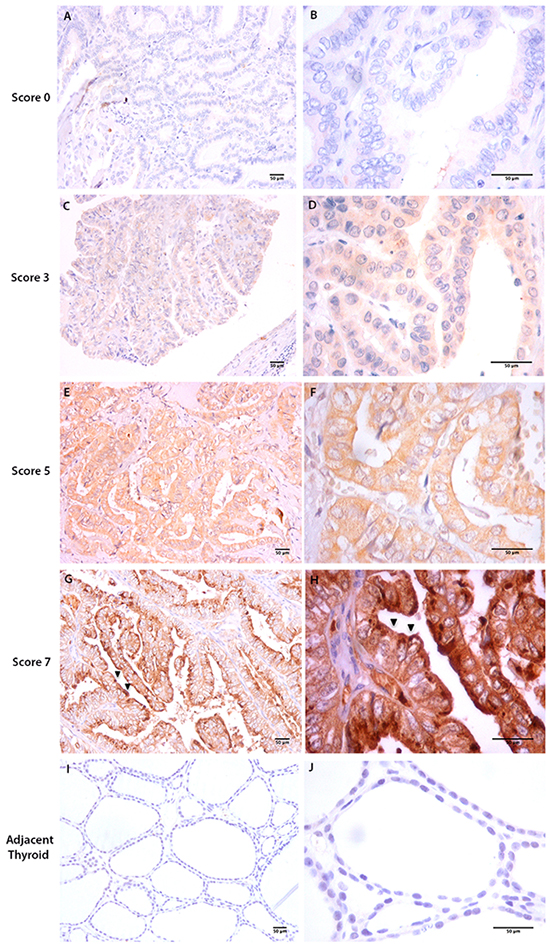
Figure 1: Total OPN (tOPN) IHC staining in cPTC samples. Representative sections of cPTC samples showing tOPN staining in thyroid tumor cells (20x and 60x magnification, respectively at the left and right images are shown A-H. Scale bar: 50 µm). A and B represent cPTC samples with staining score 0; C and D, staining score 3; E and F, staining score 5; G and H staining score 7. Black arrows points to membrane tOPN staining (G and H); I and J: represent adjacent thyroid tissues negative for tOPN staining.
Table 1: Staining intensity, proportion of positive stained cells and staining score of tOPN IHC in cPTC samples
Staining intensity |
n |
% |
Proportion of positive stained cells % |
n |
% |
OPN Staining Score* |
% |
|---|---|---|---|---|---|---|---|
Absent |
17 |
38.6 |
<5% |
22 |
50 |
0 |
38.6 |
1 |
2.3 |
||||||
Faint |
14 |
31.8 |
5-25% |
6 |
13.6 |
2 |
15.9 |
3 |
11.4 |
||||||
Moderate |
9 |
20.5 |
25-50% |
4 |
9.1 |
4 |
4.5 |
5 |
13.6 |
||||||
Strong |
4 |
9.1 |
50-75% |
1 |
2.3 |
6 |
11.4 |
7 |
2.3 |
||||||
75-100% |
11 |
25 |
|||||
Total |
44 |
100 |
44 |
100 |
44 |
100 |
* Staining intensity plus % of positive stained cells
Of note, cPTC samples displaying vascular invasion exhibited higher tOPN staining scores than tumors without vascular invasion (Table 2). Tumors displaying extrathyroid extension had higher average tOPN staining score than tumors without this feature, although not attaining statistical significance (Table 2). cPTC samples containing hyaline stroma exhibited higher tOPN staining score than tumors without stroma (p = 0.01) (Table 2). In cPTC samples, no significant associations were observed between tOPN staining scores and patient’ gender or age, tumor size, capsular invasion, lymph node metastasis, thyroiditis, RET/PTC translocation, BRAFV600E, RAS and TERT mutations. Moreover, no significant associations were observed between tOPN staining score and any clinicopathological or molecular features in FTC (data not show). With regard to tOPN protein expression in well and poorly circumscribed fvPTC cases, there is a difference in the tOPN staining score media, although not attaining statistical significance (Supplementary Table S1).
Table 2: tOPN protein expression evaluated by IHC and correlation with clinicopathological associations in formalin-fixed paraffin-embedded (FFPE)
Tissue |
Clinicopathological features (N) |
tOPN tissue expression (Average ± SD) |
p-value |
|---|---|---|---|
cPTC |
Stroma |
||
Absent (n=17) |
1.53 ± 2.18 |
p=0.01 |
|
Hyaline (n=19) |
3.37 ± 2.16 |
||
Vascular Invasion |
|||
Absent (n=16) |
1.44 ± 2.15 |
p=0.05 |
|
Present (n=23) |
2.91 ± 2.41 |
||
Extrathyroid Extension |
|||
Absent (n=21) |
0.67 ± 1.98 |
p=0.07 |
|
Present (n=18) |
3.00 ± 2.56 |
||
OPNa is the predominant OPN-SV expressed in cPTC tissues and thyroid cell lines and is associated to invasiveness
Since we had observed a higher tOPN protein expression in cPTC and a significant association with invasive features, we then evaluated the mRNA expression patterns of each OPN-SV (OPNa, OPNb or OPNc) and of tOPN, in an attempt to evaluate their relative contributions to cell invasiveness. The comparison of tOPN and each OPN-SV expression levels among distinct thyroid tissue samples showed that tOPN is overexpressed in relation to each OPN-SV (Supplementary Figure S1). It is worth to mention, that tOPN expression corresponds to the sum of all OPN-SV. Among the three OPN-SV, OPNa has the highest expression levels in all thyroid tissues (Figure 2A and Supplementary Figure S1).
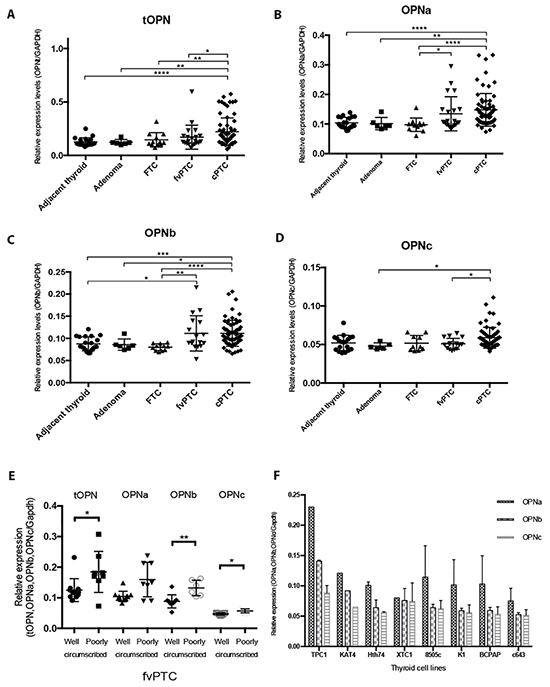
Figure 2: Transcript expression levels of tOPN, OPNa, OPNb and OPNc in thyroid tissue samples and in thyroid cell lines. A. tOPN, B. OPNa, C. OPNb and D. OPNc mRNA expression levels has been measured by real time PCR in the distinct thyroid tissue samples (symbols: adjacent thyroid -•; follicular adenomas ■; FTC ▲; fvPTC ▼; cPTC -♦); E. mRNA expression levels have been measured by real time PCR in well and poorly circumscribed fvPTC tissue samples (symbols: tOPN expression in well circumscribed fvPTC -•; tOPN expression in poorly circumscribed fvPTC ■; OPNa expression in well circumscribed fvPTC ▲; OPNa expression in poorly circumscribed fvPTC ▼; OPNb expression in well circumscribed fvPTC -♦; OPNb expression in poorly circumscribed fvPTC -○; OPNc expression in well circumscribed fvPTC - •; OPNc expression in poorly circumscribed fvPTC -Δ) F. OPN-SV transcript expression levels have been also evaluated in distinct thyroid tumor cell lines (TPC1, KAT4, Hth74, XTC1, 8505c, K1, BCPAP and c643). * p < 0,05; ** p < 0,01; **** p < 0,0001. Results are representative of at least two independent assays with triplicates.
cPTC samples express higher levels of tOPN, OPNa and OPNb, when compared to adjacent thyroid, adenoma and FTC samples (p < 0.05) (Figure 2A; 2B and 2C). OPNc variant has the lowest expression levels and is only significantly overexpressed in cPTC samples in relation to adenoma and fvPTC samples (Figure 2D). These data show that OPNa splice variant is overexpressed in cPTCs when compared to other thyroid tissues. In an attempt to understand the expression pattern of OPN-SV in fvPTC cases, we separately analyzed well or poorly circumscribed fvPTC cases. We observed that poorly circumscribed fvPTC significantly overexpress tOPN, OPNb and OPNc variants, compared with well-circumscribed cases of fvPTC (p = 0.02, p = 0.002 and p = 0.01; respectively). Also a higher expression of OPNa in poorly circumscribed fvPTC was noted, although not reaching statistical significance (p = 0.07) (Figure 2E). The median transcript expression levels of tOPN were significantly higher in cPTC tumors larger than 2 cm (Table 3). tOPN and OPNa median expression levels were significantly higher in cPTC samples with extrathyroid extension and vascular invasion than in those without such features (Table 3). cPTC harboring BRAFV600E gene mutation exhibited higher tOPN, OPNa and OPNb transcript expression levels than those presenting wild type BRAF gene (p < 0.03) (Table 3). In fvPTC, older patients presented higher tOPN and OPNa expression levels (p < 0.04). No statistical significant differences have been observed between tOPN and OPN-SV transcript expression levels and other clinicopathological or molecular features in fvPTC.
Table 3: Correlation between tOPN and OPN-SV transcript expression levels with clinicopathological and molecular features in cPTC and fvPTC samples
Tissue |
Variable |
tOPN mRNA expression (Median) |
p-value |
OPNa mRNA expression (Median) |
p-value |
OPNb mRNA expression (Median) |
p-value |
|---|---|---|---|---|---|---|---|
cPTC |
Tumor size (cm) |
||||||
<2 (n=18) |
0.14 |
p=0.02 |
0.12 |
p=0.27 |
0.10 |
p=0.89 |
|
≥ 2 (n=38) |
0.17 |
0.13 |
0.10 |
||||
Extrathyroid Extension |
|||||||
Absent (n=20) |
0.15 |
p=0.04 |
0.12 |
p=0.02 |
0.09 |
p=0.09 |
|
Present (n=21) |
0.18 |
0.13 |
0.11 |
||||
Vascular Invasion |
|||||||
Absent (n=22) |
0.15 |
p=0.04 |
0.12 |
p=0.03 |
0.10 |
p=0.45 |
|
Present (n=28) |
0.17 |
0.13 |
0.10 |
||||
BRAFV600E Mutation |
|||||||
Absent (n=26) |
0.14 |
p=0.03 |
0.12 |
p=0.01 |
0.09 |
p=0.01 |
|
Present (n=30) |
0.18 |
0.13 |
0.11 |
||||
fvPTC |
Age (yr) |
||||||
<45 (n=13) |
0.11 |
p=0.03 |
0.09 |
p=0.04 |
0.08 |
p=0.07 |
|
≥45 (n=9) |
0.17 |
0.14 |
0.11 |
||||
Regarding OPN-SV expression patterns in TC cell lines, we found that OPNa variant is also overexpressed when compared to OPNb and OPNc variants in all the tested TC cell lines, except XTC1 (Figure 2F).
OPNa overexpression modulates proliferation and migration in c643 and 8505c cell lines
c643 and 8505c cells transfected with each OPN-SV express higher transcript levels of the corresponding ectopically expressed OPN-SV in relation to EV control cells (Figure 3A and 3B) and were used for further functional assays, as depicted below. The overexpression of OPN protein in c643 and 8505c cell lines transfected with tOPN and each OPN-SV was validated using immunocytochemistry (Figure 3C and 3D).
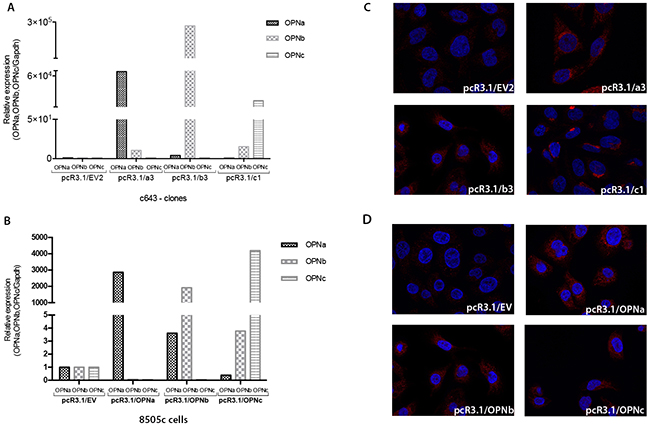
Figure 3: Stable overexpression of each OPN-SV in c643 and 8505c transfected cells. The expression levels of each OPN-SV were analyzed by qRT-PCR, when compared to control cells transfected with EV plasmid, which was used as the reference sample. The relative expression levels of each OPN-SV were calculated using the delta-delta CT method (pcR3.1/OPNa, pcR3.1/OPNb or pcR3.1/OPNc relative to pcR3.1/EV). Each OPN-SV is represented by a different bar graph, as indicated. A. OPN-SV mRNA overexpression in c643 cells; B. OPN-SV mRNA overexpression in 8505c cells. C. Immunocytochemistry analyses of OPN expression in control cells (c643 cells with EV: pcR3.1/EV) and in c643 cells overexpressing OPNa (pcR3.1/OPNa), OPNb (pcR3.1/OPNb) and OPNc (pcR3.1/OPNc) have been performed using the anti-tOPN antibody; D. Immunocytochemistry analyses of OPN expression in control cells (8505c cells with EV: pcR3.1/EV) and in 8505c cells overexpressing OPNa (pcR3.1/OPNa), OPNb (pcR3.1/OPNb) and OPNc (pcR3.1/OPNc). NOTE: Cell isolated clones used for these assays were named EV2, a3, b3 and c1 for each OPN-SV.
c643 and 8505c OPNa overexpressing cells displayed higher proliferation rates than OPNb, OPNc and EV control at 48 h (p < 0.01) (Figure 4A, 4B; p < 0.05).
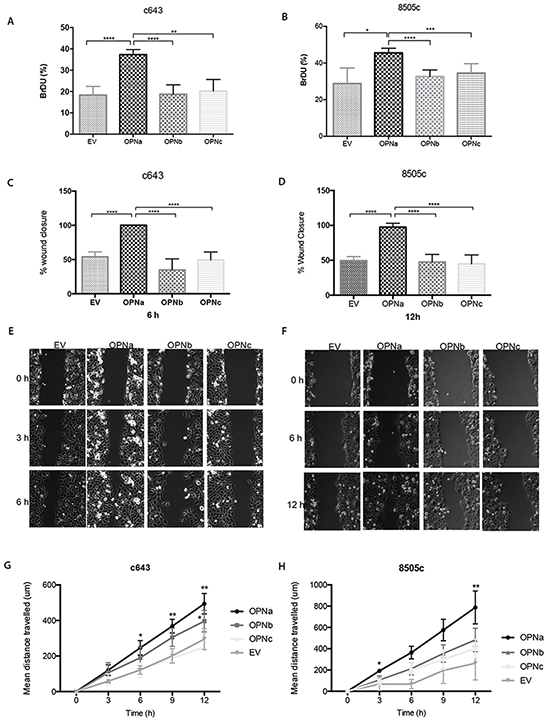
Figure 4: Cells overexpressing OPNa stimulate cell growth, migration and motility. DNA synthesis and proliferation rates have been evaluated by BrdU incorporation assays; A. c643 and B. 8505c cell clones (overexpressing EV, OPNa, OPNb, OPNc, respectively). Effect of each OPN-SV overexpression in c643 C. and in 8505c D. cells on migration rates using wound-healing assays. Representative images are shown for cell migration in c643 E. and 8505c F. OPN-SV overexpressing cells, which were monitored by time-lapse microscopy for 0, 3, 6, 9 and 12 hours after cell scratch. The % wound closure in the graphs represents the wound measured area. For motility assays, OPNa, OPNb, OPNc and EV cell clones were cultured in µ-Slide 4 Well Ph+ and monitored by time-lapse microscopy for 12 hours. Four microscope fields were averaged for each c643 G. and of 8505c H. OPN-SV overexpression clones and controls containing 10 cells/field (Representative videos are available in Online Supplemental Material). Graph data corresponds to motility rates from two independent experiments and values are expressed as mean ± se. *p < 0,05; ** p < 0,01; **** p < 0,0001. All the experiments were done in triplicated.
In order to investigate the effect of OPN-SV overexpression on c643 and 8505c cell migration, these cells were subjected to in vitro wound closure assays (Fig. 4C, 4D, 4E and 4F). c643 clones overexpressing OPNa have higher migration rates, as depicted by wounding area, than OPNb, OPNc or EV clones. At 6h after cell scratch, c643-OPNa overexpressing cells completely closed the wound edges, at variance with OPNb, OPNc or EV clones. The same migration behavior was observed for 8505c-OPNa overexpressing cells, although the wound closure has only been achieved at 12h after cell scratch. In order to further validate these motility properties, we used time-lapse video microscopy, monitoring the distance travelled by the cells during 12h. As shown in Figure 4G, c643-OPNa overexpressing clones showed higher motility rates than the remaining OPN-SV clones and EV controls. Similar higher motility behavior pattern has been observed for 8505c-OPNa overexpressing cells (Figure 4H) (Representative videos are shown in Supplemental Material).
TC cells overexpressing OPNa induces MMP2 and MMP9 activity
We then investigated the impact of OPNa overexpression in invasion-related enzymes secreted at the extracellular conditioned medium (CM). CM secreted from c643 and 8505c cells overexpressing OPNa, OPNb, OPNc or EV control were tested for MMP2 and MMP9 metalloproteinase activity. We found that the levels of matrix MMP2, mainly the active form, were increased in the CM secreted from c643-OPNa overexpressing cells, compared to CM secreted from the corresponding c643-OPNb and c643-OPNc clones (Figure 5A). No MMP9 expression was detected in c643 cells, regardless of the expressed OPN-SV. We observed an increase in the activity of MMP2 and MMP9 in the CM secreted from 8505c-OPNa overexpressing cells (Figure 5B). 8505c-OPNa overexpressing cells present higher levels of active MMP2 and MMP9 than 8505c-OPNb and 8505c-OPNc overexpressing cells.
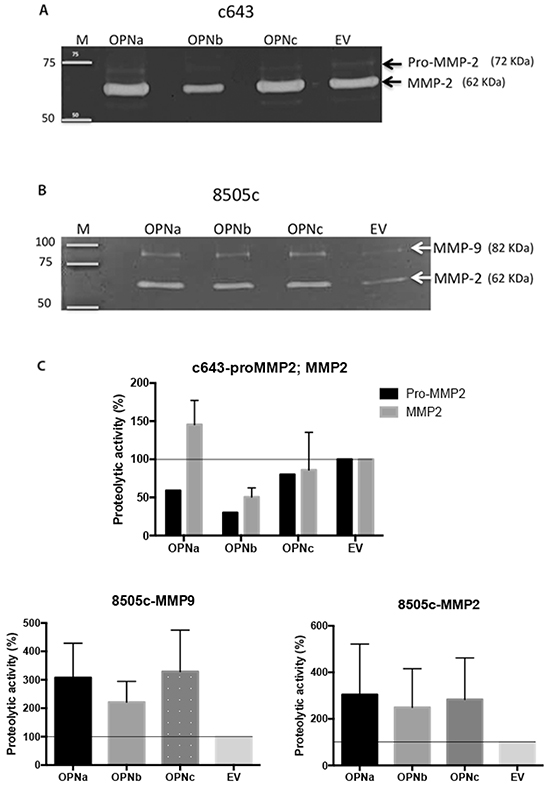
Figure 5: MMP2 and MMP9 activity in cells overexpressing OPN-SV. Gelatin zymography assay was used to analyze the levels of active MMP2 and MMP9 in conditioned medium from A. c643 (overexpressing OPNa, OPNb, OPNc and EV) and from B. 8505c (overexpressing OPNa, OPNb, OPNc and EV) cell clones. Representative images are shown. On the left are depicted molecular weights of standard markers; on the right are shown the variants of metalloproteinases (MMPs) observed in the gels. C. The intensity of gelatin-digested bands by pro- MMP2, MMP2 and MMP9 were measured by densitometry and are represented by the diagram bar. Percentage (%) of proteolytic activity from 8505c and c643 cells overexpressing OPNa, OPNb or OPNc was compared with the activity present in culture medium from 8505c and c643 control cells (EV). Data correspond to mean values of two independent experiments.
Overexpression of OPNa increases the invasive potential of TC cells in the CAM assay
In vivo CAM assays were conducted to evaluate the effect of ectopic OPNa overexpression on the angiogenic, tumorigenic and invasive behavior of c643 cells. To achieve this, the c643 clones overexpressing OPNa and EV were injected in the chick embryo CAM.
Tumors formed by cells overexpressing OPNa exhibited an invasive pattern (Figure 6A, left). In contrast, xenograft tumors formed by c643-EV cells were compact, with encapsulated-like borders (Figure 6A, right), as evaluated by HE staining (Figure 6A, upper panel) and IHC for tOPN staining (Figure 6A, lower panel). We used a score system to semi-quantify the property of TC cells to spread inside the CAM. We observed that c643 cells overexpressing OPNa exhibited higher invasive capacity (p = 0.003) than c643-EV cells. This higher invasiveness was characterized by the presence of tumor cells oriented towards the invasion front and the presence of isolated cells and small clusters at distance from the tumor bulk (Figure 6B). Similar angiogenic (p > 0.05; Figure 6C) and tumorigenic responses (p > 0.05; Figure 6D) were observed in c643-OPNa when compared with c643-EV control.
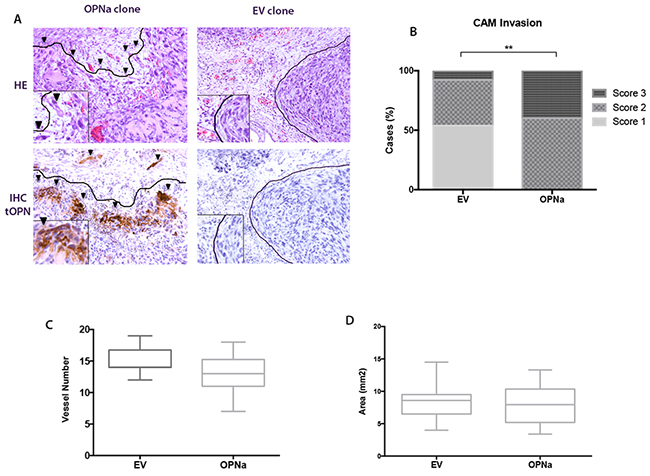
Figure 6: Overexpression of OPNa increases the invasive potential of TC cells in the CAM assay. A. Invasive capacity of inoculated cells was evaluated by HE and IHC using an anti-tOPN antibody in xenograft CAM tumor sections. Positive human tOPN immunostaining demonstrating effective overexpression of OPN in CAM tumors originated from OPNa clones. c643-EV cells forming compacted tumors (score 1; full lines surrounding the tumor bulk, right panels). OPNa tumors exhibiting loosen structures and single cells invading the xenograft CAM tumor mesenchyme (arrow heads; score 3, left panels); B. Invasion score analysis demonstrating c643-OPNa overexpressing cells and their corresponding invasive score, when compared to EV control clones (p = 0.003) C. CAM angiogenic assay, as demonstrated by the number of formed vessels in c643-OPNa and EV control clones D. CAM xenograft tumors areas measured in mm2 indicating tumorigenesis in c643-OPNa and EV clones.
DISCUSSION
We characterize for the first time the transcript and protein expression patterns of tOPN and OPN-SV in DTC and TC cells. Then, we also showed their association to TC prognosis and progression features, especially in cPTC samples. Our data further demonstrated that OPNa transcript is the dominant overexpressed splice variant in DTC tissues and in distinct thyroid cell lines, notably in cPTC. Remarkably, high transcript expression levels of tOPN and OPNa, but not OPNb and OPNc, were associated with aggressive cPTC clinicopathological features (tumor size, vascular and extrathyroid invasion). Moreover, we demonstrated using in vitro and in vivo approaches that ectopically overexpressed OPNa promotes cell growth, migration and invasion in TC-derived cell lines.
We have shown that tOPN is predominantly expressed (both at transcript and protein level) in cPTC and in fvPTC, when compared to FTC and adjacent non-tumoral thyroid tissues. In fvPTC samples, we observed higher expression of tOPN, OPNa and OPNb variant in poorly circumscribed cases. This result is very interesting for several reasons: a) first, it is in accordance with the increased expression of OPN and the respective spliced forms in cases presenting invasive features; b) second, it corroborates our in vitro and in vivo results showing an increased invasiveness in cells overexpressing tOPN and OPN-SV; c) finally, it shows the different biological characteristics of the well and poorly circumscribed fvPTC. In this last point it is also worth to mention that our results in OPN expression fits with the recent proposal for the reclassification of encapsulated fvPTC as NIFT (“noninvasive follicular thyroid neoplasm with papillary-like nuclear features”) due to the very low risk of adverse outcome of these patients [27].
Further, we found that high levels of tOPN expression in cPTC are associated with increased tumor size, presence of extrathyroid extension, vascular invasion and BRAFV600E mutation. Our results regarding tOPN are in accordance with previous studies demonstrating tOPN overexpression in PTC samples [15]. Our results also corroborates previous studies which showed that tOPN overexpression (transcript and/or protein) are significantly associated with poor prognostic factors, such as presence of lymph node metastasis, tumor size and poor disease free survival in PTC samples [13, 14, 16, 17].
We also observed that tOPN protein overexpression in cPTC is significantly associated with hyaline stroma. These data are in accordance with OPN as a glycoprotein secreted in the extracellular matrix, both in tumor and non-tumoral tissues [28]. OPN is also known to be upregulated in the tissue stroma in different conditions, such as salivary pleomorphic adenomas [29] and intrahepatic cholangiocarcinoma [30]. It is well known that the interplay between epithelial cells and the microenvironment may contribute to keep the epithelial polarity and to modulate growth inhibition [31]. On the other hand, the stromal compartments undergo changes in response to emerging epithelial lesions that can have a key role in cancer initiation and progression [31, 32]. Accordingly, our observed data regarding the correlation of tOPN and the presence of a hyaline stroma support the assumption that either tOPN expression alone or tOPN in association to hyaline stroma may play a role in cPTC tumor aggressiveness.
Our data show that OPNa variant is overexpressed and specifically associated with poor prognostic features in PTC. In particular, OPNa variant was significantly associated with presence of extrathyroid extension, vascular invasion and BRAFV600E mutation. In contrast to this, OPNb was only significantly associated with BRAFV600E mutation. In the fvPTC, the only significant association observed was between high tOPN and OPNa expression levels and older patients. Based on these findings, we postulate that elevated OPNa expression in TC may occur during tumor progression, facilitating more aggressive phenotypes. Some authors have shown that OPN-SV expression and its associations to clinicopathological features seem to be tissue specific. For instance, it has been reported that high OPNb and OPNc expression levels in breast cancer [33] and in gastric tumors [34] is correlated with more aggressive clinicopathological features. In a combined expression analysis, OPNc, ER and HER2 can reliably predict grade 2-3 in breast cancer samples [35]. Moreover, in a prostate tumor model, our group has also observed that OPNc overexpression is correlated to poor prognostic features [36]. Conversely, our data show that OPNa has a more relevant prognostic role in PTC than the other OPN-SV.
To assess the possible impact of OPN-SV in TC cell properties we ectopically overexpressed OPNa, OPNb or OPNc in c643 and 8505c cell lines with plasmid constructs containing each of the three OPN-SV. We observed that TC cells overexpressing OPNa displayed significantly increased cell growth, migration and motility, whereas OPNb and OPNc overexpression in TC cells did not induce similar effects. Other reports have demonstrated that OPN-SV play an important role in tumor progression by regulating cell growth, adhesion, migration and tumor formation. As reported by Lin J and co-workers [37], OPNb overexpressing cells derived from esophageal adenocarcinoma also evoked enhanced cell proliferation, migration and invasion. Additionally, our group also previously demonstrated that OPNc activates invasion and adhesion properties, as well as metastatic potential and angiogenesis in a prostate and an ovarian carcinoma model [26, 38]. In prostate cancer cells, OPNc can activate AR signaling [39] and resistance to docetaxel [40]. Furthermore, other groups demonstrated that in hepatocellular carcinoma cells, OPNa and OPNb can induce cell migration [25]. Our findings highlight the importance of OPNa in TC cell growth and migratory and invasive phenotype.
To further explore OPNa roles on modulating TC invasive properties, we also explored the role of OPNa in the activation of matrix metalloproteinases (MMPs). MMPs are important enzymes in the metastatic cell arsenal. These proteins can degrade both cell adhesion molecules and extracellular matrix molecules, enabling tumor cells both to migrate from the tumor bulk and to invade adjacent tissues [41]. Previous data from our group in prostate and ovarian tumor models showed that cells overexpressing the OPNc variant induce expression of MMP2 and MMP9, highlighting the functional tissue specificity of OPN-SV [38]. Thyroid carcinomas produce elevated levels of MMP2, which has been correlated with the presence of lymph node metastasis [51]. Herein, we have found that CM collected from cells overexpressing OPNa have increased activity of MMP2 in c643 cells and MMP2 and MMP9 in 8505c cell lines. These results evidence that OPNa may promote TC cell invasion through inducing MMP2 and MMP9 secretion. The detailed mechanism by which this event occurs still needs further characterization. Nonetheless, it has been described that OPN can regulate MMPs activity by binding to pro-MMP9, thus promoting its activation [42]. Additionally, OPN can induce NFkB-mediated pro-MMP2 and MMP9 activation through IkBa/IKK signaling pathway [43].
Since MMPs expression and cancer cell migration are fundamental features for tumor invasion [44], we further investigated the contribution of OPNa variant for a TC cell line invasiveness using an in vivo experimental model. Using the CAM assay approach, we observed that tumors formed by these cell clones present a loosen structure, in which the cells were oriented towards the invasion front while single cells and cell clusters invading the CAM mesenchyme could also be observed. In contrast to this, EV clones formed compact tumors, with clear defined boarders lacking invading cells. Similarly to our data, overexpression of OPNa has been previously associated with the cancer cell invasion modulation in mesothelioma, breast cancer and hepatocellular carcinomas [25, 45, 46]. Although activating cell invasion, OPNa overexpression does not significantly modulated angiogenesis and tumorigenesis in this in vivo tumor model. Some oncogenic proteins can activate some specific steps in tumor progression, but not others. As evidenced by our data OPNa overexpression in vivo may predominantly modulate signaling pathways that stimulate migration and invasion, possibly through stimulating extracellular matrix degradation by MMP2 and MMP9. In light of our results, we may hypothesize that the increased invasive capacity of c643 cells overexpressing OPNa (in comparison to c643-EV cells) allows the cells to reach the blood vessels, and have no effect in the recruitment of new vessels.
In conclusion, our data demonstrated that OPNa is the prevalent OPN-SV in DTC tissues and cell lines, and that overexpression of OPNa is associated with poor prognostic and invasive features in cPTC. Moreover, OPNa overexpression in TC cell lines strongly increases cell migration, invasion and MMPs activity, evidencing a major role for OPNa in TC progression features. Taken together, these features provide early evidence that OPNa can potentially mediate invasive and metastatic potential in cPTCs.
MATERIALS AND METHODS
Tumor specimens
We evaluated adjacent thyroid tissues (n = 20), thyroid adenomas (n = 6), follicular thyroid carcinoma (FTC) (n = 12), follicular variant of papillary thyroid carcinoma (fvPTC) (n = 22) and classic papillary thyroid carcinoma (cPTC) (n = 69). All the analyzed specimens were collected from primary tumors, surgically resected at the Centro Hospitalar São João, Porto, Portugal. After surgery, samples were immediately snap-frozen and stored at -80°C until use. Additional fragments were fixed in 10% buffered formalin and embedded in paraffin (FFPE). The histologic diagnosis of all cases were reviewed by three thyroid pathologists (CE, ER, MSS) according to the WHO classification [47]. Clinicopathological and molecular features are summarized in Supplementary Table S2. All the procedures described in this study were approved by the respective ethical boards and are in accordance with national and institutional standards.
Immunohistochemistry
OPN IHC analysis was performed in representative tumor tissue sections of 44 cPTC, 16 fvPTC and 10 FTC samples using an antibody that recognize all three OPN-SV (anti-total OPN- tOPN) (polyclonal, goat, 1:500, R&D Systems). Normal gallbladder was used as a positive control, once it has been previously reported to overexpress tOPN [48, 49]. IHC procedure was done according to [49]. Semi-quantitative IHC evaluation was independently performed by two observers (CE and LBF). Total OPN staining was scored in the range 0-7, which corresponds to the sum of the staining intensity (absent = 0, faint = 1, moderate = 2 and strong = 3) plus the proportion of positively stained cells (<5% = 0; 5-25% = 1; 25–50% = 2, 50–75% = 3 and >75% = 4) (Table 1).
RNA extraction, reverse transcription and real time PCR
Total RNA was extracted from cell lines and tumor tissues using Trizol reagent (Life Technologies, GIBCO BRL). For cDNA preparation, 1 μg of total RNA was reverse transcribed using the RevertAid first-strand cDNA synthesis kit (Fermentas, Burlington, ON, Canada).
Each OPN-SV transcript region was amplified with specific oligonucleotide pairs (Supplementary Table S3 and Supplementary Figure S1A). Quantitative PCR reactions were conducted using SYBR Green detection system (Applied Biosystems, Warrington WA1 4SR, UK). Conditions for OPN-SV amplification were 50º C for 2 minutes, 94º C for 5 minutes followed by 40 cycles of 94º C for 30 seconds, 60º C for 30 seconds, and 72º C for 45 seconds. Relative gene expression was calculated using the Delta-Delta CT method. GAPDH gene was used as the constitutive control.
Cell culture, OPN plasmids and transfections
We analyzed eight TC cell lines: TPC1, KAT4, Hth74, XTC1, 8505c, K1, BCPAP and c643, from which two were selected for stable transfection. All cell lines were authenticated using DNA profile analysis, obtained with the PowerPlex 16 system (Promega, Madison, USA), according to ATCC and HSRRB available DNA profiles [50]. All the cell lines were cultured in standard culture medium, supplemented with 10% fetal bovine serum (FBS), 100 IU/ml penicillin and 100 mg/ml streptomycin in a humidified environment containing 5% CO2 at 37˚C. The open reading frame of OPN-SV, was cloned into pCR3.1 mammalian expression vector, as previously described [51]. OPN-SV expression vectors (kindly provided by Dr. George Weber (Cincinnati University)) were used to transfect c643 and 8505c cell lines (the ones with lower OPN expression; Figure 2F) in order to overexpress each OPN-SV. These cells were also transfected with the pCR3.1 control empty vector (EV). Transfections were performed using LipofectamineTM 2000 (Invitrogen, CA). Expression plasmids were transfected into c643 and 8505c cells and the stably overexpressing cell clones were selected using 600 μg/ml of G418 for c643 and 800 μg/ml for 8505c cell lines.
Immunocytochemistry
Cells plated on coverslips were fixed in 4% paraformaldehyde for 20 min at room temperature (RT). Cells were emerged in NH4Cl 50 mM in PBS during 10 min, and then, cells were permeabilized in 0.2% Triton X-100 and blocked in 5% BSA in PBS for 30 min at RT. Primary antibodies were diluted in PBS containing 5% BSA and incubated overnight at 4ºC as follows: rabbit polyclonal against OPN (Rockland, Limerick, PA, USA, diluted 1:500). Coverslips were washed in 0.1% Triton X-100 prepared in PBS (PBT) and incubated with goat anti-rabbit IgG secondary antibodies conjugated with Alexa Fluor 594 (Invitrogen; diluted 1:300 in 5% BSA–PBT) for 1h at RT. Nuclei were stained with 0.1 mg/ml diamino phenylindole (DAPI; Sigma–Aldrich). Images were taken by a Zeiss fluorescence microscope with ApoTome attachment (Axio Imager Z1 stand).
Cell proliferation
Proliferation was measured by evaluating bromodeoxy uridine (BrdU) incorporation in c643 and 8505c OPN-SV transfected cells as previously described [52]. Quantification of BrdU positive cells was performed using ImageJ software, by counting the percentage of BrdU-positive nuclei on a total of 1500 cells.
Cell migration and motility assays
For cell migration assays, c643 and 8505c (overexpressing OPNa, OPNb, OPNc or EV) clones were seeded until forming a confluent monolayer. The cell wound was created by scraping the cell monolayer with a pipette tip. After scratch, cell migration was monitored by time-lapse microscopy and images were taken every 10 minutes for 24 hours.
For motility assays, 3,0 x 10⁵ cells of c643 and 8505c OPNa, OPNb, OPNc or EV transfected cells were plated in μ-Slide 4 Well Ph+ and monitored by time-lapse video microscopy to evaluate cell motility. Migratory tracks were measured for individual cells overexpressing each OPN-SV or EV cells using ImageJ software. Four microscope fields containing around 10 cells per field were monitored for each cell line.
Gelatin zymography
2.5 x 10⁵ cells from c643 and 8505c (overexpressing OPNa, OPNb, OPNc or EV) were seeded to generate conditioned medium (CM). Matrix metalloproteases (MMPs), namely MMP2 and MMP9, activity was assessed in the CM of each condition by gelatin zymography, as previously described [53].
In vivo chicken embryo chorioallantoic membrane (CAM) angiogenesis, tumorigenesis and invasion assays
In vivo angiogenic activity of c643 cells overexpressing OPNa and the EV controls were assessed by chicken chorioallantoic membrane (CAM) assay, as previously described [54]. According to the European Directive 2010/63/EU, ethical approval is not required for experiments using embryonic chicken. Correspondingly, the Portuguese law on animal welfare does not restrict the use of chicken eggs.
CAMs bearing the tumors were fixed in 10% neutral-buffered formalin and paraffin-embedded for slide sections. Sections were HE stained for histological examination or processed for anti-tOPN IHC analysis to validate OPN overexpression in CAM-xenografted tumor cells. These xenograft tissue sections were also used to evaluate cell invasion. The analysis was performed in a blind fashion manner by two independent observers and slides were scored as follows: score 1- Tumor cells are tight together forming a compact mass. The invasion front (area where tumor cells touch the CAM mesenchyme) is clearly defined as an encapsulated -like structure; score 2- Tumor cells are more loosen at the core of the tumor and in some cases, matrigel can be detected. Cells are oriented towards the invasion front; score 3- Tumor cells are oriented towards the invasion front and it is possible to observe single cells or small clusters of cells disconnected from the invasive front.
Data and statistical analysis
Statistical analyses were performed using 22.0 SPSS statistical package (IBM, 2014). X2 and independent samples t-test were performed to verify if there was any association(s) between OPN expression and clinicopathological data. GraphPad was used for the construction of the graphs. ANOVA test was used to calculate significance in the CAM angiogenic and tumorigenic assays. A ChiSquare test was used to calculate significance in the CAM invasion assay. All results are presented as mean ± standard error. Values of p ≤ 0.05 were considered to be statistically significant.
ACKNOWLEDGMENTS
We would like to thank Prof. Marc Mareel (Laboratory of Experimental Cancerology, Ghent University Hospital, Ghent, Belgium), Prof. Jacques Dumont (Institute of Interdisciplinary Research (IRIBHM), University of Brussels, Brussels, Belgium), Prof. F. Savagner (Laboratoire de Biochimie et Biologie Moleculaire, Faculte de Medecine, Angers, France), Prof. David Wynford-Thomas (Department of Pathology, University of Wales College of Medicine, Cardiff, United Kingdom) for gently providing us with all the cell lines used in the present study.
CONFLICTS OF INTEREST
The authors declare that there is no conflict of interest that could be perceived as prejudicing the impartiality of the research reported.
GRANT SUPPORT
This study was supported by a CNPq PhD Scholarship (“National Counsel of Technological and Scientific Development”, Brazil), Science Without Borders, Process n# 237322/2012-9 for LBF and by FCT, the Portuguese Foundation for Science and Technology, through a PhD grant to CT SFRH/BD/87887/2012 and AP SFRH/BD/110617/2015. This work was financed by FEDER - Fundo Europeu de Desenvolvimento Regional funds through the COMPETE 2020 - Operacional Programme for Competitiveness and Internationalisation (POCI), Portugal 2020, and by Portuguese funds through FCT - Fundação para a Ciência e a Tecnologia/ Ministério da Ciência, Tecnologia e Inovação in the framework of the project “Institute for Research and Innovation in Health Sciences” (POCI-01-0145-FEDER-007274). Further funding from the project “Advancing cancer research: from basic knowledgment to application”; NORTE-01-0145-FEDER-000029; “Projetos Estruturados de I&D&I”, funded by Norte 2020 – Programa Operacional Regional do Norte;
REFERENCES
1. Jemal A, Siegel R, Xu J and Ward E. Cancer statistics, 2010. CA Cancer J Clin. 2010; 60:277-300.
2. Pellegriti G, Frasca F, Regalbuto C, Squatrito S and Vigneri R. Worldwide increasing incidence of thyroid cancer: update on epidemiology and risk factors. Journal of cancer epidemiology. 2013; 2013:965212.
3. Davies L and Welch HG. Increasing incidence of thyroid cancer in the United States, 1973-2002. Jama. 2006; 295:2164-2167.
4. Grodski S, Brown T, Sidhu S, Gill A, Robinson B, Learoyd D, Sywak M, Reeve T and Delbridge L. Increasing incidence of thyroid cancer is due to increased pathologic detection. Surgery. 2008; 144:1038-1043; discussion 1043.
5. Enewold L, Zhu K, Ron E, Marrogi AJ, Stojadinovic A, Peoples GE and Devesa SS. Rising thyroid cancer incidence in the United States by demographic and tumor characteristics, 1980-2005. Cancer epidemiology, biomarkers & prevention. 2009; 18:784-791.
6. Kent WD, Hall SF, Isotalo PA, Houlden RL, George RL and Groome PA. Increased incidence of differentiated thyroid carcinoma and detection of subclinical disease. CMAJ. 2007; 177:1357-1361.
7. Simard EP, Ward EM, Siegel R and Jemal A. Cancers with increasing incidence trends in the United States: 1999 through 2008. CA Cancer J Clin. 2012; 62:118-128.
8. Aschebrook-Kilfoy B, Ward MH, Sabra MM and Devesa SS. Thyroid cancer incidence patterns in the United States by histologic type, 1992-2006. Thyroid. 2011; 21:125-134.
9. Brenner H. Long-term survival rates of cancer patients achieved by the end of the 20th century: a period analysis. Lancet. 2002; 360:1131-1135.
10. Burningham AR, Krishnan J, Davidson BJ, Ringel MD and Burman KD. Papillary and follicular variant of papillary carcinoma of the thyroid: Initial presentation and response to therapy. Otolaryngol Head Neck Surg. 2005; 132:840-844.
11. Carneiro RM, Carneiro BA, Agulnik M, Kopp PA and Giles FJ. Targeted therapies in advanced differentiated thyroid cancer. Cancer treatment reviews. 2015; 41:690-698.
12. Denhardt DT and Guo X. Osteopontin: a protein with diverse functions. FASEB J. 1993; 7:1475-1482.
13. Guarino V, Faviana P, Salvatore G, Castellone MD, Cirafici AM, De Falco V, Celetti A, Giannini R, Basolo F, Melillo RM and Santoro M. Osteopontin is overexpressed in human papillary thyroid carcinomas and enhances thyroid carcinoma cell invasiveness. J Clin Endocrinol Metab. 2005; 90:5270-5278.
14. Sun Y, Fang S, Dong H, Zhao C, Yang Z, Li P and Wang J. Correlation between osteopontin messenger RNA expression and microcalcification shown on sonography in papillary thyroid carcinoma. J Ultrasound Med. 2011; 30:765-771.
15. Briese J, Cheng S, Ezzat S, Liu W, Winer D, Wagener C, Bamberger AM and Asa SL. Osteopontin (OPN) expression in thyroid carcinoma. Anticancer Res. 2010; 30:1681-1688.
16. Kang KH. Osteopontin expression in papillary thyroid carcinoma and its relationship with the BRAF mutation and tumor characteristics. J Korean Surg Soc. 2013; 84:9-17.
17. Wafaey Gomaaa MA-A, Osman Hamourd, Jaudah Al-Maghrabia. Osteopontin cytoplasmic immunoexpression is a predictor of poor disease-free survival in thyroid cancer. Journal of Microscopy and Ultrastructure. 2013; 1:8-16.
18. Wai PY and Kuo PC. Osteopontin: regulation in tumor metastasis. Cancer metastasis reviews. 2008; 27:103-118.
19. Rittling SR and Chambers AF. Role of osteopontin in tumour progression. Br J Cancer. 2004; 90:1877-1881.
20. Murphy G and Gavrilovic J. Proteolysis and cell migration: creating a path? Current opinion in cell biology. 1999; 11:614-621.
21. Shevde LA and Samant RS. Role of osteopontin in the pathophysiology of cancer. Matrix Biol. 2014; 37:131-141.
22. Xu K, Tian X, Oh SY, Movassaghi M, Naber SP, Kuperwasser C and Buchsbaum RJ. The fibroblast Tiam1-osteopontin pathway modulates breast cancer invasion and metastasis. Breast cancer research. 2016; 18:14.
23. Young MF, Kerr JM, Termine JD, Wewer UM, Wang MG, McBride OW and Fisher LW. cDNA cloning, mRNA distribution and heterogeneity, chromosomal location, and RFLP analysis of human osteopontin (OPN). Genomics. 1990; 7:491-502.
24. Anborgh PH, Mutrie JC, Tuck AB and Chambers AF. Pre- and post-translational regulation of osteopontin in cancer. Journal of cell communication and signaling. 2011; 5:111-122.
25. Chae S, Jun HO, Lee EG, Yang SJ, Lee DC, Jung JK, Park KC, Yeom YI and Kim KW. Osteopontin splice variants differentially modulate the migratory activity of hepatocellular carcinoma cell lines. Int J Oncol. 2009; 35:1409-1416.
26. Tilli TM, Franco VF, Robbs BK, Wanderley JL, da Silva FR, de Mello KD, Viola JP, Weber GF and Gimba ER. Osteopontin-c splicing isoform contributes to ovarian cancer progression. Mol Cancer Res. 2011; 9:280-293.
27. Nikiforov YE, Seethala RR, Tallini G, Baloch ZW, Basolo F, Thompson LD, Barletta JA, Wenig BM, Al Ghuzlan A, Kakudo K, Giordano TJ, Alves VA, Khanafshar E, Asa SL, El-Naggar AK, Gooding WE, et al. Nomenclature Revision for Encapsulated Follicular Variant of Papillary Thyroid Carcinoma: A Paradigm Shift to Reduce Overtreatment of Indolent Tumors. JAMA Oncol. 2016.
28. Subraman V, Thiyagarajan M, Malathi N and Rajan ST. OPN -Revisited. J Clin Diagn Res. 2015; 9:ZE10-13.
29. Kusafuka K, Yamaguchi A, Kayano T and Takemura T. Expression of bone matrix proteins, osteonectin and osteopontin, in salivary pleomorphic adenomas. Pathology, research and practice. 1999; 195:733-739.
30. Sulpice L, Rayar M, Desille M, Turlin B, Fautrel A, Boucher E, Llamas-Gutierrez F, Meunier B, Boudjema K, Clement B and Coulouarn C. Molecular profiling of stroma identifies osteopontin as an independent predictor of poor prognosis in intrahepatic cholangiocarcinoma. Hepatology. 2013; 58:1992-2000.
31. Bhowmick NA and Moses HL. Tumor-stroma interactions. Current opinion in genetics & development. 2005; 15:97-101.
32. Kim JB, Stein R and O’Hare MJ. Tumour-stromal interactions in breast cancer: the role of stroma in tumourigenesis. Tumour Biol. 2005; 26:173-185.
33. Patani N, Jouhra F, Jiang W and Mokbel K. Osteopontin expression profiles predict pathological and clinical outcome in breast cancer. Anticancer research. 2008; 28:4105-4110.
34. Tang X, Li J, Yu B, Su L, Yu Y, Yan M, Liu B and Zhu Z. Osteopontin splice variants differentially exert clinicopathological features and biological functions in gastric cancer. International journal of biological sciences. 2013; 9:55-66.
35. Mirza M, Shaughnessy E, Hurley JK, Vanpatten KA, Pestano GA, He B and Weber GF. Osteopontin-c is a selective marker of breast cancer. Int J Cancer. 2008; 122:889-897.
36. Tilli TM, Thuler LC, Matos AR, Coutinho-Camillo CM, Soares FA, da Silva EA, Neves AF, Goulart LR and Gimba ER. Expression analysis of osteopontin mRNA splice variants in prostate cancer and benign prostatic hyperplasia. Exp Mol Pathol. 2012; 92:13-19.
37. Lin J, Myers AL, Wang Z, Nancarrow DJ, Ferrer-Torres D, Handlogten A, Leverenz K, Bao J, Thomas DG, Wang TD, Orringer MB, Reddy RM, Chang AC, Beer DG and Lin L. Osteopontin (OPN/SPP1) isoforms collectively enhance tumor cell invasion and dissemination in esophageal adenocarcinoma. Oncotarget. 2015; 6:22239-22257. doi: 10.18632/oncotarget.4161.
38. Tilli TM, Mello KD, Ferreira LB, Matos AR, Accioly MT, Faria PA, Bellahcene A, Castronovo V and Gimba ER. Both osteopontin-c and osteopontin-b splicing isoforms exert pro-tumorigenic roles in prostate cancer cells. Prostate. 2012; 72:1688-1699.
39. TATIANA MARTINS TILLI LBFaERPG. Osteopontin-c mediates the upregulation of androgen responsive genes in LNCaP cells through PI3K/Akt and androgen receptor signaling. Oncology Letters. 2015; 9.
40. Nakamura KD, Tilli TM, Wanderley JL, Palumbo A, Jr., Mattos RM, Ferreira AC, Klumb CE, Nasciutti LE and Gimba ER. Osteopontin splice variants expression is involved on docetaxel resistance in PC3 prostate cancer cells. Tumour Biol. 2015.
41. Denhardt D. Osteopontin expression correlates with melanoma invasion. J Invest Dermatol. 2005; 124:xvi-xviii.
42. Fedarko NS, Jain A, Karadag A and Fisher LW. Three small integrin binding ligand N-linked glycoproteins (SIBLINGs) bind and activate specific matrix metalloproteinases. FASEB J. 2004; 18:734-736.
43. Rangaswami H, Bulbule A and Kundu GC. Nuclear factor-inducing kinase plays a crucial role in osteopontin-induced MAPK/IkappaBalpha kinase-dependent nuclear factor kappaB-mediated promatrix metalloproteinase-9 activation. J Biol Chem. 2004; 279:38921-38935.
44. Friedl P and Wolf K. Tumour-cell invasion and migration: diversity and escape mechanisms. Nature reviews Cancer. 2003; 3:362-374.
45. Shi Z, Mirza M, Wang B, Kennedy MA and Weber GF. Osteopontin-a alters glucose homeostasis in anchorage-independent breast cancer cells. Cancer letters. 2014; 344:47-53.
46. Ivanov SV, Ivanova AV, Goparaju CM, Chen Y, Beck A and Pass HI. Tumorigenic properties of alternative osteopontin isoforms in mesothelioma. Biochemical and biophysical research communications. 2009; 382:514-518.
47. Rosai J DRA CM, Frable WJ, Tallini G. (2014). Tumors of the Thyroid & Parathyroid Glands. (Washington DC).
48. Brown LF, Berse B, Van de Water L, Papadopoulos-Sergiou A, Perruzzi CA, Manseau EJ, Dvorak HF and Senger DR. Expression and distribution of osteopontin in human tissues: widespread association with luminal epithelial surfaces. Mol Biol Cell. 1992; 3:1169-1180.
49. Ferreira LB, Eloy K, Pestana A, Lyra J, Moura M, Prazeres H, Tavares C, Sobrinho-Simoes M, Gimba ER and Soares P. Osteopontin expression is correlated with differentiation and good prognosis in medullary thyroid carcinoma. European journal of endocrinology / European Federation of Endocrine Societies. 2016.
50. Meireles AM, Preto A, Rocha AS, Rebocho AP, Maximo V, Pereira-Castro I, Moreira S, Feijao T, Botelho T, Marques R, Trovisco V, Cirnes L, Alves C, Velho S, Soares P and Sobrinho-Simoes M. Molecular and genotypic characterization of human thyroid follicular cell carcinoma-derived cell lines. Thyroid. 2007; 17:707-715.
51. He B, Mirza M and Weber GF. An osteopontin splice variant induces anchorage independence in human breast cancer cells. Oncogene. 2006; 25:2192-2202.
52. Populo H, Tavares S, Faustino A, Nunes JB, Lopes JM and Soares P. GNAQ and BRAF mutations show differential activation of the mTOR pathway in human transformed cells. PeerJ. 2013; 1:e104.
53. Cardoso AP, Pinto ML, Pinto AT, Oliveira MI, Pinto MT, Goncalves R, Relvas JB, Figueiredo C, Seruca R, Mantovani A, Mareel M, Barbosa MA and Oliveira MJ. Macrophages stimulate gastric and colorectal cancer invasion through EGFR Y(1086), c-Src, Erk1/2 and Akt phosphorylation and smallGTPase activity. Oncogene. 2014; 33:2123-2133.
54. Gomes C, Osorio H, Pinto MT, Campos D, Oliveira MJ and Reis CA. Expression of ST3GAL4 leads to SLe(x) expression and induces c-Met activation and an invasive phenotype in gastric carcinoma cells. PloS one. 2013; 8:e66737.