
INTRODUCTION
Despite decreasing incidence and mortality worldwide, [1, 2] gastric cancer (GC) remains the third most prevalent cancer and third leading cause of cancer-related death in mainland China. [3] The estimated number of new cases and deaths in China is much higher than in any other country and comprises nearly one-half of the global total. [4, 5] The high mortality rate is mainly attributed to late detection. In particular, the proportion of early GC detection was only 9%, even in many high-volume hospitals in China. [6] Therefore, we need invent an easy and quick method for screening for the disease.
Endoscopic biopsy and histopathological evaluation are considered the gold standard for diagnosing GC, but the stress caused by this method and its high expense make it difficult to use it as a routine method for screening on a population basis, particularly for asymptomatic individuals. [7, 8] The detection of serum indicators is simple and easy and has become a common clinical method for screening tumors. Tumor markers (TMs), such as alpha fetoprotein (AFP), carcinoembryonic antigen (CEA), cancer antigen 19-9 (CA19-9) and cancer antigen 72-4 (CA72-4), have been widely used for the diagnosis of different types of cancers, including liver, colorectal cancer and pancreatic cancers. [9–11] However, according to the current knowledge, most previous studies on TMs focused on their use as prognostic indicators, predicting the efficacy of both first-line chemotherapy and postsurgical surveillance in GC. [12–14] There are few studies on predictive screening or early detection, particularly for CA72-4.
Therefore, the objective of the present study was to investigate the diagnostic value of serum TMs for GC. Moreover, we explored the relationship between the TM levels and the clinicopathological features of GC and established an accurate discriminant equation to predict the occurrence of GC.
RESULTS
Serum TMs in the training set
Statistical data, including age and gender, and the test results of the TMs in the two groups are shown in Table 1. The median serum concentrations and positive rates of CEA, CA19-9 and CA72-4 were significantly higher in the GC group than in the control group (Figure 1).
Table 1: Serum levels and positive rates of carcinoembryonic antigen, cancer antigen 19-9 and cancer antigen 72-4 in the training set
GC |
Control group |
Total |
P |
|
|---|---|---|---|---|
Cases |
1945 |
1589 |
3534 |
|
Age(y) |
55.83 ± 11.988 |
55.99 ± 10.218 |
55.91 ± 11.225 |
0.672 |
Gender(M/F) |
1304/641 |
1073/516 |
2377/1157 |
0.761 |
CEA(ng/ml) |
2.7(2.59) |
1.73(1.54) |
2.21(2.02) |
< 0.001 |
CA19-9(U/ml) |
11.65(16.52) |
9.57(8.08) |
10.38(11.31) |
< 0.001 |
CA72-4(U/ml) |
2.98(3.79) |
1.82(2.28) |
2.54(2.96) |
< 0.001 |
CEA positive cases(%) |
390(20.1%) |
84(5.3%) |
473(13.4%) |
< 0.001 |
CA19-9 positive cases(%) |
416(21.4%) |
60(3.8%) |
475(13.4%) |
< 0.001 |
CA72-4 positive cases(%) |
537(27.6%) |
235(14.8%) |
771(21.8%) |
< 0.001 |
Combination positive cases(%) |
938(48.2%) |
346(21.8%) |
1284(36.3%) |
< 0.001 |
GC = gastric cancer group, CEA = carcinoembryonic antigen, CA19-9 = cancer antigen 19-9, CA72-4 = cancer antigen 72-4.
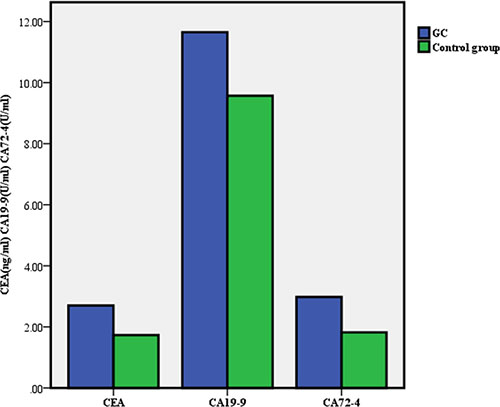
Figure 1: Mean levels of carcinoembryonic antigen, cancer antigen 19-9 and cancer antigen 72-4 in the gastric cancer (GC) group and control group respectively.
Positive rates of serum TMs in GCs with different clinicopathological features
According to the baseline information for GC, we subdivided the GC group and calculated the positive rates of the three TMs in each group (Table 2).We found that there were significant differences in the positive rates of TMs among GCs that correlated to the differences in tumor size, vascular embolism, wall invasion, nodal metastases and stage (Figures 2, 3, 4).
Table 2: Relationship between serum tumor markers and clinicopathological characteristics of the gastric cancer group n(%)
Cases(%) |
Positive cases (%) |
||||||
|---|---|---|---|---|---|---|---|
CEA |
P |
CA19-9 |
P |
CA72-4 |
P |
||
Sex |
|||||||
male |
1304(67) |
293(22.5) |
0.000 |
268(20.6) |
0.200 |
368(28.2) |
0.389 |
female |
641(33) |
97(15.1) |
148(23.1) |
169(26.4) |
|||
Age(yr) |
|||||||
< 60 |
1155(59.4) |
186(16.1) |
0.000 |
239 (20.7) |
0.366 |
308(26.6) |
0.261 |
≥ 60 |
790(40.6) |
204(25.8) |
177(22.4) |
229(29.0) |
|||
Tumor size(cm) |
|||||||
≤ 4 |
1026(52.8) |
164(16.0) |
0.001 |
187(18.2) |
0.001 |
241(23.5) |
0.000 |
4 – 10 |
719(37) |
176(24.5)a |
175(24.3)a |
230(32.0)a |
|||
≥ 10 |
200(10.3) |
50(25.0)a |
54(27.0)a |
66(33.0)a |
|||
Location |
|||||||
cardia |
472(24.3) |
121(25.6) |
0.005 |
114(24.2) |
0.112 |
137(29.0) |
0.167 |
gastric body |
391(20.1) |
75(19.2)b |
82(21) |
103(26.3) |
|||
gastric antrum |
970(49.9) |
176 (18.1)b |
190(19.6) |
257(26.5) |
|||
multi-site |
112(5.8) |
18(16.1)b |
30(26.8) |
40(35.7) |
|||
Differentiation |
|||||||
high /moderate |
376(19.3) |
108(28.7) |
0.000 |
81(21.5) |
0.211 |
102(27.1) |
0.034 |
poor |
1159(59.6) |
216(18.6)c |
232(20) |
300(25.9) |
|||
signet ring |
373(19.2) |
58(15.5)c |
96(25.7) |
127(34.0)c,d |
|||
other |
37(1.9) |
8(21.6) |
7(18.9) |
8(21.6) |
|||
Vascular embolism |
|||||||
present |
271(13.9) |
68(25.1) |
0.025 |
76(28.0) |
0.004 |
98(36.20) |
0.001 |
absent |
1674(86.1) |
322(19.2) |
340(20.3) |
439(26.2) |
|||
Wall invasion |
|||||||
T1 |
273(14) |
42(15.4) |
0.001 |
32(11.7) |
0.000 |
44(16.1) |
0.000 |
T2 |
209(10.7) |
31(14.8) |
27(12.9) |
43(20.6)e |
|||
T3 |
334(17.2) |
55(16.5) |
63(18.9)e |
89(26.6)e |
|||
T4a |
920(47.3) |
208(22.6)e |
235(25.5)e |
290(31.5)e |
|||
T4b |
209(10.7) |
54(25.8)e |
59(28.2)e |
71(34.0)e |
|||
Nodal metastases |
|||||||
N0 |
601(30.9) |
94(15.6) |
0.000 |
88(14.6) |
0.000 |
114(19) |
0.000 |
N1 |
322(16.6) |
50(15.5) |
80(24.8)f |
87(27)f |
|||
N2 |
350(18) |
91(26)f,g |
78(22.3)f |
107(30.6)f |
|||
N3 |
672(34.6) |
155(23.1)f,g |
170(25.3)f |
229(34.1)f,g |
|||
Metastases |
|||||||
M0 |
1719(88.4) |
338(19.7) |
0.238 |
349(20.3) |
0.001 |
455(26.5) |
0.002 |
M1 |
226(11.6) |
52(23.0) |
67 (29.6) |
82(36.3) |
|||
Stage |
|||||||
I |
351(18.0) |
51(14.5) |
0.003 |
43(12.3) |
0.000 |
55(15.7) |
0.000 |
II |
438(22.5) |
74(16.9) |
74(16.9) |
101(23.1)h |
|||
III |
931(47.8) |
214(22.9)h,i |
232(25.0)h,i |
299(32.1)h,i |
|||
IV |
225(11.6) |
51(22.7)h |
67(29.8)h,i |
82(36.4)h,i |
|||
aStatistically significant compared to ≤ 4 subgroup
bStatistically significant compared to cardia subgroup
cStatistically significant compared to high/moderate subgroup
dStatistically significant compared to poor subgroup
eStatistically significant compared to T1 subgroup
fStatistically significant compared to N0 subgroup
gStatistically significant compared to N1 subgroup
hStatistically significant compared to I subgroup
iStatistically significant compared to II subgroup
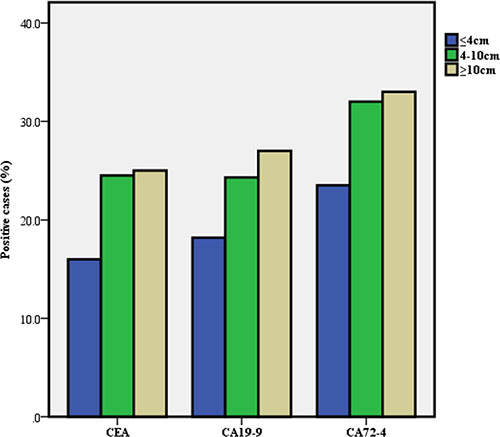
Figure 2: Positive rate of serum tumor markers in gastric cancer according to tumor size.
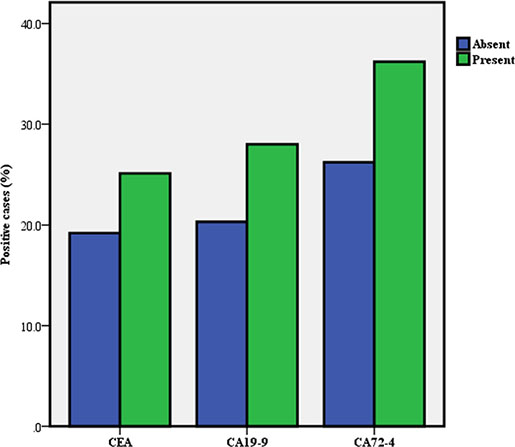
Figure 3: Positive rate of serum tumor markers in gastric cancer according to vascular embolism.
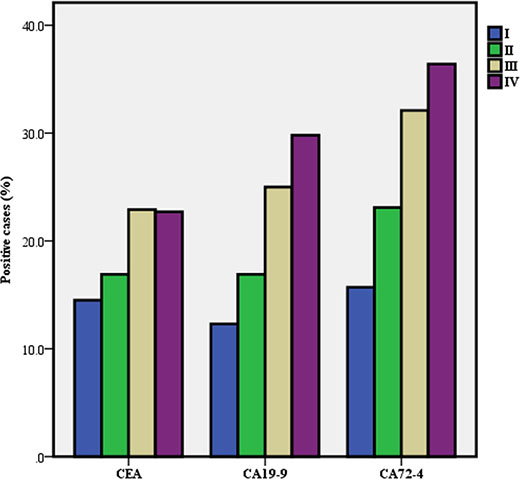
Figure 4. Positive rate of serum tumor markers in gastric cancer according to stage.
Stratified analysis showed that the positive rate of CEA in cardia-located GC was significantly higher than that of GC in other locations. Conversely, no difference was found among the location groups for CA19-9 and CA72-4. The differences in differentiation subgroups were significant for CEA and CA72-4 but not for CA19-9. Additionally, the positive rates of the three TMs increased with tumor stage, and statistically significant differences were found between stages III, IV and I for CEA and between stages III and IV and stages I and II for CA19-9 and CA72-4, respectively.
Use of normal or optimum cut-off values of serum TMs for the diagnosis of GC
We used the normal reference value of TMs as the cut-off value to determine the negative and positive GCs. The results showed that the use of a single serum TM had good specificity (85.1%–96.2%) but poor sensitivity (20.1%–27. 6%) for the diagnosis of GC. The sensitivity was improved to 48.2% with the combined use of serum TMs, but it remained unsatisfactory (Table 3).
Table 3: Use of normal cut-off values of serum tumor markers for gastric cancer diagnosis
CEA |
CA19-9 |
CA72-4 |
|||||
|---|---|---|---|---|---|---|---|
(ng/ml) |
(U/ml) |
(U/ml) |
CEA+CA199 |
CEA+CA724 |
CA724+CA199 |
Combination |
|
Normal boundary value |
≤ 5 |
≤ 27 |
≤ 5.3 |
||||
AUC(95%CI) |
0.712 |
0.585 |
0.722 |
0.634 |
0.609 |
0.609 |
0.632 |
0.695–0.729 |
0.566–0.603 |
0.704–0.740 |
0.616–0.652 |
0.591–0.628 |
0.591–0.628 |
0.614–0.650 |
|
Sensitivity(%) |
20.10 |
21.40 |
27.60 |
35.10 |
40.10 |
40.10 |
48.20 |
Specificity (%) |
94.70 |
96.20 |
85.10 |
91.80 |
81.70 |
81.70 |
78.20 |
PPV/NPV(%) |
82.3/49.2 |
87.4/50.0 |
69.5/49.0 |
83.9/53.6 |
72.9/52.7 |
72.9/52.7 |
73.1/55.2 |
PLR/NLR |
3.79/0.85 |
5.63/0.82 |
1.85/0.85 |
4.28/0.71 |
2.19/0.73 |
2.19/0.73 |
2.21/0.66 |
Acurancy (%) |
53.62 |
55.04 |
53.45 |
60.58 |
58.80 |
58.80 |
53.45 |
YI |
0.15 |
0.18 |
0.13 |
0.27 |
0.22 |
0.22 |
0.26 |
AUC = area under curve, CI = confidence interval, PPV = positive predictive value, NPV = negative predictive value, PLR = positive likelihood ratio, NLR = negative likelihood ratio, YI = Youden´s Index.
Because the low sensitivities with the use of normal cut-off values restrict their clinical application, we analyzed the AUC of the ROC curve to obtain the optimum diagnostic cut-off values of the serum TMs and then calculated their diagnostic capacities for GC (Table 4). The analysis showed that CA72-4 was the preferable single test, with a sensitivity value (93.83%) that was higher than that of CEA (72.20%) and much higher than that of CA19-9 (22.30%). In addition, the diagnostic specificity for the CA19-9 levels (95.9%) was higher than that of the other TMs. The use of optimum boundary values significantly improved the diagnostic efficiency of each single marker for GC, which remained lower than the combination (P < 0.05), according to the ROC curve (Figure 5).
Table 4: Use of optimal cut-off values of serum tumor markers for gastric cancer diagnosis
CEA |
CA19-9 |
CA72-4 |
|||||
|---|---|---|---|---|---|---|---|
(ng/ml) |
(U/ml) |
(U/ml) |
CEA+CA199 |
CEA+CA724 |
CA724+CA199 |
Combination |
|
Optimal boundary value |
≥ 1.93 |
≥ 26.18 |
≥ 1.84 |
||||
AUC(95%CI) |
0.712 |
0.585 |
0.722 |
0.657 |
0.725 |
0.725 |
0.735 |
0.695–0.729 |
0.566–0.603 |
0.704–0.740 |
0.639–0.675 |
0.707–0.742 |
0.707–0.742 |
0.718–0.752 |
|
Sensitivity(%) |
72.20 |
22.30 |
93.83 |
75.60 |
93.80 |
93.80 |
73.60 |
Specificity (%) |
57.00 |
95.90 |
51.10 |
55.80 |
51.10 |
51.10 |
76.00 |
PPV/NPV(%) |
67.3/62.7 |
86.9/50.2 |
70.1/87.1 |
67.7/65.1 |
70.1/87.1 |
70.1/87.1 |
83.7/63.2 |
PLR/NLR |
1.68/0.49 |
5.44/0.81 |
1.92/0.12 |
1.71/0.44 |
1.92/0.12 |
1.92/0.12 |
3.07/0.35 |
Acurancy (%) |
65.39 |
55.38 |
74.59 |
66.69 |
74.59 |
74.59 |
74.48 |
YI |
0.29 |
0.18 |
0.45 |
0.31 |
0.45 |
0.45 |
0.50 |
AUC = area under curve, CI = confidence interval, PPV = positive predictive value, NPV = negative predictive value, PLR = positive likelihood ratio, NLR = negative likelihood ratio, YI = Youden’s Index.
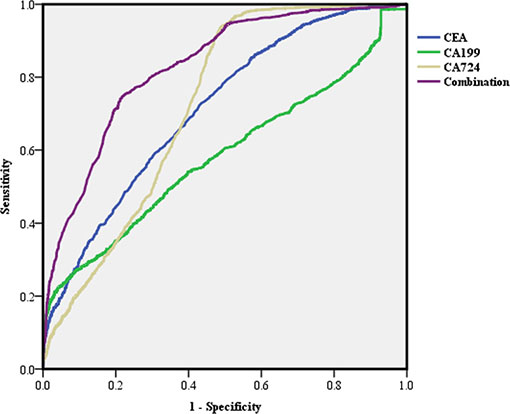
Figure 5: Receiver operating characteristic (ROC) curve of single and combined tumor markers with the optimum cut-off values in predicting gastric cancer (GC).
Establishment and validation of the criterion equation for GC diagnosis
To establish an accurate method for evaluating the possibility of GC by using serum TMs, we obtained a classification discriminant equation using the multivariate logistic regression analysis to ascertain whether patients have GC as follows: Y = –2.185–0.015X1+0.180X2+ 1.226X3+1.505X4+2.749X5 (where X1 = Age, X2 = Sex, X3 = CEA, X4 = CA19-9 and X5 = CA72-4), for which the critical value is 0.50, thus, if the Y of a case is larger than 0.50, it belongs to the GC group. The values for all parameters are shown in Table 5.
Table 5: The values for all parameters of the equation
Parameter |
Values |
|
|---|---|---|
X1 = Age |
Calculate by continuous variable |
|
X2 = Sex |
Female |
0 |
Male |
1 |
|
X3 = CEA |
< 1.93 ng/ml |
0 |
≥ 1.93 ng/ml |
1 |
|
X4 = CA19-9 |
< 26.18 U/ml |
0 |
≥ 26.18 U/ml |
1 |
|
X5 = CA72-4 |
< 1.84 U/ml |
0 |
≥ 1.84 U/ml |
1 |
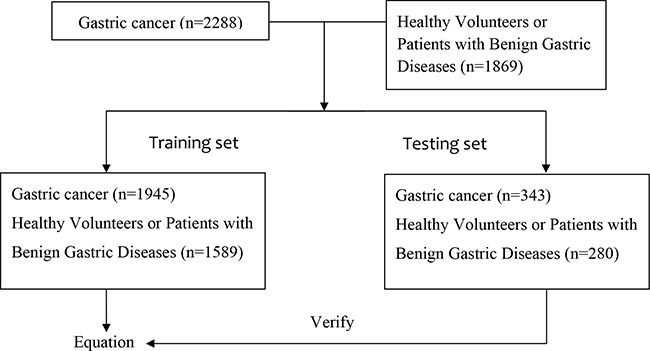
Then, we verified the discriminant equation model using the data of the testing set (343 GC patients and 280 healthy volunteers or patients with benign gastric diseases). There were 49 healthy cases mistaken for GC and 22 GC patients whose diagnoses were missed by the equation results(Table 6). The sensitivity, specificity, PPV and NPV were 93.59%, 82.5%, 86.76% and 91.3%, respectively. Youden’s index was 0.76, and the accuracy was 88.60, which was statistically higher than the combination of TMs described above (χ2 = 452.5, P < 0. 001).
Table 6: The discriminant value of testing set
Gold standard |
|||
|---|---|---|---|
Results of criterion equation |
Total |
+ |
– |
Positive |
321 |
49 |
370 |
Negative |
22 |
231 |
253 |
Total |
343 |
280 |
623 |
DISCUSSION
An estimated 951,600 new stomach cancer cases and 723,100 deaths occurred in 2012. [15] Early spread to metastatic sites is considered the main reason for the high death rate, and early diagnosis may improve the long-term survival rates and reduce the mortality from this disease. Therefore, it is necessary to develop a convenient diagnostic method for routine screening, which would increase the early diagnosis of GC. TMs have been widely used in the domain of cancer. However, each TM has its limitation in terms of diagnostic value, particularly for early diagnosis. [16] It is therefore necessary to identify new combination models of TMs.
In this study, we found that the serum levels and positive rates of CEA, CA19-9 and CA72-4 in the GC group were higher than those in the control group, which is consistent with a previous report, [17] and our data suggest that these markers have diagnostic value for GC.
Furthermore, the relationship between serum TMs and the clinicopathological features of GC was investigated. We found that the positive rates of CEA, CA19-9 and CA72-4 increased with tumor stage. This trend indicates that both the progression and burden of the tumor affect the TMs. These findings are consistent with earlier studies. [13, 18]
Then, we evaluated the diagnostic efficiency of TMs for GC. Regardless of whether we used the normal reference values or optimum boundary values of our markers as a cut-off value to assess the clinical specimens, we found that the sensitivity of all TMs was very low, whereas the combination of TMs could improve the sensitivity, though it remained unsatisfactory. These results are consistent with previous studies performed within the Chinese population. [19]
To obtain a better pattern to improve the accuracy of GC detection, we developed the discriminant equation according to a multivariate logistic regression analysis. The results from the testing set demonstrate that this equation could distinguish GC patients from healthy controls, and it has a better diagnostic power than the CEA+CA19-9+CA72-4 pattern. Using this equation to diagnose GC can achieve a higher sensitivity, specificity, and accuracy and can be practically applied in clinical practice.
Currently, the NCCN Clinical Practice Guideline in Gastric Cancer 2015 and ESMO Clinical Recommendations for Gastric Cancer 2014 have not discussed any tumor biomarkers or combined biomarkers for GC for early screening and diagnosis. [20, 21] We hope to provide a useful reference for the application of TMs for GC in the future.
In conclusion, TMs such as CEA, CA19-9, and CA72-4 show a correlation with the diagnosis of GC. The discriminant equation may be a useful tool for the prediction of GC.
MATERIALS AND METHODS
Study subjects
A total of 4157 subjects (2288 GC patients and 1869 healthy volunteers or patients with benign gastric diseases) visiting Sun Yat-sen University Cancer Center from January 2000 to May 2015 were enrolled in the study. From these patients, we simultaneously chose a group of subjects (343 and 280, respectively) as a testing set to verify the discriminant equation model. The remainder of the subjects comprised the training set including the GC group and control group (n = 1945 and n = 1589, respectively). In the GC group, there were 1304 males and 641 females, who ranged in age from 16 to 86 years, with an average age of 55.58 years. Among them, 1159 patients had poorly differentiated adenocarcinoma, 376 patients had moderately or highly differentiated adenocarcinoma, 970 patients had gastric antrum carcinoma, 391 patients had gastric body cancer, 472 patients had gastric cardia cancer, and 112 patients had multiple site cancer (more than two sites). In the control group, there were 1073 males and 516 females, with an age range of 5 to 83 years, and an average age of 45.99 years.
Patients with GC were diagnosed by endoscopy and confirmed by biopsy, and did not receive any preoperative treatment. The staging of cancer was based on a routine histopathological analysis and clinical assessment, according to the 7th AJCC (American Joint Committee on Cancer) Gastric Cancer TNM Staging System. [22]
Ethical considerations
The Medical Ethics Committee of Sun Yat-sen University Cancer Center approved this study. All subjects provided written informed consent to offer related information in the hospital.
Serum TM detection
Blood samples were collected prior to any therapy in GC patients and as part of a routine examination in control subjects. Serum CEA, CA19-9, CA72-4 levels were measured using Cobas 601 and reagent kits (Roche Diagnostics, Mannheim, Germany) at the clinical laboratory of the Sun Yat-sen University Cancer Center. The cut-off values of 5 ng/ml, 27 U/ml and 5.3 U/ml for CEA, CA19-9 and CA72-4, respectively, were used.
Statistical analysis
The χ2 test was used to analyze the statistical significance of categorical variables, and the T-test was used for continuous variables. The area under the curve (AUC) of the receiver operating characteristic (ROC) curve was used to evaluate the diagnostic value of serum TMs. The diagnosis discriminant equation for GC was established based on the multivariate logistic regression analysis. The differences were considered statistically significant when P < 0.05. All analyses were performed using SPSS version 20.0 (SPSS Inc., Chicago, IL, USA).
ACKNOWLEDGMENTS
None.
CONFLICTS OF INTEREST
None.
GRANT SUPPORT
Work on this article was supported in part by the National Natural Science Foundation of China (Grant Nos.81172080, 81201773, 81411130217), the Specialized Research Fund for the Doctoral Program of Higher Education of China (Grant No.20120171120114), the Science and Technology Projects of Guangdong Province (Grant No.2011B031800181, Grant No.201508030042) and the National High-Tech R&D Program (863 Program) (Grant No.2012AA02A504).
REFERENCES
1. Siegel R, Ma J, Zou Z, Jemal A. Cancer statistics, 2014. CA Cancer J Clin. 2014; 64:9–29.
2. Ferro A, Peleteiro B, Malvezzi M, Bosetti C, Bertuccio P, Levi F, Negri E, La Vecchia C, Lunet N. Worldwide trends in gastric cancer mortality (1980–2011), with predictions to 2015, and incidence by subtype. European journal of cancer. 2014; 50:1330–1344.
3. Chen W, Zheng R, Zhang S, Zhao P, Zeng H, Zou X, He J. Annual report on status of cancer in China, 2010. Chinese journal of cancer research. 2014; 26:48–58.
4. Chen W, Zheng R, Baade PD, Zhang S, Zeng H, Bray F, Jemal A, Yu XQ, He J. Cancer statistics in China, 2015. CA Cancer J Clin. 2016.
5. Ferlay J, Soerjomataram I, Dikshit R, Eser S, Mathers C, Rebelo M, Parkin DM, Forman D, Bray F. Cancer incidence and mortality worldwide: sources, methods and major patterns in GLOBOCAN 2012. International journal of cancer Journal international du cancer. 2015; 136:E359–386.
6. Hu Y, Fang JY, Xiao SD. Can the incidence of gastric cancer be reduced in the new century? Journal of digestive diseases. 2013; 14:11–15.
7. El Abiad R, Gerke H. Gastric cancer: endoscopic diagnosis and staging. Surgical oncology clinics of North America. 2012; 21:1–19.
8. Dan YY, So JB, Yeoh KG. Endoscopic screening for gastric cancer. Clinical gastroenterology and hepatology. 2006; 4:709–716.
9. Zhao YJ, Ju Q, Li GC. Tumor markers for hepatocellular carcinoma. Molecular and clinical oncology. 2013; 1:593–598.
10. Lech G, Slotwinski R, Krasnodebski IW. The role of tumor markers and biomarkers in colorectal cancer. Neoplasma. 2014; 61:1–8.
11. Wang Z, Tian YP. Clinical value of serum tumor markers CA19-9, CA125 and CA72-4 in the diagnosis of pancreatic carcinoma. Molecular and clinical oncology. 2014; 2:265–268.
12. Huang ZB, Zhou X, Xu J, Du YP, Zhu W, Wang J, Shu YQ, Liu P. Prognostic value of preoperative serum tumor markers in gastric cancer. World journal of clinical oncology. 2014; 5:170–176.
13. Jiexian J, Xiaoqin X, Lili D, Baoguo T, Ting S, Xianwen Z, Cunzhi H. Clinical assessment and prognostic evaluation of tumor markers in patients with gastric cancer. The International journal of biological markers. 2013; 28:192–200.
14. He B, Zhang HQ, Xiong SP, Lu S, Wan YY, Song RF. Changing patterns of Serum CEA and CA199 for Evaluating the Response to First-line Chemotherapy in Patients with Advanced Gastric Adenocarcinoma. Asian Pacific journal of cancer prevention. 2015; 16:3111–3116.
15. Torre LA, Bray F, Siegel RL, Ferlay J, Lortet-Tieulent J, Jemal A. Global cancer statistics, 2012. CA. 2015.
16. Jing JX, Wang Y, Xu XQ, Sun T, Tian BG, Du LL, Zhao XW, Han CZ. Tumor markers for diagnosis, monitoring of recurrence and prognosis in patients with upper gastrointestinal tract cancer. Asian Pacific journal of cancer prevention. 2014; 15:10267–10272.
17. Yang AP, Liu J, Lei HY, Zhang QW, Zhao L, Yang GH. CA72-4 combined with CEA, CA125 and CAl9-9 improves the sensitivity for the early diagnosis of gastric cancer. Clinica chimica acta. 2014; 437:183–186.
18. Shimada H, Noie T, Ohashi M, Oba K, Takahashi Y. Clinical significance of serum tumor markers for gastric cancer: a systematic review of literature by the Task Force of the Japanese Gastric Cancer Association. Gastric cancer. 2014; 17:26–33.
19. Chen XZ, Zhang WK, Yang K, Wang LL, Liu J, Wang L, Hu JK, Zhang B, Chen ZX, Chen JP, Zhou ZG, Mo XM. Correlation between serum CA724 and gastric cancer: multiple analyses based on Chinese population. Molecular biology reports. 2012; 39:9031–9039.
20. Network NCC. (2015). Clinical practice guidelines in oncology: gastric cancer.
21. Waddell T, Verheij M, Allum W, Cunningham D, Cervantes A, Arnold D, European Society for Medical O, European Society of Surgical O, European Society of R and Oncology. Gastric cancer: ESMO-ESSO-ESTRO clinical practice guidelines for diagnosis, treatment and follow-up. European journal of surgical oncology. 2014; 40:584–591.
22. Edge SB, Compton CC. The American Joint Committee on Cancer: the 7th edition of the AJCC cancer staging manual and the future of TNM. Annals of surgical oncology. 2010; 17:1471–1474.