
Introduction
Thyroid cancer is now recognized as a major public health issue worldwide because of its rapidly increased incidence [1-3]. However, apart from the only well-defined risk factors, such as ionizing radiation exposure especially in childhood [4], benign thyroid conditions [5] and obesity [6], it remains poorly understood on risk factors for thyroid cancer. Alcohol consumption, a highly modifiable behavior, has been acknowledged as a risk factor for cancers of stomach, colorectum, liver, breast and gallbladder [7-11]. However, inconsistent results have been reported on the association between alcohol consumption and thyroid cancer risk. Several epidemiological studies [12-14], including a pooled-analysis [15] of five cohort studies, have suggested an inverse association between alcohol consumption and thyroid cancer risk, while others [16-20], including a pooled-analysis [21] of ten case-control studies, haven’t confirmed this association. Recently, Bagnardi et al [11] published a meta-analysis on site-specific cancer risk and alcohol consumption which indicated that light/moderate alcohol intake may decrease the risk of thyroid cancer. However, the result is rough and they didn’t consider the potential influence of confounder factors. In addition, the result only based on nine individual studies and many other related studies were not included in their meta-analysis. Therefore, we updated a comprehensive meta-analysis to investigate the possible association of alcohol consumption and thyroid cancer risk.
Results
Study characteristics
The literature search strategy identified 154 potentially eligible reports. Finally, 24 studies met the inclusion criteria, including 7 cohort studies [12-14, 16, 17, 32, 33] and 17 case-control studies [18-20, 34-47] (Supplementary Figure S1). The detailed characteristics of these studies were shown in Table 1 and Table 2. Twelve studies were conducted in America, eight in Europe, and four in Asia. Eleven studies reported the overall estimates combined women and men, eight studies only for women; two studies [14, 40] reported respectively the estimates for women, men and the combined women and men. Three studies [18, 33, 38] only reported the estimates separately for different genders (women and men), we considered these reports as separate studies. Therefore, a total of 27 reports derived from 24 studies were included for the meta-analysis. A total of 9,990 cases with thyroid cancer were observed among all these studies. Eleven studies [12-14, 16, 18, 19, 33, 37, 39, 44, 45] reporting at least three categories of alcohol consumption were included into the dose-response analysis. The quality scores ranged from 5 to 9 with a median of 8 for methodological assessment (Supplementary Table S1).
Table 1: Characteristics of the case–control studies included in the meta-analysis
Study |
Country |
Period of enrolment |
Gender |
Tumor type |
No. of cases |
No. of controls |
Source of control |
Variables adjusted for in the regression models |
Bandurska 2011 [34] |
Europe |
1994-2003 |
WM |
TC |
297 |
589 |
Pop |
Matched on age and place of residence. |
Choi 2013 [35] |
Asia |
2010-2011 |
WM |
TC |
71 |
12141 |
Pop |
Age, occupation, household income, marital status, BMI, and smoking. |
Franceschi 1989 [36] |
Europe |
1984-1986 |
WM |
TC |
245 |
411 |
Hos |
Matched on age, sex and geographical area. |
Galanti 1997 [37] |
Europe |
1993-1994 |
WM |
DTC |
246 |
440 |
Pop |
Matched on age, gender, and county of residence. |
Guignard 2007 [18] |
Europe |
1993-1999 |
WM |
DTC |
332 |
412 |
Pop |
Age, ethnic group, and smoking. |
Kolonel 1990 [38] |
America |
1980-1987 |
WM |
DTC |
191 |
441 |
Pop |
Age, gender, ethnicity, education, marital status, smoking, height, weight, occupation, radiation exposure. |
Lence-Anta 2014 [39] |
America |
2000-2011 |
WM |
DTC |
203 |
212 |
Pop |
Age, gender, smoking status, ethnic group, education, number of pregnancies in women, height, and BMI. |
Mack 2002 [19] |
America |
1980-1983 |
W |
TC |
292 |
292 |
Pop |
Age, race, and prior benign thyroid disease. |
Menezes 2015 [20] |
America |
2000-2009 |
WM |
TC |
4023 |
24840 |
Hos |
Age, gender, race, education, marital status, smoking habits, region of residence, and year of diagnosis. |
Nagano 2007 [40] |
Asia |
1970-1986 |
WM |
DTC |
362 |
362 |
Pop |
Age, sex, city, and radiation dose, family history of cancer and past history of goiter or thyroid nodule, smoking. |
Prestonmartin 1987 [41] |
America |
1980-1981 |
W |
TC |
110 |
110 |
Pop |
Matched on age and place of residence. |
Riza 2015 [42] |
Europe |
1990-1993 |
WM |
TC |
113 |
138 |
Hos |
Matched on age, sex, health unit. |
Ron 1987 [43] |
America |
1978-1980 |
WM |
TC |
159 |
285 |
Pop |
Age, sex, prior radiotherapy to the head and neck, thyroid nodules, and goiter. |
Rossing 2000 [44] |
America |
1988-1994 |
W |
PTC |
410 |
574 |
Pop |
Matched on age and county of residence |
Stansifer 2015 [45] |
America |
WM |
TC |
467 |
225 |
Pop |
None |
|
Takezaki 1996 [46] |
Asia |
1988-1993 |
W |
DTC |
94 |
22666 |
Hos |
Age and year of visit. |
Xhaard 2014 [47] |
Europe |
1981-2003 |
WM |
DTC |
229 |
373 |
Pop |
Age, height, BMI, number of pregnancies and menopausal status in women, familial history of thyroid cancer, educational level, medical or therapeutic irradiation of the neck |
Abbreviation: W, Women; WM, Women + Men; TC, thyroid cancer; DTC, differentiated thyroid cancer; PTC, papillary thyroid cancer; Pop, population-based; Hos, hospital-based; BMI, body mass index.
Table 2: Characteristics of the cohort studies included in the meta-analysis.
Author and year of publication |
Country and name of the cohort |
Period of enrolment |
Gender |
Tumor type |
No. of cases |
No. of participates |
Duration of follow-up (years) |
Variables adjusted for in the regression models |
Sungwalee 2013 [32] |
Asia, KKCS |
1994-2003 |
W |
TC |
17 |
10750 |
Range: 10-21 |
Age, occupation, household income, marital status, BMI, smoking. |
Sen 2015 [12] |
Europe, EPIC |
1990 |
WM |
DTC |
556 |
477263 |
Mean 11 |
Smoking, education, BMI, physical activity, diabetes, hormone replacement therapy, oral contraceptives, age at menarche, number of full-term pregnancies and menopausal status. |
Navarro 2005 [17] |
America, NBSS |
1992 |
W |
DTC |
169 |
89547 |
Mean 15.9 |
Age, education, BMI and smoking. |
Meinhold 2009 [14] |
America, NIH-AARP |
1980 |
WM |
TC |
370 |
490159 |
Median 7.5 |
Age, sex, race, education, smoking status, BMI, and family history of cancer. |
Kabat 2012 [16] |
America, WHI |
1995 |
W |
TC |
331 |
159009 |
Median 12.7 |
Age, education, smoking, age at first full-term pregnancy, age at menopause, hormone therapy , height (continuous), history of benign thyroid disease. |
Allen 2009 [13] |
Europe, MWS |
1993 |
W |
TC |
421 |
1280296 |
Mean 7.2 |
Age, region of residence, socioeconomic status, BMI, smoking, physical activity, use of oral contraceptives, and hormone replacement therapy. |
Meinhold 2010 [33] |
America, USRT |
1983-1984 |
WM |
TC |
282 |
90713 |
Range: 11-23 |
Age, smoking status, BMI, number of personal radiographs to the head or neck, cumulative occupational radiation dose, and medical history of benign thyroid conditions. |
Abbreviation: W, Women; WM, Women + Men; TC, thyroid cancer; DTC, differentiated thyroid cancer; BMI, body mass index.
Cohort: KKCS, the Khon Kaen Cohort Study; EPIC, the European Prospective Investigation into Cancer and Nutrition; NBSS, Canadian National Breast Screening Study; NIH-AARP, the National Institutes of Health-American Association of Retired Persons Diet and Health Study; WHI, the Women’s Health Initiative; MWS, the Million Women Study; USRT, the U.S. Radiologic Technologists Study
Meta-analysis results
Figure 1 shows study-specific and the RR and 95%CI of thyroid cancer risk for alcohol drinking (drinkers versus nondrinkers). The pooled RR, based on overall studies, was 0.80 (95% CI 0.71-0.90). The corresponding estimates were 0.87 (95%CI: 0.78-0.96) for cohort studies and 0.75 (95%CI: 0.63-0.89) for case-control studies. Satisfactory homogeneity was found among cohort studies (I2 = 0%, P = 0.809). However, there were significant heterogeneity among case-control studies (I2 = 72.6%, P < 0.01).
Figure 2 shows the forest plots of thyroid cancer for light and moderate drinking. Compared to nondrinkers, the pooled estimates were 0.81 (95% CI 0.70-0.93) for light based on nine studies (P for heterogeneity = 0.006) and 0.71 (95% CI 0.63-0.79) for moderate drinkers based on ten studies (P for heterogeneity = 0.948).
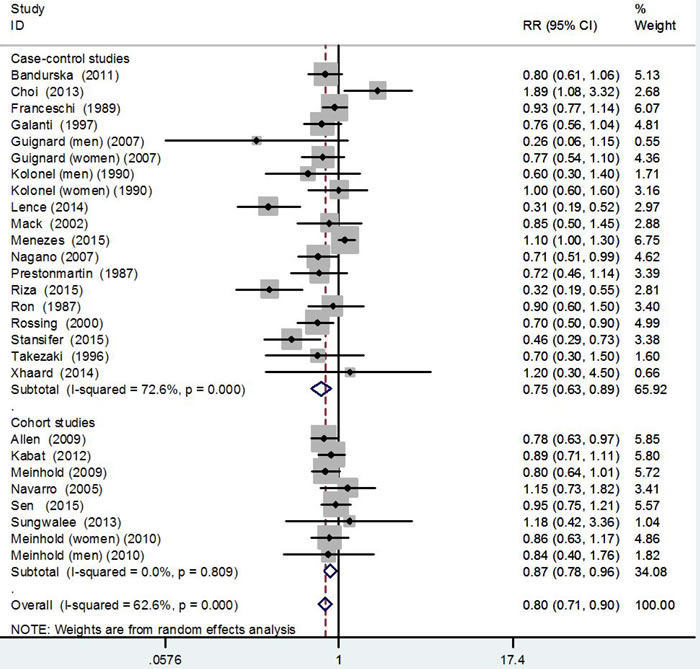
Figure 1: Pooled risk estimates of alcohol drinking for thyroid cancer risk (drinkers versus nondrinkers).
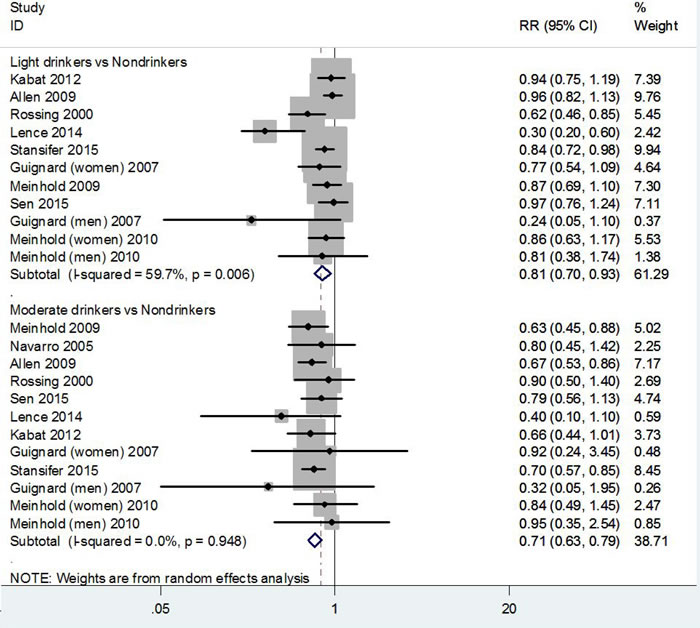
Figure 2: Pooled risk estimates of alcohol drinking for thyroid cancer risk (light or moderate drinkers versus nondrinkers).
Table 3 presents the results of subgroup analyses regarding the association between alcohol consumption and thyroid cancer risk. Because the number of studies that provided data on category of alcohol consumption was small, we only made a subgroup analysis on comparison between any drinkers and nondrinkers. In term of gender, thirteen studies reported combined data for women and men, with a pooled RR of 0.77 (95% CI 0.64-0.94; P for heterogeneity < 0.01). Thirteen studies reported data for women, with a pooled RR of 0.81 (95% CI 0.74-0.89; P for heterogeneity = 0.886), while only five studies reported data for men, with a pooled RR of 0.77 (95% CI 0.58-1.02; P for heterogeneity = 0.599). Considering the geographical area, the pooled RR for thyroid cancer risk was 0.77 (95%CI: 0.65-0.92) in European studies, 0.79 (95%CI: 0.67-0.93) in American studies and 1.01 (95%CI: 0.58-1.75) in Asian studies. Most studies provided multivariate-adjusted results. The adjusted and unadjusted RRs were 0.82 (95%CI: 0.72-0.93) and 0.73 (95%CI: 0.57-0.95) for thyroid cancer risk. Significant heterogeneity was found within the geographical area and whether adjusted for multivariate subgroups (all the P-values were < 0.05).
Table 3: Pooled RRs of thyroid cancer risk and alcohol consumption (drinkers versus nondrinkers), in strata of selected covariates.
No. of studies/reports |
RR (95% CI) |
P for heterogeneity within subgroup |
P for heterogeneity between subgroup |
|
Overall |
24/27 |
0.80 (0.71, 0.90) |
||
Gender a |
0.256 |
|||
Women and Men |
13 |
0.77 (0.64, 0.94) |
0.000 |
|
Women |
13 |
0.81 (0.74, 0.89) |
0.886 |
|
Men |
5 |
0.77 (0.58, 1.02) |
0.599 |
|
Study design |
0.937 |
|||
Cohort |
7/8 |
0.87 (0.78, 0.96) |
0.809 |
|
Case-control |
17/19 |
0.75 (0.63, 0.89) |
0.000 |
|
Control source b |
0.000 |
|||
Population based |
13/15 |
0.74 (0.62, 0.88) |
0.005 |
|
Hospital based |
4 |
0.76 (0.52, 1.11) |
0.000 |
|
Geographic area |
0.411 |
|||
America |
12/14 |
0.79 (0.67, 0.93) |
0.000 |
|
Europe |
8/9 |
0.77 (0.65, 0.92) |
0.021 |
|
Asia |
4 |
1.01 (0.58, 1.75) |
0.026 |
|
Publication year |
0.447 |
|||
≥ 2005 |
15/16 |
0.79 (0.67, 0.93) |
0.000 |
|
< 2005 |
8/9 |
0.83 (0.73, 0.94) |
0.771 |
|
No. of cases |
0.758 |
|||
≥ 200 |
16/16 |
0.80 (0.71, 0.90) |
0.000 |
|
< 200 |
10/11 |
0.81 (0.60, 1.11) |
0.003 |
|
Tumor subtype |
0.081 |
|||
TC |
14/15 |
0.83 (0.72, 0.96) |
0.000 |
|
DTC |
9/11 |
0.75 (0.61, 0.93) |
0.016 |
|
PTC |
1 |
0.70 (0.50, 0.90) |
-- |
|
Quality score |
0.014 |
|||
High (NOS≥ 7) |
18/21 |
0.80 (0.71, 0.91) |
0.007 |
|
Low (NOS< 7) |
6 |
0.78 (0.61, 1.01) |
0.000 |
|
Adjusted for multivariate |
0.217 |
|||
Yes |
18/21 |
0.82 (0.72, 0.93) |
0.000 |
|
No |
6 |
0.73 (0.57, 0.95) |
0.013 |
a The sum of studies exceeds 24 because five studies reported results for both men and women, separately.
b Among case–control studies only.
RR, relative risk; CI, confidence interval; TC, thyroid cancer; DTC, differentiated thyroid cancer; PTC, papillary thyroid cancer; NOS, Newcastle-Ottawa Scale.
Table 3 also shows significant heterogeneity in subgroup analyses between strata of control source for case-control study, tumor subtype, and NOS quality score (all P < 0.10), which may be partly sources of heterogeneity for overall results. However, all of these factors didn’t have statistically significant association with the sources of heterogeneity in univariate or multivariate meta-regression analysis (all P > 0.10, data not shown). Supplemental Figure S2 shows the results of sensitivity analysis by excluding each study at a time. No study had a significant influence on the overall estimates. The pooled RRs for any drinking varied from 0.78 (when excluding Choi et al [35]) to 0.83(when excluding Lence-Anta et al [39]). The shape of the contour-enhanced funnel plot of studies on the association between alcohol drinking and thyroid cancer risk seemed to be symmetrical, and all the P value of Begg’s test were more than 0.05, indicating the absence of publication bias (Supplemental Figure S3).
As shown in Figure 3, the dose-response analysis suggested that there is no evidence of a dose-response relationship between alcohol intaking and thyroid cancer risk (P = 0.112). There is no linear relationship for thyroid cancer with every 12.5 g/d alcohol increase (RR = 0.84, 95% CI 0.67-1.04).
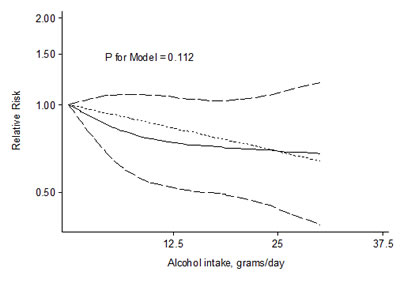
Figure 3: Relative risks (RRs) and the corresponding 95% confidence intervals (CIs) for the dose-response relationship between alcohol drinking (grams per day) and thyroid cancer risk. The solid line and the long dash line represent the estimated RRs and their 95% CIs. Short dash line represents the linear relationship.
Discussion
In this systematic review, we quantitatively summarized all the available epidemiological evidence on the association between alcohol consumption and thyroid cancer risk and found that any drinking, in relation to nondrinkers, was associated with a 20%, light drinking (≤12.5 g/day of ethanol) with a 19%, and moderate drinking ( > 12.5 g/day of ethanol) with a 29% reduced risk for thyroid cancer in present study. However, the association of heavy drinking ( > 50 g/day of ethanol) and thyroid cancer risk was unclear due to the lack of quantitative data provided from original studies. The dose-response analysis didn’t show a significant dose-response association between alcohol drinking and thyroid cancer risk, but the dose-risk curve, as shown in Figure 3, suggested a reduced trend with increasing alcohol intake in drinkers. This discrepancy between the dose-response analysis and meta-analysis for light and moderate drinkers might be explained by the different methods used and by the different studies included.
In subgroup analyses, we found any drinking, compared with nondrinkers, was associated with a higher pooled risk estimates in cohort studies than that of case-control studies (RR: 0.87 versus 0.75). However, among case-control studies, the evidence for an inverse association between alcohol consumption and thyroid cancer risk was limited to the population-based studies. Hospital-based case-control studies did not show a statistical significant association. This may be explained by a higher risk of inappropriate control selection, less control for confounding by smoking or other confounders in hospital-based studies as compared with population-based studies (as shown in Table1).
Subgroup analysis indicated that the association of alcohol consumption and thyroid cancer risk appeared to be consistent between women and men for any drinkers versus nondrinkers. However, we found a stronger association in men compared to women, although there was not statistical difference in terms of men. Possible explanations for these findings might be the higher and more popular alcohol intake in men than women and the limited number of studies reporting data on alcohol intake among men. Of course, the potential differences in alcohol metabolism in women and men maybe have some influence on thyroid cancer risk.
A significant risk difference for thyroid cancer was observed in different geographic areas. The beneficial effect of alcohol intaking on thyroid cancer was found in European (RR = 0.77, 95%CI: 0.65-0.92) and American studies (RR = 0.79, 95%CI: 0.67-0.93), but not in Asian studies (RR = 1.01, 95%CI: 0.58-1.75). This might be due to the different alcohol beverages, different lifestyles and the difference of functional variants in gene involved in alcohol metabolism, such as single nucleotide polymorphisms in ADH1B and ALDH2, among various ethnic groups [48]. The gene polymorphisms involved in alcohol metabolism have been related to the risk of selected cancers [49-51]. However, there is lack of data on their role on thyroid cancer.
Smoking has been suggested as a protective factor for thyroid cancer by several studies [52, 53], which is positively correlated with alcohol drinking. An earlier pooled analysis of ten case-control studies found that there was a significant trend of decreasing thyroid cancer risk for consumption of wine and beer, but that was not maintained after adjustment for smoking [21]. Moreover, thyroid cancer risk was found to be increased among subjects with benign thyroid diseases [5] and obesity [6]. The included studies varied in adjustment for potential confounders. It is impossible to include only articles that adjusted for the same factors. Thus, whenever available, we used multivariate adjusted RRs. The results of adjusted and unadjusted RRs were consistent across strata of whether adjusted for multivariate, which indicated that the inverse association of alcohol consumption and thyroid cancer risk still existed after multivariate adjustment.
There are several potential explanations for the effect of alcohol intake on decreased risk of thyroid cancer. First, light-to-moderate alcohol consumption is associated with enhanced insulin sensitivity and reduced type 2 diabetes [54-56]. Diabetes or obesity has been recognized as a risk for increased thyroid cancer [6, 57, 58]. Second, alcohol intake is associated with reduced prevalence of goitre and solitary thyroid nodules [59], which are important risk factors for thyroid cancer [5]. Some studies have found that alcohol intake have an effect on thyroid volume, thyroid function and the responsiveness of hypothalamic-pituitary-thyroid axis [60-62], which subsequently lead to the change of peripheral thyroid hormone concentrations. However, the influence is elusive with regarding to the peripheral thyroid hormone concentrations on thyroid cancer risk [63-65]. Third, alcohol could also potentially influence thyroid cancer risk by altering sex steroid hormone levels [66-68].
There are some potential limitations to our study. First, marked heterogeneity was detected in several analyses which may reflect differences in study design, study population and adjustment for confounders. Nevertheless, the random-effects models were used to take heterogeneity into account. Meanwhile, subgroup analysis, sensitivity analysis and meta-regression analysis were used to explore the potential heterogeneity in our meta-analysis. Second, former drinkers and sick quitters might have been misclassified into the reference group in some individual studies and thus a decreased effect has been estimated. We could not address this issue because the majority of the studies did not report separate estimates between former drinkers and lifelong never drinkers. Third, most studies (13/24) collected information by self-reporting questionnaires, which might lead to information bias. However, several studies have found satisfactory correlation coefficients for validity and reproducibility of self-reported alcohol drinking in various populations [69].
Notwithstanding the limitations discussed above, this meta-analysis includes the most comprehensive information with a large sample size on alcohol consumption and thyroid cancer risk to date, and confirms an inverse association of alcohol consumption for thyroid cancer risk. Further studies are needed to better understand the potential mechanisms underlying this association.
materials and Methods
Search strategy and inclusion criteria
We identified all relevant case-control and cohort studies published in English by searching the two databases (PubMed and EMbase) from the beginning of indexing to August 2015, using the following terms: (alcohol OR ethanol) AND (thyroid tumor OR thyroid cancer OR thyroid carcinoma OR thyroid neoplasm) AND (cohort OR prospective OR case-control), following the Meta-analysis Of Observational Studies in Epidemiology (MOOSE) guidelines [22]. Two authors (XF Wang and WL Cheng) independently assessed and identified potentially relevant articles, and reviewed the references list in the articles and associative reviews to identify additional studies. The inclusion criteria were as follows: (1) cohort study or case-control study published as original articles; (2) evaluated the association of alcohol consumption and thyroid cancer incidence in general population; (3) provided the relative risk (RR)/odds ratio (OR)/hazard ratio (HR) and the corresponding 95% confidence interval (CI) or sufficient information to enable calculation. Abstracts or unpublished reports were not considered for inclusion in the meta-analysis.
Data extraction and quality assessment
Two authors (Wang XF and WL Cheng) independently extracted data from each original article using a pretested form. The extracted data were composed of first author, year of publication, country, gender, study design, period of enrollment and source of controls (case-control studies), follow-up time (cohort studies), sample size (numbers of cases, controls or non-cases or cohort size), variables adjusted for estimates, risk estimates (Ors, RRs or HRs) for alcohol consumption levels and the corresponding 95% CIs. All risk estimates results were expressed as RRs. The ORs and HRs approximate to the RRs because of the low incidence of thyroid cancer in general population.
Two authors (Wang XF and Li JD) independently assessed the quality of included studies according to the Newcastle-Ottawa Scale (NOS) [23]. The NOS includes three broad perspectives: selection (four items), comparability (two items) and exposure/outcome (three items). The full score was 9 points, and the study with awarded points ≥7 was defined as a high quality study. Disagreements were discussed and resolved with consensus.
Statistical analyses
The expression of alcohol intake was various in different studies; therefore, we used grams of ethanol per day as a standard measure and defined one drink as 12.5 g of ethanol, 1 ml of alcohol as 0.8 g and 1 ounce as 28 g. Nondrinkers drinkers were defined as the reference category. Since the highest category of alcohol exposure was set at > 1 drinks/day in the majority of studies, thus we divided the alcohol drinker into two levels: light drinker defined as ≤1 drink/day (≤12.5 g/day of ethanol) and moderate as >1 drinks/day (>12.5 g/day of ethanol). When a study provided a series of categories of alcohol consumption, we used the midpoint of each category as the corresponding exposure dose. For the upper open-ended category, the exposure dose was calculated as 1.2 times its lower bound [24]. When the estimates for drinkers versus nondrinkers was not presented in a study, we combined the corresponding risk estimates associated with different alcohol exposure categories using the method proposed by Hamling et al [25] when possible. Similar methods were adopted for light and moderate drinker when more than one exposure categories fell in one of these levels. When a study didn’t used nondrinkers as a reference category, the RRs and 95% CI were recalculated using the nondrinkers as reference by the method proposed by Orsini et al [26].
The multivariate-adjusted RRs were used for the meta-analyses; when they are unavailable, the unadjusted RRs were calculated from original data. The pooled RRs with 95% CIs were calculated by random effects models [27] for the association between drinkers and nondrinkers. Heterogeneity among articles was quantitatively assessed using the Q test and I2 statistic [28]. A significant heterogeneity was defined as the I2 more than 50% or Q-test reporting a P value < 0.1. To explore the potential sources of heterogeneity among studies, we conducted meta-regression analysis and subgroup analyses in strata of gender, study design, control source for case-control study, geographic area, publication year, number of cases, tumor subtype, NOS quality score and whether adjusted for multivariate. Sensitivity analyses were also performed by excluding each study at a time to clarify the influence of each study on the overall estimates. Publication bias was assessed by Begg’s rank correlation test [29] and the contour-enhanced funnel plot [30].
A potential nonlinear dose-response relationship between alcohol consumption and thyroid cancer risk were conducted based on the natural logarithm of the RR for each study with at least three quantitative categories of exposure using the methods described by Orisini [31]. The P value for nonlinearity was calculated by testing the null hypothesis that the coefficient of the second spline was equal to zero.
A P value less than 0.05 was considered to be statistically significant. All P values were two-tailed. All calculations were performed using Stata 11.0 (Stata Corporation, College Station, TX).
Conflicts of interest
There is no conflict of interest.
References
1. Davies L and Welch HG. Increasing incidence of thyroid cancer in the United States, 1973-2002. Jama. 2006; 295:2164-2167.
2. Pandeya N, McLeod DS, Balasubramaniam K, Baade PD, Youl PH, Bain CJ, Allison R and Jordan SJ. Increasing thyroid cancer incidence in Queensland, Australia 1982-2008 - true increase or overdiagnosis? Clinical endocrinology. 2015.
3. Vigneri R, Malandrino P and Vigneri P. The changing epidemiology of thyroid cancer: why is incidence increasing? Current opinion in oncology. 2015; 27:1-7.
4. Tronko MD, Howe GR, Bogdanova TI, Bouville AC, Epstein OV, Brill AB, Likhtarev IA, Fink DJ, Markov VV, Greenebaum E, Olijnyk VA, Masnyk IJ, Shpak VM, et al. A cohort study of thyroid cancer and other thyroid diseases after the chornobyl accident: thyroid cancer in Ukraine detected during first screening. Journal of the National Cancer Institute. 2006; 98:897-903.
5. Balasubramaniam S, Ron E, Gridley G, Schneider AB and Brenner AV. Association between benign thyroid and endocrine disorders and subsequent risk of thyroid cancer among 4.5 million U.S. male veterans. The Journal of clinical endocrinology and metabolism. 2012; 97:2661-2669.
6. Schmid D, Ricci C, Behrens G and Leitzmann MF. Adiposity and risk of thyroid cancer: a systematic review and meta-analysis. Obesity reviews. 2015;16:1042-54.
7. Tramacere I, Negri E, Pelucchi C, Bagnardi V, Rota M, Scotti L, Islami F, Corrao G, La Vecchia C and Boffetta P. A meta-analysis on alcohol drinking and gastric cancer risk. Annals of oncology. 2012; 23:28-36.
8. Wang Y, Duan H, Yang H and Lin J. A pooled analysis of alcohol intake and colorectal cancer. International journal of clinical and experimental medicine. 2015; 8:6878-6889.
9. Turati F, Galeone C, Rota M, Pelucchi C, Negri E, Bagnardi V, Corrao G, Boffetta P and La Vecchia C. Alcohol and liver cancer: a systematic review and meta-analysis of prospective studies. Annals of oncology. 2014; 25:1526-1535.
10. Jayasekara H, MacInnis RJ, Room R and English DR. Long-Term Alcohol Consumption and Breast, Upper Aero-Digestive Tract and Colorectal Cancer Risk: A Systematic Review and Meta-Analysis. Alcohol and alcoholism. 2015.
11. Bagnardi V, Rota M, Botteri E, Tramacere I, Islami F, Fedirko V, Scotti L, Jenab M, Turati F, Pasquali E, Pelucchi C, Galeone C, Bellocco R, et al. Alcohol consumption and site-specific cancer risk: a comprehensive dose-response meta-analysis. Brit J Cancer. 2015; 112:580-593.
12. Sen A, Tsilidis KK, Allen NE, Rinaldi S, Appleby PN, Almquist M, Schmidt JA, Dahm CC, Overvad K, Tjonneland A, Rostgaard-Hansen AL, Clavel-Chapelon F, Baglietto L, et al. Baseline and lifetime alcohol consumption and risk of differentiated thyroid carcinoma in the EPIC study. Br J Cancer. 2015; 113:840-847.
13. Allen NE, Beral V, Casabonne D, Kan SW, Reeves GK, Brown A, Green J and Million Women Study C. Moderate alcohol intake and cancer incidence in women. Journal of the National Cancer Institute. 2009; 101:296-305.
14. Meinhold CL, Park Y, Stolzenberg-Solomon RZ, Hollenbeck AR, Schatzkin A and de Gonzalez AB. Alcohol intake and risk of thyroid cancer in the NIH-AARP Diet and Health Study. Brit J Cancer. 2009; 101:1630-1634.
15. Kitahara CM, Linet MS, Freeman LEB, Check DP, Church TR, Park Y, Purdue MP, Schairer C and de Gonzalez AB. Cigarette smoking, alcohol intake, and thyroid cancer risk: a pooled analysis of five prospective studies in the United States. Cancer Cause Control. 2012; 23:1615-1624.
16. Kabat GC, Kim MY, Wactawski-Wende J and Rohan TE. Smoking and alcohol consumption in relation to risk of thyroid cancer in postmenopausal women. Cancer Epidemiol. 2012; 36:335-340.
17. Navarro Silvera SA, Miller AB and Rohan TE. Risk factors for thyroid cancer: a prospective cohort study. International journal of cancer. 2005; 116:433-438.
18. Guignard R, Truong T, Rougier Y, Baron-Dubourdieu D and Guenel P. Alcohol drinking, tobacco smoking, and anthropometric characteristics as risk factors for thyroid cancer: a countrywide case-control study in New Caledonia. American journal of epidemiology. 2007; 166:1140-1149.
19. Mack WJ, Preston-Martin S, Bernstein L and Qian D. Lifestyle and other risk factors for thyroid cancer in Los Angeles County females. Annals of epidemiology. 2002; 12:395-401.
20. Menezes RF, Bergmann A, Aguiar SS and Thuler LC. Alcohol consumption and the risk of cancer in Brazil: A study involving 203,506 cancer patients. Alcohol. 2015.
21. Mack WJ, Preston-Martin S, Dal Maso L, Galanti R, Xiang M, Franceschi S, Hallquist A, Jin F, Kolonel L, La Vecchia C, Levi F, Linos A, Lund E, et al. A pooled analysis of case-control studies of thyroid cancer: cigarette smoking and consumption of alcohol, coffee, and tea. Cancer Cause Control. 2003; 14:773-785.
22. Stroup DF, Berlin JA, Morton SC, Olkin I, Williamson GD, Rennie D, Moher D, Becker BJ, Sipe TA and Thacker SB. Meta-analysis of observational studies in epidemiology: a proposal for reporting. Meta-analysis Of Observational Studies in Epidemiology (MOOSE) group. Jama. 2000; 283:2008-2012.
23. Stang A. Critical evaluation of the Newcastle-Ottawa scale for the assessment of the quality of nonrandomized studies in meta-analyses. European journal of epidemiology. 2010; 25:603-605.
24. Berlin JA, Longnecker MP and Greenland S. Meta-analysis of epidemiologic dose-response data. Epidemiology. 1993; 4:218-228.
25. Hamling J, Lee P, Weitkunat R and Ambuhl M. Facilitating meta-analyses by deriving relative effect and precision estimates for alternative comparisons from a set of estimates presented by exposure level or disease category. Statistics in medicine. 2008; 27:954-970.
26. Orsini N. From floated to conventional confidence intervals for the relative risks based on published dose-response data. Computer methods and programs in biomedicine. 2010; 98:90-93.
27. DerSimonian R and Laird N. Meta-analysis in clinical trials. Controlled clinical trials. 1986; 7:177-188.
28. Higgins JP and Thompson SG. Quantifying heterogeneity in a meta-analysis. Statistics in medicine. 2002; 21:1539-1558.
29. Begg CB and Mazumdar M. Operating characteristics of a rank correlation test for publication bias. Biometrics. 1994; 50:1088-1101.
30. Peters JL, Sutton AJ, Jones DR, Abrams KR and Rushton L. Contour-enhanced meta-analysis funnel plots help distinguish publication bias from other causes of asymmetry. Journal of clinical epidemiology. 2008; 61:991-996.
31. Orsini N, Li R, Wolk A, Khudyakov P and Spiegelman D. Meta-analysis for linear and nonlinear dose-response relations: examples, an evaluation of approximations, and software. American journal of epidemiology. 2012; 175:66-73.
32. Sungwalee W, Vatanasapt P, Kamsa-Ard S, Suwanrungruang K and Promthet S. Reproductive risk factors for thyroid cancer: a prospective cohort study in Khon Kaen, Thailand. Asian Pacific journal of cancer prevention. 2013; 14:5153-5155.
33. Meinhold CL, Ron E, Schonfeld SJ, Alexander BH, Freedman DM, Linet MS and de Gonzalez AB. Nonradiation Risk Factors for Thyroid Cancer in the US Radiologic Technologists Study. Am J Epidemiol. 2010; 171:242-252.
34. Bandurska-Stankiewicz E, Aksamit-Bialoszewska E, Rutkowska J, Stankiewicz A and Shafie D. The effect of nutritional habits and addictions on the incidence of thyroid carcinoma in the Olsztyn province of Poland. Endokrynologia Polska. 2011; 62:145-150.
35. Choi SW, Ryu SY, Han MA and Park J. The Association Between the Socioeconomic Status and Thyroid Cancer Prevalence; Based on the Korean National Health and Nutrition Examination Survey 2010-2011. J Korean Med Sci. 2013; 28:1734-1740.
36. Franceschi S, Fassina A, Talamini R, Mazzolini A, Vianello S, Bidoli E, Serraino D and La Vecchia C. Risk factors for thyroid cancer in northern Italy. International journal of epidemiology. 1989; 18:578-584.
37. Galanti MR, Hansson L, Bergstrom R, Wolk A, Hjartaker A, Lund E, Grimelius L and Ekbom A. Diet and the risk of papillary and follicular thyroid carcinoma: a population-based case-control study in Sweden and Norway. Cancer causes & control. 1997; 8:205-214.
38. Kolonel LN, Hankin JH, Wilkens LR, Fukunaga FH and Hinds MW. An Epidemiologic-Study of Thyroid-Cancer in Hawaii. Cancer Cause Control. 1990; 1:223-234.
39. Lence-Anta JJ, Xhaard C, Ortiz RM, Kassim H, Pereda CM, Turcios S, Velasco M, Chappe M, Infante I, Bustillo M, Garcia A, Clero E, Maillard S, Salazar S, Rodriguez R and de Vathaire F. Environmental, lifestyle, and anthropometric risk factors for differentiated thyroid cancer in cuba: a case-control study. European thyroid journal. 2014; 3:189-196.
40. Nagano J, Mabuchi K, Yoshimoto Y, Hayashi Y, Tsuda N, Land C and Kodama K. A case-control study in Hiroshima and Nagasaki examining non-radiation risk factors for thyroid cancer. Journal of epidemiology / Japan Epidemiological Association. 2007; 17:76-85.
41. Prestonmartin S, Bernstein L, Pike MC, Maldonado AA and Henderson BE. Thyroid-Cancer among Young-Women Related to Prior Thyroid-Disease and Pregnancy History. Brit J Cancer. 1987; 55:191-195.
42. Riza E, Linos A, Petralias A, de Martinis L, Duntas L and Linos D. The effect of Greek herbal tea consumption on thyroid cancer: a case-control study. European journal of public health. 2015.
43. Ron E, Kleinerman RA, Boice JD, Livolsi VA, Flannery JT and Fraumeni JF. A Population-Based Case Control Study of Thyroid-Cancer. J Natl Cancer Inst. 1987; 79:1-12.
44. Rossing MA, Cushing KL, Voigt LF, Wicklund KG and Daling JR. Risk of papillary thyroid cancer in women in relation to smoking and alcohol consumption. Epidemiology. 2000; 11:49-54.
45. Stansifer KJ, Guynan JF, Wachal BM and Smith RB. Modifiable risk factors and thyroid cancer. Otolaryngology—head and neck surgery. 2015; 152:432-437.
46. Takezaki T, Hirose K, Inoue M, Hamajima N, Kuroishi T, Nakamura S, Koshikawa T, Matsuura H and Tajima K. Risk factors of thyroid cancer among women in Tokai, Japan. Journal of epidemiology / Japan Epidemiological Association. 1996; 6:140-147.
47. Xhaard C, Ren Y, Clero E, Maillard S, Brindel P, Rachedi F, Boissin JL, Sebbag J, Shan L, Bost-Bezeaud F, Petitdidier P, Drozdovitch V, Doyon F, Rubino C and de Vathaire F. Differentiated thyroid carcinoma risk factors in French Polynesia. Asian Pacific journal of cancer prevention. 2014; 15:2675-2680.
48. Brennan P, Lewis S, Hashibe M, Bell DA, Boffetta P, Bouchardy C, Caporaso N, Chen C, Coutelle C, Diehl SR, Hayes RB, Olshan AF, Schwartz SM, et al. Pooled analysis of alcohol dehydrogenase genotypes and head and neck cancer: a HuGE review. American journal of epidemiology. 2004; 159:1-16.
49. Yang H, Zhou Y, Zhou Z, Liu J, Yuan X, Matsuo K, Takezaki T, Tajima K and Cao J. A novel polymorphism rs1329149 of CYP2E1 and a known polymorphism rs671 of ALDH2 of alcohol metabolizing enzymes are associated with colorectal cancer in a southwestern Chinese population. Cancer epidemiology, biomarkers & prevention. 2009; 18:2522-2527.
50. Wu M, Chang SC, Kampman E, Yang J, Wang XS, Gu XP, Han RQ, Liu AM, Wallar G, Zhou JY, Kok FJ, Zhao JK and Zhang ZF. Single nucleotide polymorphisms of ADH1B, ADH1C and ALDH2 genes and esophageal cancer: a population-based case-control study in China. International journal of cancer. 2013; 132:1868-1877.
51. Druesne-Pecollo N, Tehard B, Mallet Y, Gerber M, Norat T, Hercberg S and Latino-Martel P. Alcohol and genetic polymorphisms: effect on risk of alcohol-related cancer. The Lancet Oncology. 2009; 10:173-180.
52. Galanti MR, Hansson L, Lund E, Bergstrom R, Grimelius L, Stalsberg H, Carlsen E, Baron JA, Persson I and Ekbom A. Reproductive history and cigarette smoking as risk factors for thyroid cancer in women: a population-based case-control study. Cancer epidemiology, biomarkers & prevention. 1996; 5:425-431.
53. Moura MA, Bergmann A, Aguiar SS and Thuler LC. The magnitude of the association between smoking and the risk of developing cancer in Brazil: a multicenter study. BMJ open. 2014; 4:e003736.
54. Baliunas DO, Taylor BJ, Irving H, Roerecke M, Patra J, Mohapatra S and Rehm J. Alcohol as a Risk Factor for Type 2 Diabetes A systematic review and meta-analysis. Diabetes Care. 2009; 32:2123-2132.
55. Davies MJ, Baer DJ, Judd JT, Brown ED, Campbell WS and Taylor PR. Effects of moderate alcohol intake on fasting insulin and glucose concentrations and insulin sensitivity in postmenopausal women: a randomized controlled trial. Jama. 2002; 287:2559-2562.
56. Bell RA, Mayer-Davis EJ, Martin MA, D’Agostino RB, Jr. and Haffner SM. Associations between alcohol consumption and insulin sensitivity and cardiovascular disease risk factors: the Insulin Resistance and Atherosclerosis Study. Diabetes Care. 2000; 23:1630-1636.
57. Schmid D, Behrens G, Jochem C, Keimling M and Leitzmann M. Physical activity, diabetes, and risk of thyroid cancer: a systematic review and meta-analysis. European journal of epidemiology. 2013; 28:945-958.
58. Yeo Y, Ma SH, Hwang Y, Horn-Ross PL, Hsing A, Lee KE, Park YJ, Park DJ, Yoo KY and Park SK. Diabetes mellitus and risk of thyroid cancer: a meta-analysis. PloS one. 2014; 9:e98135.
59. Knudsen N, Bulow I, Laurberg P, Perrild H, Ovesen L and Jorgensen T. Alcohol consumption is associated with reduced prevalence of goitre and solitary thyroid nodules. Clinical endocrinology. 2001; 55:41-46.
60. Hegedus L, Rasmussen N, Ravn V, Kastrup J, Krogsgaard K and Aldershvile J. Independent effects of liver disease and chronic alcoholism on thyroid function and size: the possibility of a toxic effect of alcohol on the thyroid gland. Metabolism: clinical and experimental. 1988; 37:229-233.
61. Valeix P, Faure P, Bertrais S, Vergnaud AC, Dauchet L and Hercberg S. Effects of light to moderate alcohol consumption on thyroid volume and thyroid function. Clinical endocrinology. 2008; 68:988-995.
62. Zoeller RT, Fletcher DL, Simonyl A and Rudeen PK. Chronic ethanol treatment reduces the responsiveness of the hypothalamic-pituitary-thyroid axis to central stimulation. Alcoholism, clinical and experimental research. 1996; 20:954-960.
63. Haymart MR, Repplinger DJ, Leverson GE, Elson DF, Sippel RS, Jaume JC and Chen H. Higher serum thyroid stimulating hormone level in thyroid nodule patients is associated with greater risks of differentiated thyroid cancer and advanced tumor stage. J Clin Endocr Metab. 2008; 93:809-814.
64. McLeod DSA, Watters KF, Carpenter AD, Ladenson PW, Cooper DS and Ding EL. Thyrotropin and Thyroid Cancer Diagnosis: A Systematic Review and Dose-Response Meta-Analysis. J Clin Endocr Metab. 2012; 97:2682-2692.
65. Rinaldi S, Plummer M, Biessy C, Tsilidis KK, Ostergaard JN, Overvad K, Tjonneland A, Halkjaer J, Boutron-Ruault MC, Clavel-Chapelon F, Dossus L, Kaaks R, Lukanova A, et al. Thyroid-stimulating hormone, thyroglobulin, and thyroid hormones and risk of differentiated thyroid carcinoma: the EPIC study. Journal of the National Cancer Institute. 2014; 106:dju097.
66. Shiels MS, Rohrmann S, Menke A, Selvin E, Crespo CJ, Rifai N, Dobs A, Feinleib M, Guallar E and Platz EA. Association of cigarette smoking, alcohol consumption, and physical activity with sex steroid hormone levels in US men. Cancer causes & control : CCC. 2009; 20:877-886.
67. Hirko KA, Spiegelman D, Willett WC, Hankinson SE and Eliassen AH. Alcohol consumption in relation to plasma sex hormones, prolactin, and sex hormone-binding globulin in premenopausal women. Cancer epidemiology, biomarkers & prevention. 2014; 23:2943-2953.
68. Chen GG, Vlantis AC, Zeng Q and van Hasselt CA. Regulation of cell growth by estrogen signaling and potential targets in thyroid cancer. Curr Cancer Drug Tar. 2008; 8:367-377.
69. Ferraroni M, Decarli A, Franceschi S, La Vecchia C, Enard L, Negri E, Parpinel M and Salvini S. Validity and reproducibility of alcohol consumption in Italy. International journal of epidemiology. 1996; 25:775-782.