
INTRODUCTION
Generally, ovarian cancer is accepted as the lethal gynecological malignancy and ranks first in causes of gynecological deaths [1, 2]. The five-year survival rate hovers around 25% ~ 30% and the majority of ovarian cancer patients are diagnosed at advanced stages [3]. Although the substantial advances have been made in cancer therapy, the mortality has remained virtually unchanged over the past 2 decades [4]. Furthermore, tumor recurrence and metastasis are considered as the major reasons for poor clinical outcome and cancer deaths [5]. Therefore, making a thoroughly investigation into the mechanisms of tumor invasion and metastasis may facilitate exploring potential molecular target for ovarian cancer gene therapy.
EFEMP1 (epidermal growth factor–containing fibulin-like extracellular matrix protein 1, fibulin-3) belongs to a multifunctional extracellular matrix protein fibulin family and is critical in maintaining the integrity of the basement membrane and the stability of extracellular matrix (ECM) structure [6–8]. Previous researches have showed that EFEMP1 was correlated with the tumorigenicity of a variety of carcinomas. Song et al. reported the overexpression of EFEMP1 promoted cell proliferation, invasion and adhesion in cervical cancer, which also correlated to the microvascular density and the expression of VEGF [9]. Additionally, compatible results were obtained in the researches of pancreatic adenocarcinoma and glioma [10, 11]. In contrast to the above studies, reports on breast cancer, nasopharyngeal carcinoma and pleomorphic gliomas revealed that EFEMP1 was decreased, and inhibited tumor invasion and metastasis [12–14]. Overall, the function of EFEMP1 in ovarian cancer had not been well illustrated yet.
In previous studies, we found that EFEMP1 expression was increased in ovarian carcinoma compared to normal ovarian tissue, and its overexpression was significantly associated with high stage, low differentiation, lymph node metastasis and poor prognosis of ovarian cancer. EFEMP1 expression was also found over-expressed in the highly invasive subclones compared with the low invasive subclones [15]. Therefore, our intent for this study is to make further investigation of the functional mechanism of EFEMP1 in ovarian cancer cell invasion and metastasis in vitro, as well as in vivo.
RESULTS
Differentially expressed genes in highly and low invasive subclones
Microarray analysis was performed to identify the differential gene expressions between the highly invasive subclone and the low invasive subclone, which were suitable for comparative analysis because of similar genetic backgrounds. The results revealed 1596 differentially expressed genes of 1.5 fold change and P-values ≤ 0.05 (Figure 1A and Supplementary Table S1). Among these genes, compared to the low invasive subclone, EFEMP1 was markedly increased in the highly invasive subclone (11.74 fold, P = 0.003). Quantitative real-time PCR and Western blot results confirmed the overexpression of EFEMP1 in the highly invasive subclone (Figure 1B, 1C). In western blot, the average band intensity of EFEMP1 normalized to GAPDH in the highly invasive subclone was 0.85 ± 0.13, much higher than that in the low invasive subclone (0.16 ± 0.04, P < 0.05).
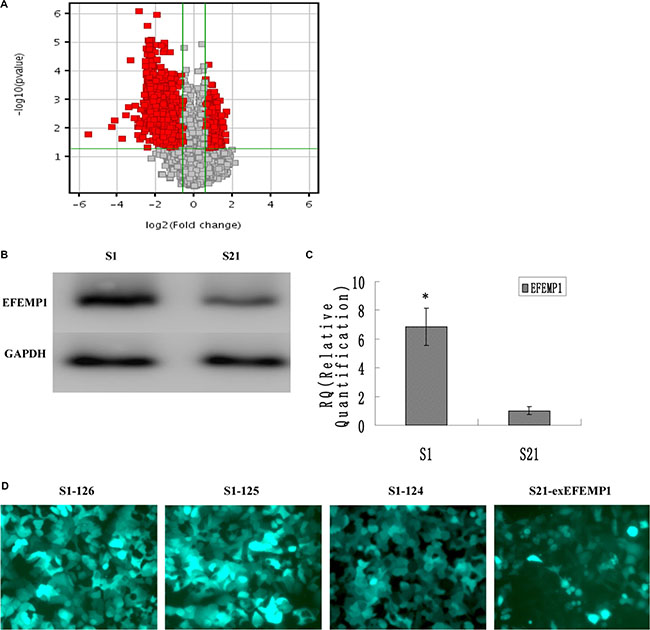
Figure 1: EFEMP1 expression in the highly invasive subclone and the low invasive subclone. (A) Scatter plot showing fold-change values versus P-values for differential gene expression between the highly invasive subclones and the low invasive subclones. The vertical lines correspond to 1.5-fold up and down, respectively, and the horizontal line represents a p-value of 0.05. The red point in the plot represents the differentially expressed genes with statistical significance. (B, C) EFEMP1 expression as measured by Western blot (B) and q-RT-PCR (C). (D) The fluorescence images of EFEMP1-GFP (Magnification × 200). *P < 0.05 versus control.
Identification of the efficiencies of EFEMP1 overexpression and knockdown
To further investigate the potential role of EFEMP1 in ovarian cancer, we decreased EFEMP1 expression in highly invasive subclone S1, while increased EFEMP1 expression in low invasive subclone S21. After viral infection, more than 80% cells were GFP-positive (Figure 1D), indicating a high efficiency of lentivirus transfection. Real-time q-RT-PCR, Western blot and ICC confirmed the down-regulation and up-regulation of EFEMP1 expressions at both mRNA and protein levels, as shown in Figure 2. In western blot, the average band intensities of S1 and S1-NC normalized to GAPDH in the highly invasive subclone were separately 0.96 ± 0.18 and 0.93 ± 0.19, much higher than that in the EFEMP1 shRNA infected cells S1–126, S1–125 and S1–124 (0.13 ± 0.05, 0.18 ± 0.07 and 0.28 ± 0.06, P < 0.05). Otherwise, in the low invasive subclone, the average band intensities of S21 and S21-NC normalized to GAPDH were separately 0.19 ± 0.09 and 0.17 ± 0.08, much lower than that in the pLVX- EFEMP1- Puro infected cells S21-exEFEMP1 (0.68 ± 0.13, P < 0.05).
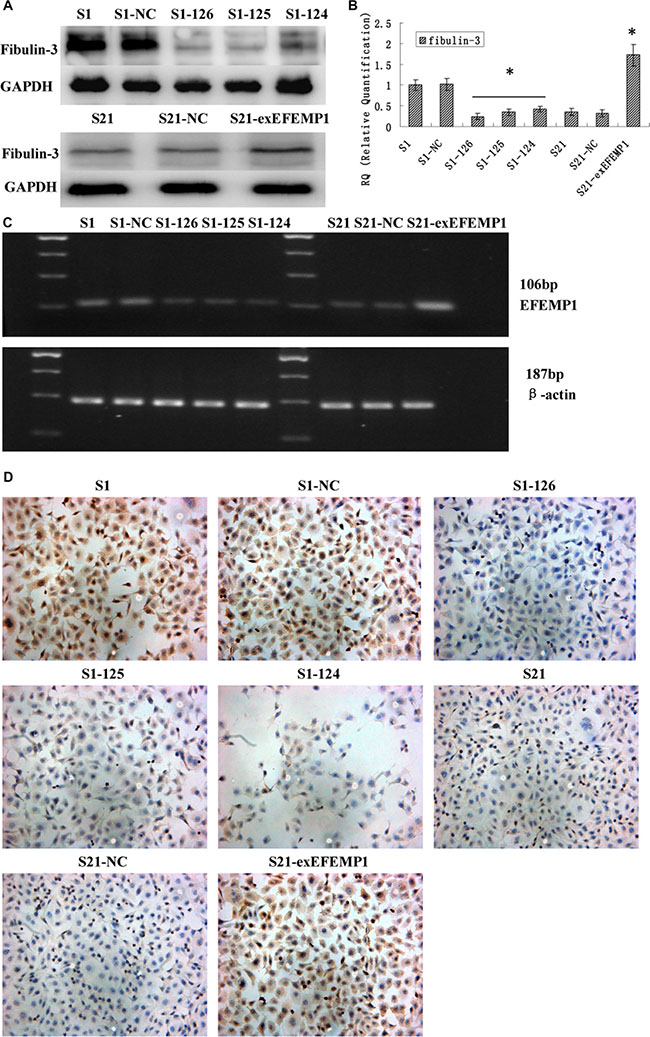
Figure 2: Identification of the efficiencies of EFEMP1 overexpression and knockdown after transfection (S1 and S21: non-infected control, S1-NC and S21-NC: infected with control-shRNA, S1-124: infected with EFEMP1-shRNA 124, S1-125: infected with EFEMP1-shRNA 125, S1-126: infected with EFEMP1-shRNA 126, and S21-exEFEMP1: infected with pLVX- EFEMP1-Puro vector). (A) EFEMP1 protein expression in lentivirus-infected cells as measured by Western blot. (B) EFEMP1 mRNA expression in lentivirus-infected cells as measured by q-RT-PCR. (C) PCR products as measured by agarose gel electrophoresis. (D) EFEMP1 protein expression in lentivirus-infected cells as measured by ICC staining (Magnification × 200). *P < 0.05 versus control.
Effects of EFEMP1 on ovarian cancer cell proliferation
Growth curves revealed that knockdown of EFEMP1 markedly inhibited cell proliferation of the highly invasive subclone (Figure 3A); on the other hand, S21-exEFEMP1 cells with the overexpressed EFEMP1 grew faster than non-infected cells (Figure 3B). In soft agar colony formation assay, the results were consistent with the above. Colony forming efficiency of EFEMP1-silencing cells was decreased, while the exogenous expression of EFEMP1 increased the colony forming capacity of low invasive subclone (Figure 3C, 3D). No significant difference was found in non-infective cells and negative control cells. Due to the heterogeneity of tumor cell, the growth and proliferation abilities of individual cells were relatively different; As a result, the size of the colonies in different groups was quite distinct. The average diameter of colony was also measured, which showed that there was no significant difference between the transfection group and the non-transfection group.
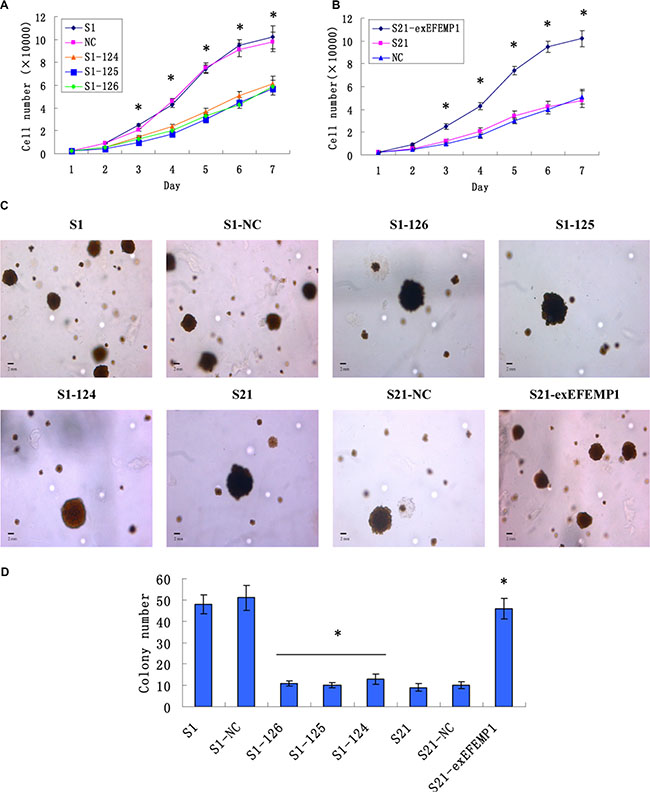
Figure 3: Effects of EFEMP1 on cell growth and cell colony formation. (A) Knockdown of EFEMP1 inhibited cell proliferation of the highly invasive subclone. (B) Overexpression of EFEMP1 promoted cell proliferation of the low invasive subclone. (C) The colony images of lentivirus-infected cells as examined by soft agar colony formation assay. (D) EFEMP1 knockdown decreased the colony forming capacity of highly invasive subclone, while overexpression of EFEMP1 increased the colony forming capacity of low invasive subclone. *P < 0.05 versus control.
Effects of EFEMP1 on ovarian cancer cell cycle
Cells infected with EFEMP1 shRNA were exhibited a substantial proportion of cells arrested in the G0/G1 phase compared with negative control, resulting in the sharply decline of cell numbers in S phase. Conversely, the overexpression of EFEMP1 induced a significant decrease in G0/G1 phase and an increase in S phases (Figure 4). These data consistently revealed that silencing EFEMP1 suppressed the proliferation of ovarian cancer cells by blocking their progression from the G1/G0 phase to S phase, while EFEMP1 overexpression promoted cell proliferation by increasing the proportion of cells in proliferate phase (S phase). In other words, EFEMP1 might be an important positive regulator of ovarian cancer cell proliferation. The possible effects on cell cycle-related proteins (such as Cyclin A, Cyclin B, Cyclin D and Cyclin E) during transfection were also considered. Western blot results showed the expressions of Cyclin A (sc-751, Santa Cruz Biotechnology, Inc.), Cyclin B1 (#4138, Cell Signaling Technology, Inc.), Cyclin D1 (#2922, Cell Signaling Technology, Inc.) and Cyclin E (sc-481, Santa Cruz Biotechnology, Inc.) were notably decreased during RNA interference and increased during overexpression transfection (Figure 4C). The average band intensities of Cyclin A, Cyclin B1, Cyclin D1 and Cyclin E normalized to GAPDH in non-infective cells S1 and negative control cells S1-NC of the highly invasive subclones were much higher than that in the EFEMP1 shRNA infected cells S1-126, S1-125 and S1-124. However, in the low invasive subclone, the average band intensities of Cyclin A, Cyclin B1, Cyclin D1 and Cyclin E normalized to GAPDH in non-infective cells S21 and negative control cells S21-NC were much lower than that in the pLVX- EFEMP1- Puro infected cells S21-exEFEMP1 (Figure 4D). Therefore, it was confirmed that EFEMP1 could significantly activate cell cycle regulator proteins and promote cell proliferation in ovarian cancer.
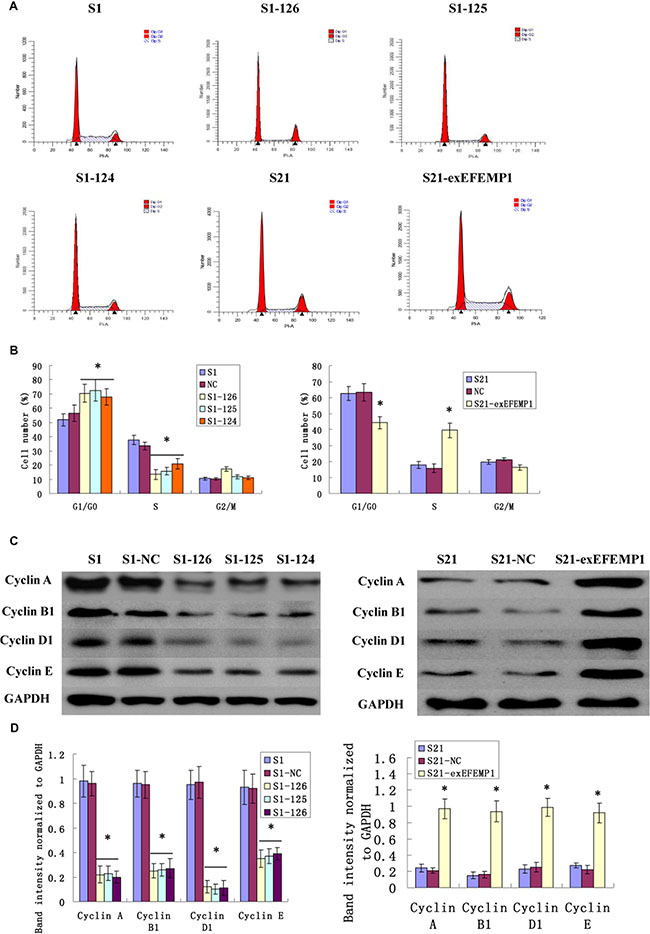
Figure 4: Effects of EFEMP1 on cell cycle. (A) Cell cycle analysis as measured by flow cytometry in lentivirus-infected cells. (B) EFEMP1 knockdown suppressed cell by blocking their progression from the G1/G0 phase to S phase, while EFEMP1 overexpression promoted cell proliferation by increasing the S phase cells. (C) Cell cycle-related proteins Cyclin A, Cyclin B1, Cyclin D1 and Cyclin E in lentivirus-infected cells as measured by Western blot. (D) The average band intensities of Cyclin A, Cyclin B1, Cyclin D1 and Cyclin E normalized to GAPDH. *P < 0.05 versus control.
Effects of EFEMP1 on ovarian cancer cells migration and invasion
As shown in Figure 5, the knockdown of EFEMP1 inhibited the invasion and migration of ovarian cancer cells. The average invading or migrating cell count of EFEMP1 shRNA infected cells was much less than that of negative control and non-infected cells. On the other hand, EFEMP1 overexpression promoted ovarian cancer cells invasion and migration. There was significantly more average invading or migrating cell count in S21-exEFEMP1 group, compared to negative control and non-infected groups. No significant difference was found between negative control cells and non-infected cells.
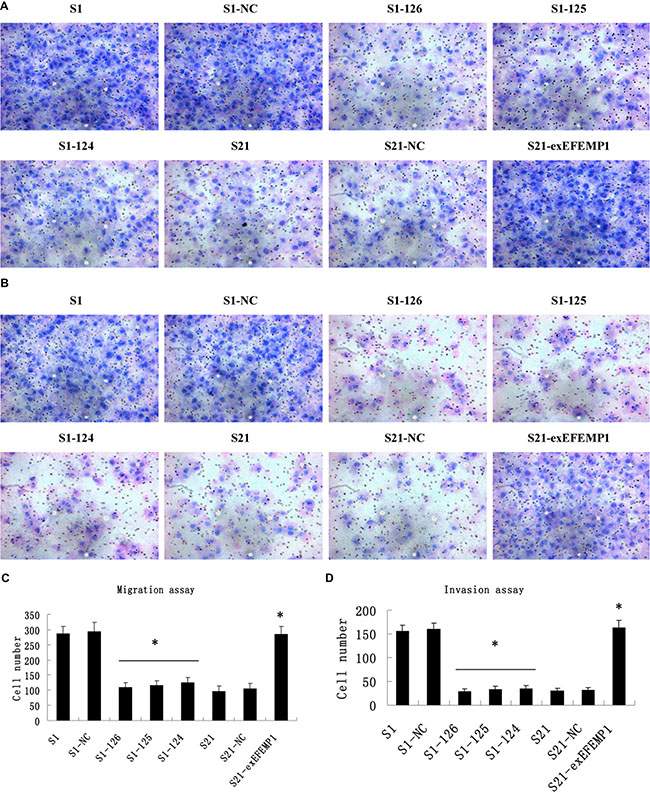
Figure 5: Effects of EFEMP1 on cell migration and invasion. (A) Cell migration images of lentivirus-infected cells as measured by Boyden chambers without Matrigel. (Magnification × 200). (B) Cell invasion images of lentivirus-infected cells by Boyden chambers coated with Matrigel. (Magnification × 200). (C) EFEMP1 knockdown suppressed cell migrating abilities, while EFEMP1 overexpression promoted cell migrating abilities. (D) EFEMP1 knockdown suppressed cell invading abilities, while EFEMP1 overexpression promoted cell invading abilities. *P < 0.05 versus control.
Effects of EFEMP1 on tumor growth in a xenograft model
To further evaluate the possible function of EFEMP1 in the regulation of tumor growth in vivo, we established a xenograft model. S1, S21 and S21-exEFEMP1 were each inoculated subcutaneously and through the tail veins in 5 nude mice respectively, and S1–124, S1–125 and S1–126 were inoculated subcutaneously and through the tail veins in 3 nude mice respectively. The tumor formation rate of highly invasive subclone was as high as 100%, with larger tumor size and rapid growth speed. Meanwhile, there was only 60% tumor formation rate in the EFEMP1-knockdown group, with small size and low growth speed. EFEMP1-knockdown group revealed evident delay in tumor formation and growth. Accordingly, the average tumor size of the nude mice inoculated subcutaneously with S21-exEFEMP1 was larger than that of low invasive subclone group, which had only 80% rate of tumor formation (Figure 6). Collectively, EFEMP1 could promote tumor formation and growth in vivo. By immunohistochemistry, the tumor xenografts formed by the high invasive subclones consisted of more EFEMP1 positive tumor tissues, compared to that formed by the EFEMP1 shRNA infected cells (S1–124,S1–125,S1–126), and the S21-exEFEMP1 infected group also has more EFEMP1 positive tumor tissues than the low invasive subclone group (Figure 7A). The EFEMP1-knochdown groups and the low invasive subclone group had no lung metastasis, however, the lung metastasis rates of S1 and S21-exEFEMP1 groups were 100% and 80%, respectively (Figure 7B). In conclusion, EFEMP1 can be a promising booster for ovarian cancer invasive potential.
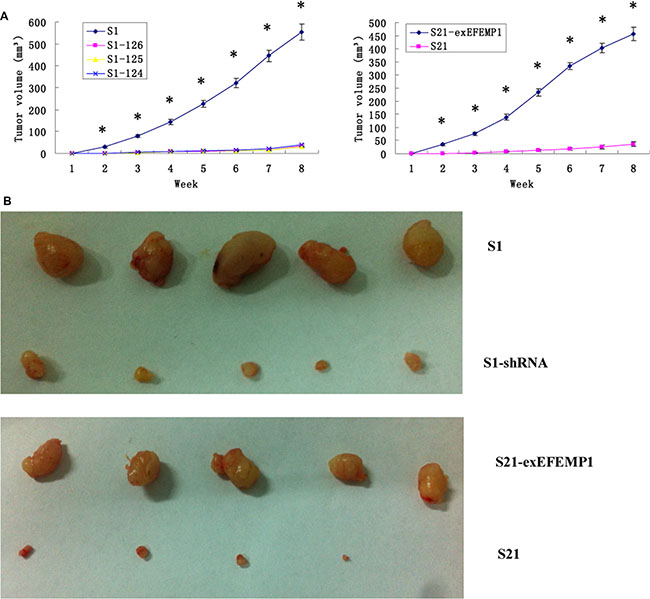
Figure 6: Effects of EFEMP1 on tumor growth. (A) Tumor growths of lentivirus-infected cells observed continuously for 8 weeks. (B) Photograph of xenografts dissected from nude mice after subcutaneous inoculation. *P < 0.05 versus control.
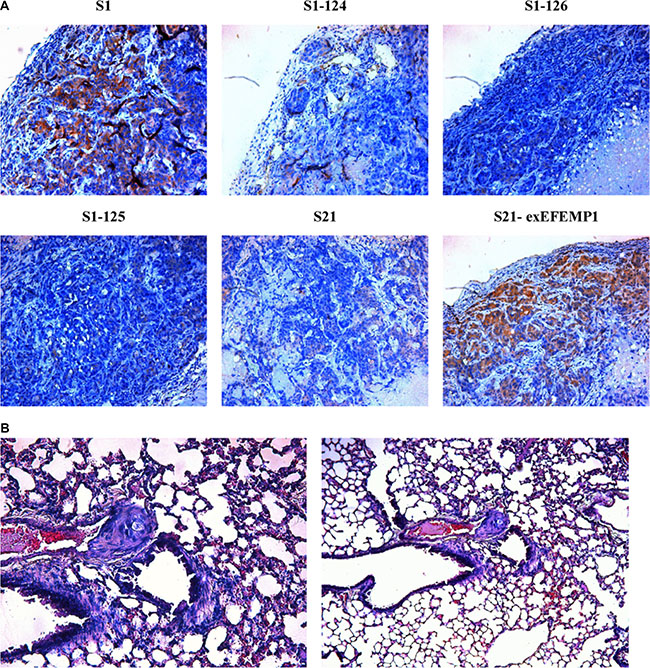
Figure 7: Effects of EFEMP1 on metastasis in nude mice. (A) Immunohistochemistry were performed on subcutaneous transplantation tumor of lentivirus-infected cells. (B) H&E staining were performed on lung metastasis after inoculation through tail vein. (Magnification × 200 and × 100).
Effects of EFEMP1 on the PI3K/AKT pathway
We studied three signaling pathways (PI3K/AKT, p38, and ERK) using pharmacological pathway inhibitors. EFEMP1 high expressed cells (S1 and the S21-exEFEMP1) were serum-starved and treated with DMSO and the indicated inhibitors, SB202190 (10 μM, 20 μM, 50 μM, p38 inhibitor), PD98059 (10 μM, 20 μM, 50 μM, ERK inhibitor), and LY294002 (10 μM, 20 μM, 50 μM, PI3K/AKT inhibitor), for 24 h. Then, migration and invasion assays were performed. Cell migration and invasion abilities were strongly decreased by incubation with LY294002, but not with SB202190 and PD98059 (Figure 8A). There were no significant differences among the groups of 10 μM, 20 μM and 50 μM, and no dose-dependent pattern was observed. LY294002 significantly reduced the level of AKT-Ser473 phosphorylation and had no effect on the expression of EFEMP1, compared with DMSO control (Figure 8B, 8C). AKT phosphorylation was more diminished in EFEMP1 shRNA infected cells compared with S1 control cells, however in S21-exEFEMP1 infected group, AKT phosphorylation was more increased, compared with S21 control cells (Figure 8D–8F). The results above indicated that EFEMP1 influenced cell migration and invasion involved the PI3K/AKT pathway.
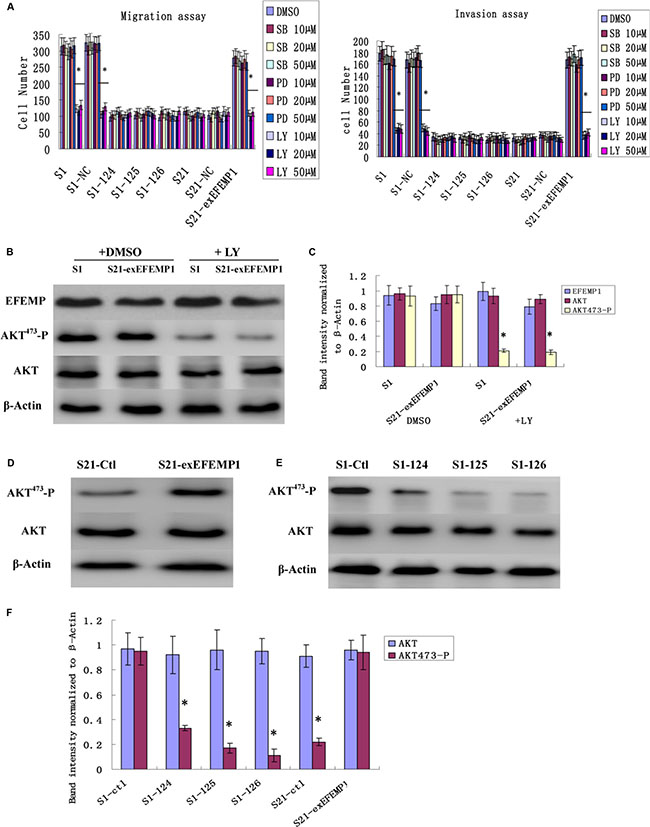
Figure 8: Effects of EFEMP1 on AKT pathway. (A) EFEMP1 high expressed cells were serum-starved and treated with DMSO or the indicated inhibitors, SB202190, PD98059, and LY294002, for 24 h. The migration and invasion assay were performed by Boyden chambers without or with Matrigel. (B) After treating with LY294002, unphosphorylated and phosphorylated forms of AKT were detected by immunoblot analysis. (C) The average band intensities were normalized to β-actin. (D) After RNA interference, immunoblot analysis were performed to detect the effect of decreased EFEMP1 on the activities of AKT. (E) After overexpression transfection, immunoblot analysis were performed to detect the effect of increased EFEMP1 on the activities of AKT. (F) The average band intensities were normalized to β-actin. *P < 0.05 versus control.
Effects of EFEMP1 on EMT genes correlated to tumor progression
EMT is a key process correlated to tumor invasion and metastasis. Therefore, we examined whether EFEMP1 could stimulate the genes involved in EMT using a focused microarray approach. The EMT microarray contains 84 genes including cell surface receptors; cytoskeletal genes mediating cell adhesion, migration, motility, and morphogenesis. A 2-fold or greater difference in mRNA expression levels was used as the cut-off to determine significant regulatory effects on genes involved in tumor metastasis. It was noteworthy that EFEMP1 had appreciable effect on the expression of several key EMT effectors, including E-cadherin, N-cadherin and vimentin (Table 1 and Figure 9). The down-regulation of EFEMP1 also substantially reduced the expression of a number of genes, including COL5A2, FN1, ITGAV, MMP2, MMP3, MMP9, SMAD2, SNAIL3, TMEFF1, TWIST1 and VCAN, which were increased during EMT (Table 1). We validated the changes seen in the array study by measuring gene expression of the top 9 genes (> 5 folds) using real-time qPCR in the other two shRNA infected cells (S1–124, S1–125), and the S21-exEFEMP1 infected group (Figure 9). The results showed that EFEMP1 down-regulation and up-regulation significantly activated the expression of EMT genes. These results suggest that EFEMP1 has potential to stimulate expression of genes involved in the EMT/metastasis.
Table 1: Differential expression of EMT-related genes after EFEMP1 RNA interference
Gene Symbol |
Fold Regulation |
p value |
|---|---|---|
CDH2 |
–5.32 |
0.000964 |
VIM |
–4.76 |
0.012742 |
COL5A2 |
–4.44 |
0.027827 |
DSC2 |
–2.51 |
0.026877 |
EGFR |
–2.37 |
0.028959 |
FN1 |
–2.14 |
0.000179 |
FOXC2 |
–3.80 |
0.000594 |
ILK |
–4.21 |
0.001553 |
ITGAV |
–5.40 |
0.010292 |
ITGB1 |
–5.29 |
0.000010 |
MAP1B |
–2.41 |
0.014160 |
MMP2 |
–4.73 |
0.033315 |
MMP3 |
–4.49 |
0.006922 |
PTK2 |
–5.05 |
0.000249 |
PTP4A1 |
–4.13 |
0.034422 |
SMAD2 |
–3.47 |
0.001158 |
SNAIL2 |
–3.69 |
0.023954 |
SPARC |
–5.64 |
0.011191 |
STEAP1 |
–5.33 |
0.000595 |
TMEFF1 |
–5.02 |
0.001031 |
VCAN |
–4.69 |
0.001605 |
CDH1 |
5.61 |
0.014732 |
CAV2 |
4.68 |
0.021376 |
FGFBP1 |
2.65 |
0.002122 |
KRT19 |
3.91 |
0.004991 |
KRT7 |
4.00 |
0.003723 |
MST1R |
3.01 |
0.030126 |
OCLN |
5.69 |
0.018415 |
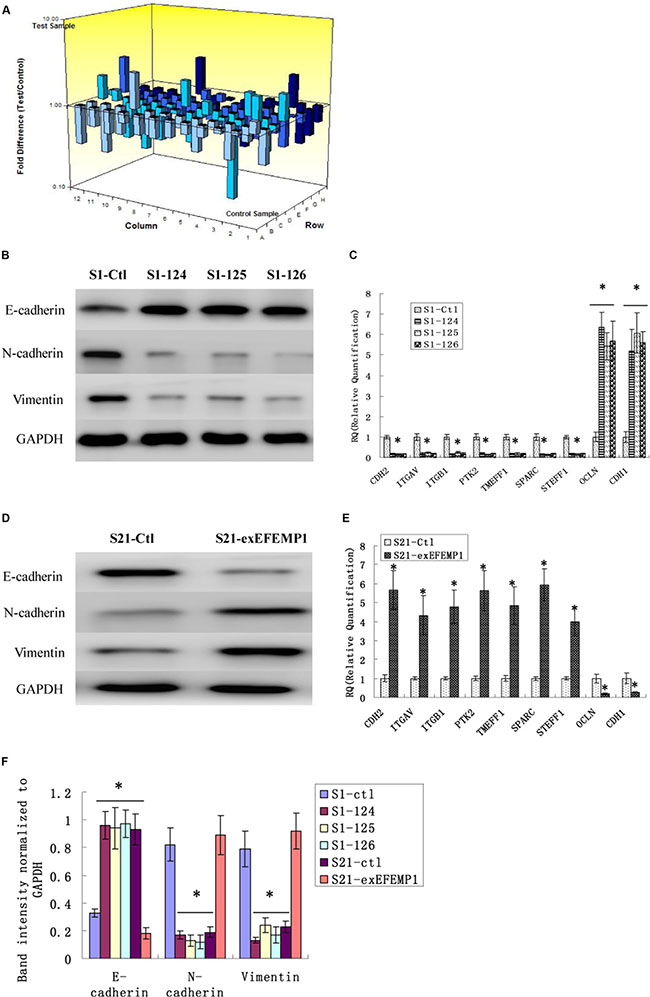
Figure 9: Effects of EFEMP1 on EMT genes correlated to tumor progression. (A) The microarray image of 84 genes related to tumor progression by RT² Profiler™ PCR Array. (B) After RNA interference, EMT marker, including E-cadherin, N-cadherin and vimentin as measured by Western blot. (C) The top 9 genes (> 5 folds) of the microarray as measure by real-time qPCR in the EFEMP1 shRNA infected group. (D)After overexpression transfection, EMT marker, including E-cadherin, N-cadherin and vimentin as measured by Western blot. (E) The top 9 genes (> 5 folds) of the microarray as measure by real-time qPCR in the S21-exEFEMP1 infected group. (F) The average band intensities were normalized to GAPDH. *P < 0.05 versus control.
DISCUSSION
In previous study, we confirmed that overexpression of EFEMP1 was closely associated with tumor progression and poor prognosis in human ovarian carcinoma, and EFEMP1 was increased in highly invasive subclone, compared to the low invasive subclone [15]. For further exploring the potential tumorigenicity of EFEMP1 in ovarian cancer, RNA interference and overexpression transfection were made to detect the effects of EFEMP1 on cell proliferation, invasion and metastasis. The influence on EMT genes as well as other possible signaling pathways were also considered.
In particular, EFEMP1 was subjected to both pro-tumor and anti-tumor activities [16]. Our experiment results exhibited that in ovarian cancer, EFEMP1 could promote cancer cell growth, invasion and metastasis via activated the PI3K/AKT pathway. In the HCT116 colon carcinoma cell line, EFEMP1 could promote growth, migration and invasion of cancer cells through a mechanism correlated to p38α and/or p38β activation [17]. In malignant gliomas, EFEMP1 secreted by glioma cells could activate DLL4-Notch signaling to induce pro-angiogenic behavior and promote glioma cell motility and invasion [18, 19]. On the contrary, EFEMP1 inhibited lung cancer cell invasion and metastasis and suppressed MMP-7 expression by activating Wnt/β-catenin signaling [20]. And in nasopharyngeal carcinoma, EFEMP1 suppressed cell migration and invasion via the PI3K/AKT pathway [13]. The role of EFEMP1 has tissue specificity, which may be due to the fact that the functions of tumor-associated genes are determined by the tumor surrounding microenvironment [21].
PI3K/AKT pathway activates numerous cellular functions including cell survival, proliferation, death and invasion, its hyperactivation contributes to tumorigenesis in different cancers [22]. In our study, high-expressed EFEMP1 could increase phospho-AKT activity and promote cells migration and invasion abilities, whereas knockdown its expression could significantly decrease phospho-AKT activity and inhibit cells migration and invasion abilities. In lung cancer stem cells, EFEMP1 could suppress invasion and migration of lung adenocarcinoma cells by modulating the IGF1R/PI3K/AKT/GSK3β pathway [23]. However, in pancreatic carcinoma cells, EFEMP1 could bind to EGFR and contribute to the enhancement of tumor growth via AKT and MAPK signaling pathway [24]. Collectively, EFEMP1 can be one of the regulators of AKT pathway to influence the development of tumor.
As is well known that EMT correlates to the progression of many epithelial cancers, which is closely associated to the dissemination of malignant cells from primary epithelial neoplasm and invasion into the local tissue and blood vessels [25–27]. Therefore, we considered trying to explore the possible relevance between EFEMP1 and EMT in ovarian cancer. Our results revealed that the knockdown of EFEMP1 resulted in increased E-cadherin expression and reduced the expressions of N-cadherin and vimentin; meanwhile, increased EFEMP1 suppressed E-cadherin expression and increased the expressions of N-cadherin and vimentin. EFEMP1 had appreciable effect on the expression of several key EMT genes. In summary, our data simultaneously indicated that EFEMP1 might promote EMT-associated tumor invasion and metastasis in ovarian cancer. In contrary, Kim IG et al. reported that forced expression of EFEMP1 suppressed invasion and migration of lung adenocarcinoma cells and inhibited the EMT process [23]. We speculated that the relationship between EFEMP1 and EMT may be determined by the role of EFEMP1 in different cancers.
The critical conclusion is that our study confirmed that EFEMP1 was a promoting gene for tumor growth, invasion and metastasis in ovarian cancer. Collectively, our findings highlight the importance of EFEMP1 in ovarian cancer development and progression in vitro and in vivo, which suggests a new therapeutic targeting at EFEMP1 in the future.
MATERIALS AND METHODS
Cell line
The highly invasive subclone (S1) and the low invasive subclone (S21) were derived from the SKOV3, human ovarian cancer cell line, which was obtained from Shanghai Institute for Biological Sciences, Chinese Academy of Sciences. The sublones have the highest homology, the smallest heterogeneity and different invasion and metastasis characteristics. Analyzing the gene expression differences between them provides further help for the discovery of genes correlated to the invasion and metastasis in ovarian cancer [28]. Cells were cultured in RPMI-1640 supplemented with 10% fetal bovine serum (FBS) and antibiotics (Gibco BRL, Rockville, MD) at 37°C and 5% CO2 condition.
Microarray analysis
Total RNAs were harvested using TRIzol (Invitrogen) and the RNeasy kit (Qiagen) according to manufacturer’s instructions, including a DNase digestion step. After having passed RNA measurement on the Nanodrop ND-1000 and denaturing gel electrophoresis, the samples were amplified and labeled using the Agilent Quick Amp labeling kit and hybridized with Agilent whole genome oligo microarray in Agilent’s SureHyb Hybridization Chambers. After hybridization and washing, the processed slides were scanned with the Agilent DNA microarray scanner (G2505B) using settings recommended by Agilent Technologies. The resulting text files extracted from Agilent Feature Extraction Software (version 10.5.1.1) were imported into the Agilent GeneSpring GX software (version 11.0) for further analysis.
RNA interference and overexpression transfection
The overexpression of EFEMP1 was achieved with Recombining pGC-LV-GV287-GFP vector with the EFEMP1 (NM_001039348) gene, while knockdown of EFEMP1 was achieved with cloning small hairpin RNAs (shRNAs) used self-inactivating lentivirus vector containing a CMV-driven GFP reporter and a U6 (GeneChem, Shanghai, China). The target sequences for EFEMP1 were as follows: 124: 5′- AGTC AATAGTCTACAAATA- 3′; 125: 5′- GTAGACATAGAT GAATGTA -3′; 126: 5′- TGTGAGACAGCAATGCAAA -3′. Specific host cells were incubated with the infection medium containing recombinant vectors at a multiplicity of infection (MOI) of 100 for 24 hours. Then the medium was replaced with fresh complete medium. Ultimately, GFP expression was observed by fluorescence microscopy to inspect the proportion of GFP-positive. The results of western blotting, real-time quantitative RT-PCR and immunocytochemistry (ICC) further confirmed the transfection efficiency.
Western blot
Protein lysates were separated using 10% SDS-PAGE gel electrophoresis and then transferred to PVDF membrane and blocked with 5% BSA. The primary antibodies EFEMP1 (sc-33722, Santa Cruz Biotechnology, Inc) and GAPDH (sc-365062, Santa Cruz Biotechnology, Inc) were incubated on shaking bed overnight at 4°C. Secondary antibody was incubated at room temperature for 1 h. Developed films were digitized by scanning, and the optical densities were analyzed by the Gel-Pro Analyzer Software (Media Cybernetic, Inc, Bethesda, MD).
Quantitative real-time PCR (q-RT-PCR) and agarose gel electrophoresis (AGE)
Total RNA was isolated using TRIzol reagent (Invitrogen, CA) and the cDNA was reverse transcribed according to the manufacturers’ protocol. Quantitative Real-time PCR analysis was performed in LightCycler® 480 system (Applied Biosystems, USA) with SYBR Green® PCR Master Mix (Applied Biosystems, USA). The 20 μl PCR reaction mixture contained 10 μl SYBR Green PCR master mix, 2 μl cDNA and 0.8 μl the forward and reverse primers each (optimal concentration of 0.2 μM). The primers used for EFEMP1 and b-actin were presented in the following: EFEMP1 sense 5′-ACCCTTCCCACCGTATCCA-3′; and antisense 5′- TCTGCTCTACAGTTGTGCGTCC-3′, β-actin sense 5′-TGGCACCCAGCACAATGAA-3′; and antisense 5′-CTAAGTCATAGTCCGCCTAGAAGCA-3′. Then the PCR products were separated by agarose gel electrophoresis to confirm successful amplification.
Immunocytochemistry (ICC)
Cells were seeded into 6-well plate with coverslips inside, after appropriate culture, coverslips were subjected to streptavidin-biotin-peroxidase complex procedures (SP). Coverslips were incubated with mouse-anti-human EFEMP1 antibody (sc-33722, Santa Cruz Biotechnology, Inc.) with dilution rate 1:50 at 4°C overnight. The secondary antibody was goat anti-mouse antibody. The positive controls were human ovarian cancer paraffin-embedded sections (EFEMP1 positive), and the negative control was obtained by replacing the primary antibody with normal mouse immunoglobulin (IgG). The presence of brown granules developed by DAB reagent kit in the cytoplasm was considered as positive expression. The EFEMP1 expression was determined by the intensity of staining, quantity of positive cells and distribution.
Cell proliferation assays
Growth curves and soft agar colony formation assay were used to measure the cell proliferation capacities. For growth curves, logarithmic phase cells were collected and seeded into 24 well plates (1 × 10⁴/well), and further incubated for 7 days. Every day, three wells were taken out to count the number of cells and figured out the average, with growth curves drawn out.
As for soft agar colony formation assay, 1.2% sea plague agar or 0.7% sea plague agar and the same amount of fresh DMEM were used to form base agar layer and top agar layer, respectively. After digested, suspended, cells were seeded into each well. Two weeks later, plates were detected under a microscope to monitor the colony formation. Each well was divided into 4 segments by the horizontal line and vertical line, the numbers of colonies were counted and the diameters of the colonies were measured, then calculated the means.
Cell cycle analysis by flow cytometry
For cell cycle analysis, cells at log phase were harvested, and washed three times with cold phosphate-buffered saline (PBS). Then stained with 50 μg/ml PI and 250 μg/ml RNase for 30 minutes respectively at room temperature in the dark. The proportion of cells in each phase of cycle was analyzed using the Modfit LT2.0 DNA assay (Becton Dickinson).
Migration and invasion assays
In vito, transwell assays were performed to assess cell migration and invasion abilities. Briefly, for the migration assays, cells suspended in serum-free media and were seeded into the upper chamber of transwell plate (BD Biosciences, Bedford, MA) with polyvinylpyrrolidone-free polycarbonate (PVPF) filter of 8.0 μm pore size. Conditioned media of NIH3T3 cell culture was added to the lower chamber as a chemotactic factor. After 12 h, the cells on the lower surface of the membrane were fixed, stained with hematoxylin and eosin (H&E) and counted. For the invasion assays, the PVPF membrane of transwell (BD Biosciences, Bedford, MA) was coated with 50 μl Matrigel (BD Biosciences, Bedford, MA) 1:3 diluted with medium, and then cells were seeded in the upper chamber and allowed to invade through the Matrigel to the lower chamber for 24 h. Then non-invading cells remaining on the upper surface were removed, the number of invaded cells (lower side of the membrane) were fixed, stained and counted. Each experiment was performed at least in triplicate.
Tumor xenografts in nude mice
BALB/C-nu/nu nude mice (female, 5-week-old) were purchased from National Resource Center for Rodent Laboratory Animal of China for tumorigenicity assays. Nude mice were injected subcutaneously or through the tail veins with 5.0 × 10⁶ fresh cells. All mice were raised in the same sterile animal facility. After regularly monitored for 8 weeks, the mice were killed and the lung and tumor tissues were made into paraffin-embedded sections for immunohistochemical examination. Tumor onsets were measured with calipers weekly by two trained laboratory staffs at different times on the same day. The volumes of tumors were calculated according to the formula: (length × width2)/2 and the average values were expressed as mean ± SE. The animal experiment was approved by the Institutional Animal Care and Use Committee of Shandong University and was in compliance with all regulatory guidelines.
RT² profiler™ PCR array
In order to detect the effect of EFEMP1 on the gene expression of epithelial mesenchymal transition, the Human Epithelial to Mesenchymal Transition (EMT) RT² Profiler™ PCR Array (PAHS-090, SABiosciences) were performed by KangChen Bio-tech (Shanghai, China). After RNA isolation, DNase treatment and RNA clean-up, the isolated RNA was reverse transcribed into cDNA according to the manufacturer’s protocol. Real-time PCR Array was done using Super Array PCR master mix on an ABI PRISM7900 instrument (Applied Biosystems, Foster City, CA). Data were analyzed using ΔΔCt method.
Statistical analysis
The results of cell and molecular biology data were expressed as the mean ± SE. For analysis of statistical significance between two preselected groups, a two-tailed t-test was used, and for analysis of statistical significance among three preselected groups, one-way ANOVA was used. Statistical analysis was performed using SPSS statistical software package (standard version 13.0). P-value < 0.05 was considered statistically significant.
ACKNOWLEDGMENTS AND FUNDING
This work was supported by National Nature Science Foundation of China (81202056). The funders had no role in study design, data collection and analysis, decision to publish, or preparation of the manuscript.
CONFLICTS OF INTEREST
None declared.
REFERENCES
1. Jemal A, Siegel R, Xu J, Ward E. Cancer statistics, 2010. CA Cancer J Clin. 2010; 60:277–300.
2. Januchowski R, Zawierucha P, Rucinski M, Nowicki M, Zabel M. Extracellular matrix proteins expression profiling in chemoresistant variants of the A2780 ovarian cancer cell line. Biomed Res Int. 2014:365867.
3. Cho KR, Shih Ie M. Ovarian cancer. Annu Rev Pathol. 2009; 4:287–313.
4. Bast RC Jr, Hennessy B, Mills GB. The biology of ovarian cancer: new opportunities for translation. Nat Rev Cancer. 2009; 9:415–428.
5. Chaffer CL, Weinberg RA. A perspective on cancer cell metastasis. Science. 2011; 331:1559–1564.
6. de Vega S, Iwamoto T, Yamada Y. Fibulins: multiple roles in matrix structures and tissue functions. Cell Mol Life. 2009; 66:1890–1902.
7. Canqemi C, Hansen ML, Arqraves WS, Rasmussen LM. Fibulins and their role in cardiovascular biology and disease. Adv Clin Chem. 2014; 67:245–165.
8. Gallagher WM, Currid CA, Whelan LC. Fibulins and cancer: friend or foe? Trends Mol Med. 2005; 11:336–340.
9. Song EL, Hou YP, Yu SP, Chen SG, Huang JT, Luo T, Kong LP. EFEMP1 expression promotes angiogenesis and accelerates the growth of cervical cancer in vivo. Gynecol Oncol. 2011; 121:174–180.
10. Seeliger H, Camai P, Ischenko I, Kleespies A, De Toni EN, Thieme SE. EFEMP1 expression promotes in vivo tumor growth in human pancreatic adenocarcinoma. Mol Cancer Res. 2009; 7:189–198.
11. Hu B, Thirtamara-Raiamani KK, Sim H, Viapiano MS. Fibulin-3 is uniquely upregulated in malignant gliomas and promotes tumor cell motility and invasion. Mol Cancer Res. 2009; 7:1756–1770.
12. Sadr-Nabavi A, Ramser J, Volkmann J, Naehrig J, Wiesmann F, Betz B. Decreased expression of angiogenesis antagonist EFEMP1 in sporadic breast cancer is caused by aberrant promoter methylation and points to an impact of EFEMP1 as molecular biomarker. Int J Cancer. 2009; 124:1727–1735.
13. Hwang CF, Chien CY, Huang SC, Yin YF, Huang CC, Fang FM. Fibulin-3 is associated with tumour progression and a poor prognosis in nasopharyngeal carcinomas and inhibits cell migration and invasion via suppressed AKT activity. J Pathol. 2010; 222:367–379.
14. Hu Y, Pioli PD, Siegel E, Zhang Q, Nelson J, Chaturbedi A. EFEMP1 suppresses malignant glioma growth and exerts its action within the tumor extracellular compartment. Mol Cancer. 2011; 10:123.
15. Chen J, Wei D, Zhao Y, Liu X, Zhang J. Overexpression of EFEMP1 correlates with tumor progression and poor prognosis in human ovarian carcinoma. Plos One.2013; 8: e78783.
16. Obaya AJ, Rua S, Moncada-Pazos A, Cal S. The dual role of fibulins in tumorigenesis. Cancer Lett. 2012; 325:132–8.
17. Arechederra M, Priego N, Vázquez-Carballo A, Sequera C, Gutiérrez-Uzquiza Á, Cerezo-Guisado MI, Ortiz-Rivero S, Roncero C, Cuenda A, Guerrero C, Porras A. p38 MAPK down-regulates fibulin 3 expression through methylation of gene regulatory sequences: role in migration and invasion. J Biol Chem. 2015; 290:4383–97.
18. Nandhu MS, Hu B, Cole SE, Erdreich-Epstein A, Rodriguez-Gil DJ, Viapiano MS. Novel paracrine modulation of Notch-DLL4 signaling by fibulin-3 promotes angiogenesis in high-grade gliomas. Cancer Res. 2014; 74:5435–48.
19. Hu B, Nandhu MS, Sim H, Agudelo-Garcia PA, Saldivar JC, Dolan CE, Mora ME, Nuovo GJ, Cole SE, Viapiano MS. Fibulin-3 promotes glioma growth and resistance through a novel paracrine regulation of Notch signaling. Cancer Res. 2012; 72:3873–85.
20. Chen X, Meng J, Yue W, Yu J, Yang J, Yao Z, Zhang L. Fibulin-3 suppresses Wnt/β-catenin signaling and lung cancer invasion. Carcinogenesis. 2014; 35:1707–16.
21. Chen L, Sun B, Zhang S, Zhao X, He Y, Zhao S, Lin T, Li X. Influence of microenvironments on microcirculation patterns and tumor invasion-related protein expression in melanoma. Oncol Rep. 2009; 21:917–23.
22. Carmona FJ, Montemurro F, Kannan S, Rossi V, Verma C, Baselga J, Scaltriti M. AKT signaling in ERBB2-amplified breast cancer. Pharmacol Ther. 2015.
23. Kim IG, Kim SY, Choi SI, Lee JH, Kim KC, Cho EW. Fibulin-3-mediated inhibition of epithelial-to-mesenchymal transition and self-renewal of ALDH+ lung cancer stem cells through IGF1R signaling. Oncogene. 2014; 33:3908–17.
24. Camaj P, Seeliger H, Ischenko I, Krebs S, Blum H, De Toni EN, Faktorova D, Jauch KW, Bruns CJ. EFEMP1 binds the EGF receptor and activates MAPK and Akt pathways in pancreatic carcinoma cells. Biol Chem. 2009; 390:1293–302.
25. Steinestel K, Eder S, Schrader AJ, Steinestel J. Clinical significance of epithelial-mesenchymal transition. Clin Transl Med. 2014; 3:17.
26. Wendt MK, Balanis N, Carlin CR, Schiemann WP. STAT3 and epithelial-mesenchymal transitions in carcinomas. JAKSTAT. 2014; 3:e28975.
27. Singh A, Settleman J. EMT, cancer stem cells and drug resistance: an emerging axis of evil in the war on cancer. Oncogene. 2010; 29:4741–4751.
28. Chen J, Zhang J, Zhao Y, Li J, Fu M. Integrin beta3 down-regulates invasive features of ovarian cancer cells in SKOV3 cell subclones. J Cancer Res Clin Oncol 2009; 135:909–17.