
INTRODUCTION
Chronic inflammation is believed to be a causative factor for tumorigenesis. NF-κB is a crucial regulator of the inflammatory response. Its constitutive or transient activation enables genetic alterations and oncogene activation, and confers cancer-promoting potential to cells [1]. NF-κB forms multiple homodimeric- or heterodimeric complexes with Rel-like domain-containing proteins, including RelA/p65. It is a pleiotropic transcription factor that can exert profound effects on the cellular immune state by coordinating the expression of numerous downstream targets [2, 3]. MicroRNA-146a (miR146a), recognized as a gene targeted by NF-κB, has been implicated in a variety of cellular functions, particularly in pathological conditions, such as inflammation and cancer [4–6]. Chronic inflammation caused by a variety of pathogens such as Helicobacter pylori (H. pylori) can presumably induce the long term expression of NF-κB and miR146a [7–9]. This study investigated the potential influence of H. pylori infection, activation of NF-κB, and miR146a on cellular genome integrity and tumorigenesis.
MicroRNAs (miRNAs) are small non-coding RNAs with approximately 20–24 nucleotides in length that repress gene expression, usually by targeting the 3′-untranslated regions (3′UTRs) of specific mRNAs. Over the past decade, in silico screening of the sequencing database combined with reporter gene-based assays has led to the discovery of miRNAs targeting genes of interest. Mounting evidence suggests that the functions of a number of key factors involved in DNA repair are also regulated by miRNAs.
The Fanconi anemia (FA)-associated DNA damage response pathway is a crucial DNA repair mechanism that resolves DNA interstrand crosslinked (ICL) lesions and stalled replication forks [10]. A key regulatory event in the pathway is the monoubiquitination of Fanconi anemia complementation group D2 (FANCD2), which is induced by an E3 ubiquitin ligase complex consisting of 8 FA proteins, including Fanconi anemia group M protein (FANCM) [11]. Monoubiquitinated FANCD2 forms foci at damaged lesions that co-localizes with DNA repair factors such as FANCI, BRCA1, and RAD51 [12]. Among the several reported roles of monoubiquitinated FANCD2 is recruiting the carboxy-terminal binding protein-interacting protein (CtIP) nuclease, which induces end resection at double strand breaks, a step required for DNA homologous recombination repair (HR) and replication fork recovery [13–15]. FANCD2 is also essential in the removal and bypass of ICL-lesions by DNA replication machineries [16]. In addition to being part of the FA core complex, FANCM forms a complex with FA-associated protein 24 KDa (FAAP24)-MHF1-MHF2, each of which is required for recruitment of the FA core complex at chromatin and FANCD2 monoubiquitination. FAAP24 is required for the DNA-binding and chromatin loading abilities of FANCM in vitro [17]. FANCM also exhibits ATP-dependent replication fork remodeling and branch migration activities using model fork structures in vitro, which may be needed for stabilizing DNA replication forks during the ICL repair [18, 19]. The fork remodeling and branch migration activities are enhanced by MHF1-MHF2 in vitro [20–22]. The FANCM-FAPP24 complex also plays an important role in regulating ICL-induced, ATR-mediated checkpoint [23, 24]. The roles of FANCM likely extend beyond the canonical FA pathway, suggested by the roles of FANCM orthologs in other organisms; additional information on this topic is summarized in a recent review article [25]. Overall, FANCM plays multiple roles in genome maintenance during replication and DNA repair.
Here, we show that FANCM stability is directly regulated by miR146a. The overexpression of miR146a or artificial activation of NF-κB drastically suppressed FANCM expression, and was associated with impaired damage-inducible FANCD2 monoubiquitination, HR repair, and increased cellular sensitivity to hydroxyurea (HU) and cisplatin. The physiological significance of this pathway was supported by the observation that miR146a expression was induced by H. pylori infection, which led to reduced FANCM expression and FANCD2 foci formation. These data suggests the aberrant activation of inflammation-induced miR146a can compromise genome integrity by suppressing FANCM expression.
RESULTS
miR146a directly targets the 3′UTR of FANCM
It is becoming well-accepted that inflammation-induced miR146a is associated with cancer development [4–6, 26]. Our initial analysis of miR146a showed that its overexpression strongly elicited DNA damage in HeLa (human cervical adenocarcinoma) and GES-1 cells (human gastric epithelial cells) upon treatment with the replication stress inducer HU and the DNA ICL-inducing agent cisplatin, as measured by γ-H2AX foci staining (Figure 1A and Supplementary Figure S1A, respectively). Consistent with the increased damage, cells expressing miR146a were more sensitive to HU and cisplatin (Figure 1B and Supplementary Figure S1B, respectively). Moreover, co-expression of miR-146a antagomir effectively reversed these phenotypes, suggesting that these effects were indeed mediated by miR146a. Together, these data suggest that overexpressing miR146a may impair genome integrity.
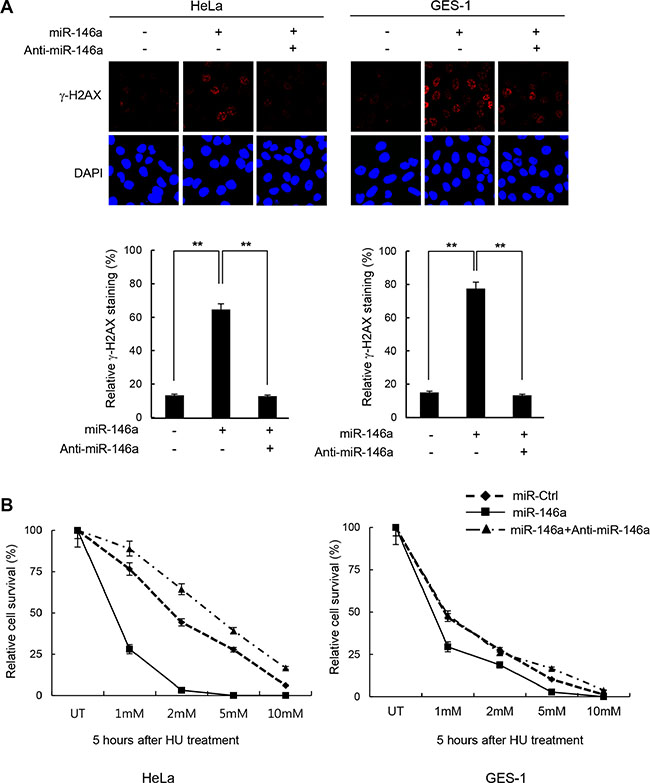
Figure 1: Increase of DNA damage sensitivity by miR146a. (A) Two days after transfection of HeLa or GES-1 cells with miR146a alone or together with anti-miR146a, the cells were treated with 5 mM HU for 16 h to detect residual γ-H2AX. Results are shown as the mean ± SD (n = 3); **P < 0.01. (B) HeLa and GES-1 cells were transfected with control, miR146a, and miR146a plus anti-miR146a, and were then exposed to increasing concentrations of HU for 5 hr. The viability of treated cells was examined using the clonogenic survival assay. Results are shown as the mean ± SD (n = 3); **P < 0.01.
In an attempt to search for the relevant targets of miR146a in DNA Damage Response (DDR) or DNA repair, we utilized the TargetScan algorithm (MIT; release 6.2). This method identified several DDR genes as potential targets of miR146a, including BRCA1 and FANCM. Indeed, BRCA1 was previously identified as a miR146a target [27], validating our bioinformatic approach. To determine whether their effect of miR-146a on DNA damage response was mediated via its effect on FANCM, we cotransfected HeLa and GES-1 cells with miR-146a and/or miR-146a-insensitive FANCAM expression plasmid. Our results showed that the non-targetable FANCM rescued the HU-induced γ-H2AX foci formation (Supplementary Figure S2A) and cellular sensitivity to HU (Supplementary Figure S2B). We also observed similar reversion when miR-146a-insensitive BRCA1 was expressed. Interestingly, when we expressed both FANCM and BRCA1 simultaneously, we did not see further rescue, indicating that FANCM and BRCA1 may have overlapping roles in the phenotype that we are seeing.
Subsequent TargetScan analysis predicted that miR146a targeted two sequences found between nucleotides (nt) 704 and 711 and between nt 755 and 761 on the human FANCM 3′UTR sequence (Figure 2A). To confirm the interaction of miR146a with these predicted sites and the subsequent repression of FANCM, we performed a 3′UTR luciferase reporter assay. The relative luciferase activity of the construct with wild-type 3′UTR of FANCM significantly repressed following the transfection of miR146a (Figure 2B). In contrast, the repression of relative luciferase activity was clearly abrogated when single (M1 and M2) and especially double (M3) conserved sites were deleted in the FANCM 3′UTR. This indicates that these two seed regions are functional as miR146a targets sites, exerting additive effects on each other. Accordingly, the MT3 mutant was shown to be nonfunctional as a target of miR146a due to the complete loss of both target sites.
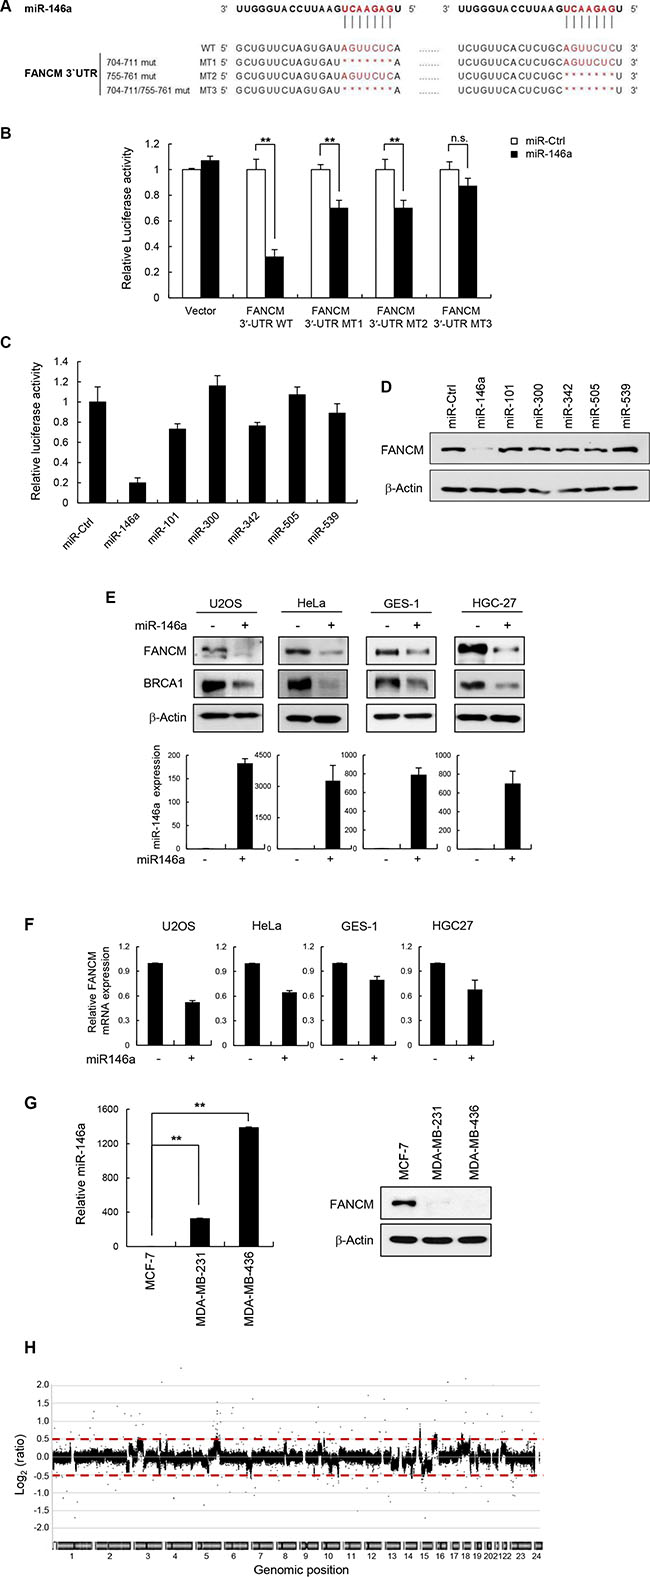
Figure 2: miR146a directly targets FANCM. (A) Schematic diagrams show the sequence and position of predicted miR146a binding sites in the FANCM 3′UTR. Single- (M1 and M2) and double- (M3) deletion mutations of the miR146a target sites were shown. The seed resion of miR146a is in red. (B) FANCM 3′UTR-WT and FANCM 3′UTR-MT1-3 were cotransfected with miR146a into HeLa cells. Luciferase activity was measured 24 h after transfection. Data represent the mean ± SD (n = 3); **P < 0.01. (C) HeLa cells were cotransfected with the FANCM 3′UTR luciferase reporter vector along with the candidate miRNAs, which were predicted by Targetscan v6.2, or the miRNA-negative control (miR-Ctrl). Results are shown as the mean ± SD (n = 3). (D) The levels of FANCM protein were measured by western blotting after transfection of miR146a into a number of cell lines as indicated. (E) Western blot analysis using cell extracts was performed to detect cellular levels of FANCM and BRCA1 after transfecting indicated cells with miR146a (top). In parallel, the transfected cells were subjected to RNA extraction, followed by RT-qPCR to measure the amount of miR146a after transfection. The relative amount of miR146a was quantified and shown as the mean ± SD (n = 3); **P < 0.01 (bottom). (F) Expression of FANCM mRNA in miR146a transfected cells was quantitated using real-time qPCR. Results are shown as the mean ± SD (n = 3); **P < 0.01. (G) Three different breast cancer cell lines, MCF7, MDA-MB-231, and MDA-MB-436, were cultured and cell extracts were analyzed for evaluating miR146a (left) and FANCM expression (right) using Western blotting and RT-qPCR, respectively. Results are shown as the mean ± SD (n = 3); **P < 0.01. (H) Array CGH profiles of human fibroblast GM00637 cells transfected with miR146a versus control miRNA. Chromosomal regions above or below the red dotted line indicate gains or losses of corresponding genomic positions, respectively.
Next, to examine the evolutionary conservation of the identified target sites across species, the human FANCM 3′UTR of 878 nt in length (GenBank accession number: NM_020937.3) was aligned with 100 vertebrate species using the algorithms provided by the UCSC genome browser (https://genome.ucsc.edu/index.html). Surprisingly, alignment data showed that the FANCM 3′UTR was only conserved between primates, and that sequence differences with the other species were such that full sequence alignment was not allowed. While the two target sites of miR146a was relatively well conserved between primates (Supplementary Figure S3, red open box), neither target site was detected in species other than primates. These results suggest that the miR146a-mediated regulation of FANCM expression was introduced to the primate-specific FA pathway as a relatively late event in vertebrate evolution.
TargetScan algorithm (MIT; release 6.2) was further used to generate a selective miRNA library for screening (Supplementary Table S1). The analysis identified a total of six miRNAs as candidates, each of which was subjected to reverse screening for gene silencing effects on FANCM expression using a luciferase reporter gene assay (Figure 2C). The results showed that miR146a expression led to remarkably lower luciferase activity compared to control miRNA, whereas weak or non-statistically significant effects were observed with the other tested miRNAs. Consistently, miR146a overexpression significantly reduced endogenous FANCM protein level in HeLa cells (Figure 2D). The effects of miR146a on endogenous FANCM expression was further confirmed by comparing its protein levels in two human cancer cell lines, HeLa and U2OS (osteosarcoma) cells, and two human gastric cell lines, HGC-27 (carcinoma) and GES-1 (immortalized normal) cells, after transfecting the cells with miR146a or a negative control miRNA. As shown in Figure 2E, miR146a expression, which was also confirmed using RT-qPCR (Figure 2E, bottom), led to dramatic decreases in FANCM protein levels in all of the tested cells. BRCA1 protein expression was also downregulated, consistent with data from a previous study [27]. Moreover, expressing anti-miR146a in MCF7, HeLa and GES-1 cells led to increases in both FANCM and BRCA1 levels (Supplementary Figure S4). FANCM mRNA expression was also reduced when miR146a was overexpressed (Figure 2F), indicating that miR146a post-transcriptionally downregulates FANCM. These results demonstrate that miR146a down-regulates FANCM expression by directly targeting the 3′UTR of its transcript.
miR146a expression inversely correlates with FANCM protein levels in several breast cancer cell lines
Garcia et al. [27] reported that miR146a was abnormally overexpressed in several breast cancer cells. We chose three of the cell lines described in that report to compare the expression patterns of endogenous miR146a and FANCM protein using RT-qPCR and Western blot analysis, respectively. While the MCF-7 and MDA-MB-231 cell lines express wild type BRCA1, MDA-MB-436 cells carry mutated BRCA1 (5396 + 1G > A in the splice donor site of exon 20) (http://research.nhgri.nih.gov/bic/) [28] Western blot analysis of FANCM expression showed that its protein levels were significantly lower in the MDA-MD-231 and MDA-MB-436 cell lines compared to the MCF-7 control cell line (Figure 2G). These results suggest that miR146a expression in breast cancer cell lines is inversely correlated with FANCM protein levels.
When DNA repair does not properly operate in response to DNA ICLs or replication stress, it frequently gives rise to genome-wide chromosomal breaks, leading to genomic instability. To examine the effect of miR146a on genomic integrity, array comparative genomic hybridization was performed using human fibroblast GM00637 cells after transfecting with miR146a or a control miRNA. We found that chromosomal abnormalities were detected as chromosomal gains (dots over 0.5) and losses (dots below -0.5) that were widely distributed throughout the entire genome of miR146a-expressing cells (Figure 2H and Supplementary Figure S5), indicating that overexpressing miR146a causes chromosomal instability.
miR146a targeting FANCM impairs FANCD2 monoubiquitination
Loss of FANCM leads to reduced FANCD2-ubiquitination [17, 29]. Therefore, we assessed whether overexpressing miR146a interferes with the monoubiquitination of FANCD2 in HeLa and GES-1 cells following treatment with HU, which causes replication stress and activates the FA pathway. Consistent with the reduction in FANCM levels, miR146a expression in HeLa or GES-1 cells led to a significant decrease in monoubiquitinated FANCD2 (FANCD2-Ub) level, compared to a control miRNA (Figure 3A and Supplementary Figure S6A, respectively). The effects of miR146a were effectively reversed by co-transfecting anti-miR146a (Figure 3A), or by expressing exogenous FANCM cDNA that does not harbor the miR146a-binding 3′UTR (Figure 3B), suggesting that the effects are specific to miR146a and FANCM. Consistent with these results, both HeLa and GES-1 cells transfected with miR146a exhibited defective formation of FANCD2 foci compared to cells containing control miRNA, as shown by the decreased number of cells with foci (>5 foci) and these effects were rescued by anti-miR146a or FANCM cDNA expression (Figure 3C, 3D and Supplementary Figure S6B). These findings suggest that reduced FANCM caused by miR146a leads to impaired FANCD2 monoubiquitination and FANCD2 foci formation.
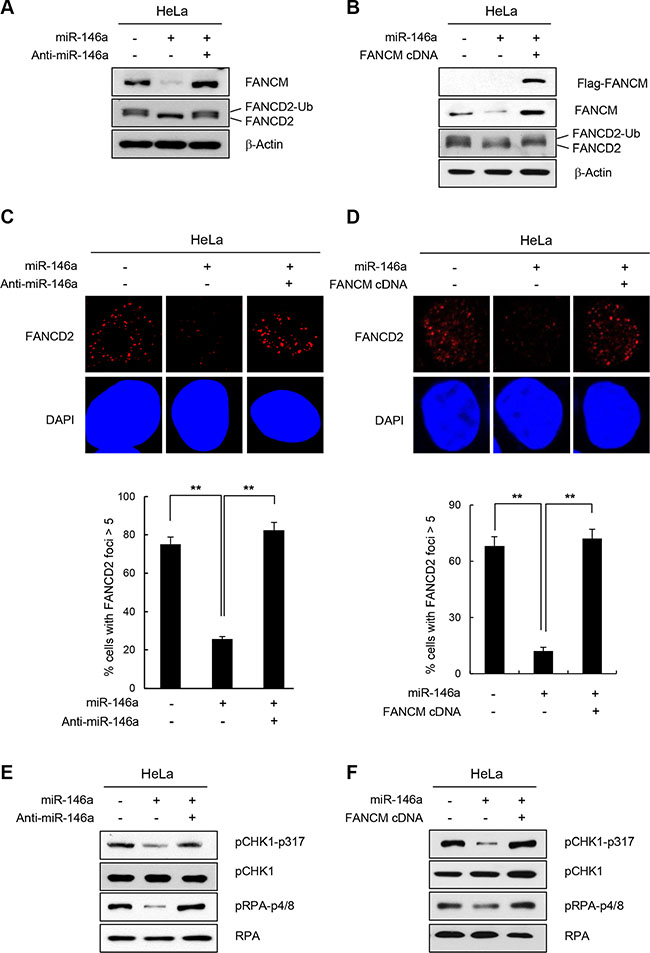
Figure 3: Effect of miR146a on FANCD2 monoubiquitination and the FA pathway. (A and B) HeLa cells were transfected with miR146a in the absence or presence of anti-miR146a (A) or miR146a-insensitive FANCM cDNA (B). After a 48 h transfection, the cells were treated with 5 mM HU for 5 h. The protein levels of FANCM and FANCD2 were measured by western blotting. Monoubiquitinated FANCD2 is indicated as the upper band of doublet protein bands corresponding to FANCD2. (C and D) After HeLa cells underwent the same treatment as (A and B) cells were analyzed for FANCD2 foci formation. DAPI was used for nuclear staining. Results are shown as the mean ± SD (n = 3); **P < 0.01. (E and F) Indicated cells were treated with 5 mM HU for 5 hr. Cell lysates were analyzed by Western blotting with antibodies against pCHK1-S317, CHK1, pRPA-S4/8, and RPA.
In addition to playing a role in inducing FANCD2-monoubiquitination, FANCM is also required for inducing replication protein A (RPA) phosphorylation and Chk1 activation in response to ICL-inducing agents [23, 24]. Consistent with this finding, expressing miR146a led to reduced phosphorylation of Chk1 and RPA, which was reversed by FANCM cDNA or anti-miR146a expression (Figure 3E and 3F, respectively). These results confirm that miR146a expression influences the physiological functions of FANCM during DDR.
miR146a attenuates replication fork restart
Given the known roles of FA proteins in modulating replication fork recovery and DNA replication origin firing, we determined the effects of miR146a on replication fork restart. To this end, we analyzed the DNA fiber spreading patterns of miR146a-transfected GES-1 cells after pulse-labeling the cells sequentially with IdU (green fluorescence) and CldU (red fluorescence) before and after 5-h HU treatment, respectively (Figure 4A). The results showed that nascent CldU tract length distribution from stalled replication forks was mainly shorter tracts in miR146a-expressing cells compared to control miRNA-transfected cells (Figure 4B), indicative of attenuated replication fork restart. This miR146a effect is consistent with a previous study demonstrated that FANCM-deficient cells exhibited defective replication fork restart [30].
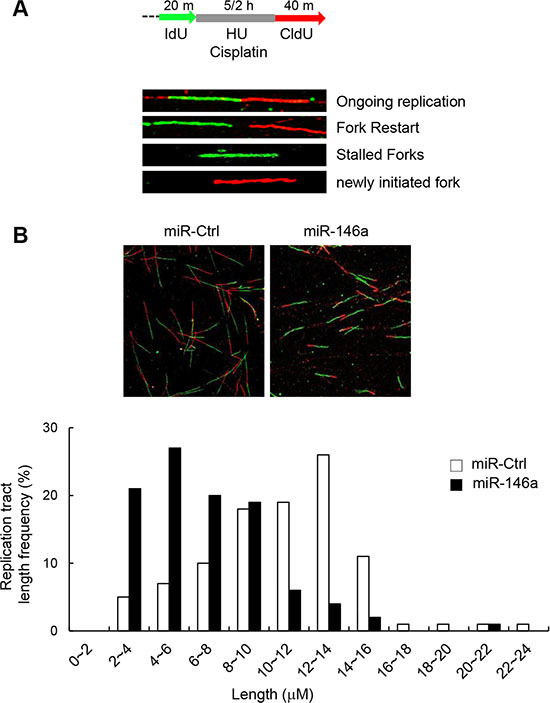
Figure 4: Effect of miR146a on replication fork restart. (A) Schematic of a single DNA fiber analysis is depicted. For DNA fiber analysis, after being transfected with miR146a or a control miRNA, GES-1 cells were labeled with IdU for 20 min, followed by exposure to HU for 5 hr and chased with CldU for 40 min. (B) Representative images of spread DNA fibers from miR146a-expressing cells versus control cells (top). Nascent track length distribution curves were plotted after measuring the length of CldU tracts from DNA fibers with two consecutive colors of green (IdU) and red (CldU).
Activation of NF-κB recapitulates miR146a expression in suppressing the FA pathway
There is a wealth of evidence supporting the fact that NF-κB up-regulates miR146a expression in various cell types such as those involved in immune responses and in cancer development [4–6]. To test whether the effects of miR146 overexpression described above could be recapitulated by NF-κB activation, we analyzed the effects of overexpressing the NF-κB RelA/p65 subunit after transfecting HeLa or GES-1 cells with the RelA/p65 expression construct. First, RT-qPCR confirmed that the overexpressed p65 subunit significantly upregulated miR146a expression compared to the control vector, indicating that overexpressed RelA/p65 was successfully integrated into the active dimeric form of NF-κB to transactivate miR146a transcription (Figure 5A). NF-κB activation in HeLa cells through p65 overexpression was also confirmed by the NF-κB luciferase assay, where transcription of the firefly luciferease was turned on by the binding of activated NF-κB to its cis-acting element in the promoter of this reporter gene (Supplementary Figure S7). These results suggest that overexpressing p65 functionally mimics NF-κB activation. Indeed, like miR146a, p65 overexpression in HeLa cells inhibited expression of the luciferase reporter gene carrying wild type FANCM 3′-UTR, whereas co-transfection with the p65 construct and anti-miR146a alleviated this inhibitory effects of NF-κB (Figure 5B), indicating that the effects of NF-κB on FANCM are exerted via miR146a. Western blot analysis showed a prominent reduction in FANCM protein levels, upon overexpression of the p65 subunit, which was recovered by co-transfection of p65 and anti-miR146a (Figure 5C). Consistent with the reduced FANCM levels, overexpressing p65 led to a reduction in FANCD2 monoubiquitination (Figure 6A) and foci formation (Figure 6B) in HeLa and GES-1 cells. These phenotypes were reversed by co-transfection with anti-miR146a, indicating that the effect of NF-κB on FANCD2 monoubiquitination and foci formation rely on the regulatory axis of NF-κB-miR146a-FANCM. Consistent with the role of FANCM in the checkpoint response, p65 overexpression led to decreased Chk1 (Ser317) and RPA phosphorylation, which was reversed by an antagomir of miR146a (Figure 6C). Similar to what we observed in miR146a-transfected cells, p65 overexpression led to delayed recovery from a stalled replication fork, as demonstrated by the shortening of red fluorescent CldU tracts in p65-overexpressing cells compared to control cells (Figure 6D).
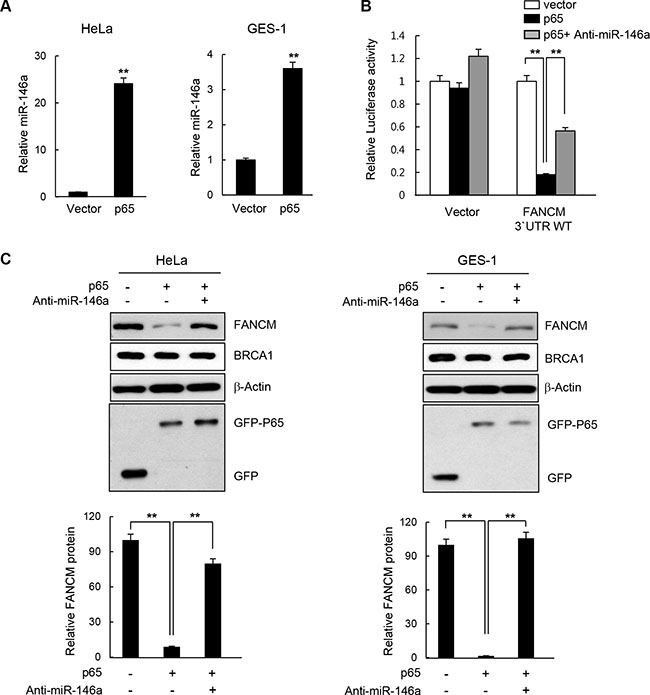
Figure 5: Effect of NF-κB on FANCM expression. (A) HeLa or GES-1 cells were transfected with the p65 expression construct and miR146a levels in the indicated cells were determined using RT-qPCR analysis. Results are shown as the mean ± SD (n = 3); **P < 0.01. (B) Luciferase reporter gene construct carrying the wild type or mutated 3′-UTR of FANCM was cotransfected with p65 cDNA or p65 cDNA plus anti-miR146a, as well as a control vector into HeLa cells. Luciferase activity was measured 24 hours after the transfection. Data represent the mean ± SD (n = 3); **P < 0.01. (C) HeLa or GES-1 cells were transfected with p65 construct in a combination of Anti-miR146a or a control miRNA, and indicated protein levels were determined by western blotting (top). Quantitative densitometry of FANCM protein expression is shown below, expressed as the mean ± SD (n = 3).
We found that p65 overexpression strongly induced γ-H2AX foci, and interestingly, the co-expression of anti-miR146a reduced the phenotype, in HeLa and GES-1 cells (Figure 6E). Consistent with the increased damage, p65-overexpressing cells were sensitive to HU treatment, and the effects were partially or largely alleviated by anti-miR146a treatment (Figure 6F). These data suggest that aberrantly overexpressed NF-κB promotes genomic instability by up-regulating miR146a, which suppresses FANCM expression.
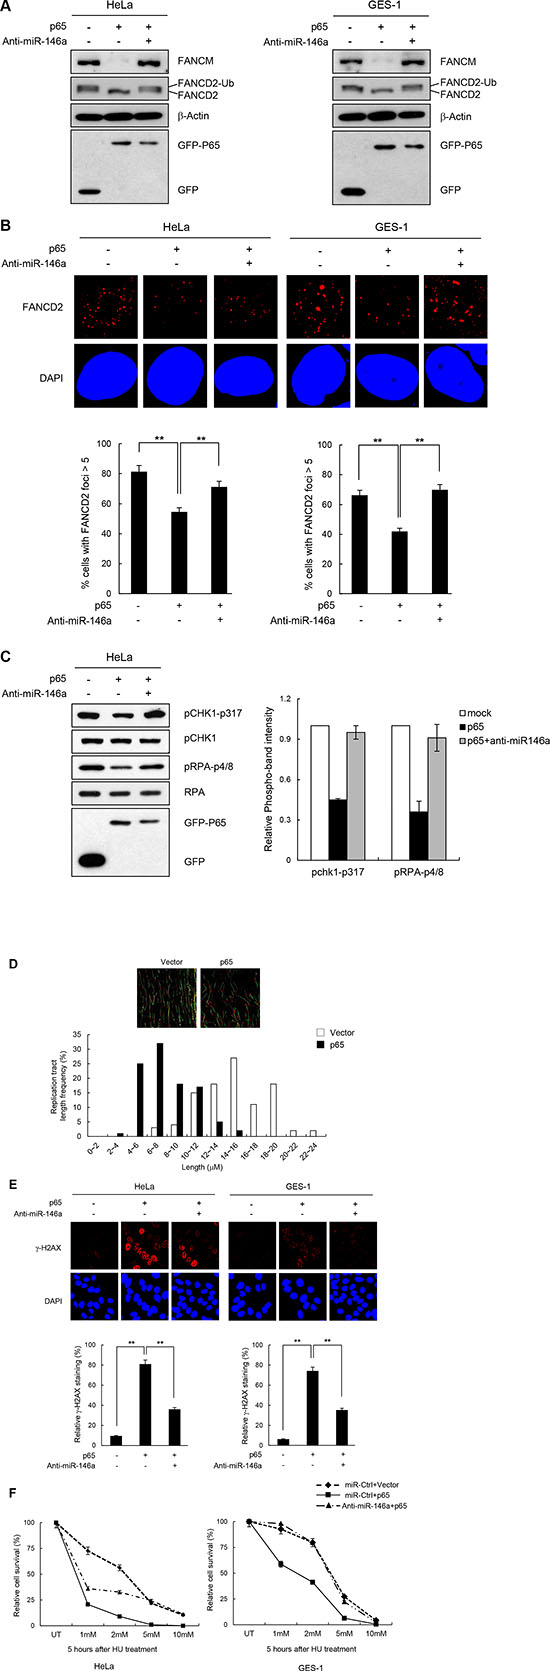
Figure 6: NF-κB reiterating miR146a function in the FA pathway and replication fork restart. (A) Two days after transfection of cells with p65 cDNA and anti-miR146a in combination as indicated, cells were treated with 5 mM HU for 5 h. The levels of FANCM and p63 proteins, and FANCD2 ubiquitination were measured by western blotting. (B) After undergoing the same treatment as (A) HeLa cells were analyzed for FANCD2 foci formation. Results are shown as the mean ± SD (n = 3); **P < 0.01. (C) Under the same conditions described in (A) cell lysates were analyzed by western blotting with antibodies against pCHK1-S317, CHK1, pRPA-S4/8, RPA, and GFP. Right, quantitation of pCHK1-S317 and pRPA-S4/8 expression. Results are shown as the mean ± SD (n = 3). (D) GES-1 cells transfected with p65 construct were applied to DNA fiber analysis. Resulting images of DNA fibers of p65-overexpressing cells compared with control cells (top). CldU tract length distribution was determined (bottom). (E) HeLa or GES-1 cells with the same treatment as A were subjected to γ-H2AX detection. Results are shown as the mean ± SD (n = 3); **P < 0.01. (F) HeLa and GES-1 cells were transfected with p65 construct and Anti-miR146a in combinations as indicated and were treated with different doses of HU for 5 hr. Cell survival thereafter was measured using clonogenic survival assay. Results are shown as the mean ± SD (n = 3); **P < 0.01.
H. pylori mediates down-regulation of FANCM
NF-κB is constitutively activated during inflammatory responses triggered by H. pylori infection [7–9, 31]. In addition, miR146a was recently identified as a target gene upregulated by H. pylori infection [32, 33]. Therefore we postulated that H. pylori infection may affect FANCM protein levels by upregulating NF-κB and miR146a in the GES-1 cells. First, to confirm that the inflammatory responses in GES-1 cells were induced by H. pylori infection, we assessed the cellular level of the interleukin (IL)-8 transcript using RT-qPCR and verified that its cellular level increased by ~80-folds after H. pylori infection compared to an untreated control (Supplementary Figure S8). IL-8 is one of the downstream genes whose expression is turned on by activated NF-κB when H. pylori infects gastric mucosa epithelial cells [34–36]. Next, to determine the cellular FANCM level, GES-1 cell lysates were analyzed by western blotting after 24 h of H. pylori infection. Consistent with the results from p65 overexpression in Figure 5C, FANCM protein levels were notably down-regulated in H. pylori-infected cells compared to untreated control cells (Figure 7A, left). Parallel RT-PCR analysis revealed that miR146a was up-regulated by H. pylori infection by ~3.5 fold compared to the control (Figure 7A, right). Importantly, the effects of H. pylori infection on FANCM expression were alleviated by the simultaneous treatment of anti-miR146a (Figure 7B), suggesting that these effects were largely due to miR146a expression.
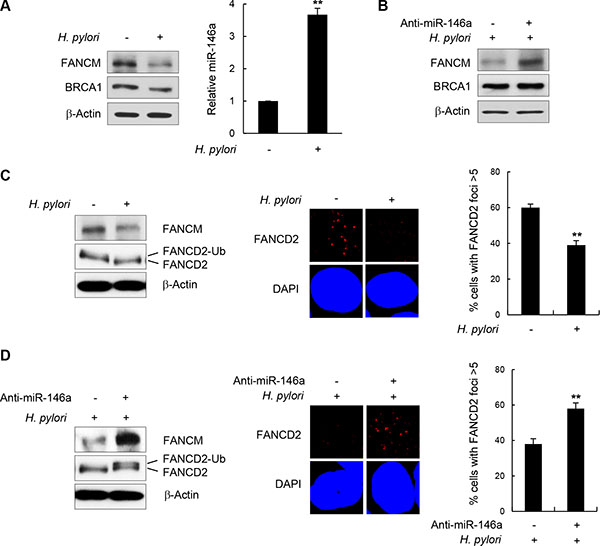
Figure 7: H. pylori-mediated FANCM regulation. (A) After infection of GES-1 cells with H. pylori, FANCM and BRCA1 protein levels were determined by western blotting (left). The effect of H. pylori on miR146a was determined by RT-qPCR (right). Results are shown as the mean ± SD (n = 3); **P < 0.01. (B) GES-1 cells infected with H. pylori were transfected with anti-miR146a, and FANCM and BRCA1 protein levels were determined by western blotting. (C) H. pylori -infected GES-1 cells were treated with 5 mM HU for 5 hours, FANCD2 monoubiquitination (left) and its foci forming activity (right) were examined by western blotting and immunostaining, respectively. Data respresent the mean ± SD (n = 3). **P < 0.01.(D) H. pylori-infected GES-1 cells were transfected with anti-miR146a and treated with 5 mM HU for 5 hours. FANCD2 monoubiquitinating activity (left) and subsequent foci formation (right) were measured by western blotting and fluorescent cell staining, respectively. Results are shown as the mean ± SD (n = 3). **P < 0.01.
Consistent with the reduction in FANCM levels, FANCD2 monoubiquitination and foci formation were reduced upon H. pylori infection (Figure 7C). In contrast, the effects of H. pylori on FANCD2 were largely reversed by transfecting anti-miR146a during H. pylori infection, as shown by recovery of both FANCD2 monoubiquitination and foci formation (Figure 7D). These findings indicate that H. pylori-induced inflammatory responses down-regulate FANCM expression by increasing cellular miR146a, whose expression is under the control of NF-κB.
DISCUSSION
In this study, we demonstrated that FANCM is a direct target of miR146a. Through bioinformatic searches, we identified the 3′UTR of FANCM as a binding site of miR146a, and confirmed this experimentally. Overexpression of miR146a suppressed the steady state level of FANCM, which was reversed by an antagomir. We showed that miR146a overexpression disrupted the several known FANCM-dependent processes, such as: FANCD2 monoubiquitination/foci formation, the FANCM-mediated checkpoint response, replication fork stability, and cellular resistance to cisplatin and HU. miR146a overexpression also led to the reduced RAD51 foci formation and increased double-strand break formation, although these phenotypes could be attributed to both impaired FANCD2 activation as well as BRCA1 expression. BRCA1 was previously reported to be a target of miR146a in a study which showed that miR146a overexpression reduced HR repair by BRCA1 downregulation [27]. Thus, we used BRCA1 as an internal control throughout our studies. Interestingly, we found that the effects of miR146a were recapitulated by overexpressing the p65 subunit of NF-κB, and that these effects were significantly reversed by the concomitant expression of anti-miR146a, suggesting that the effects caused by the NF-κB activation are largely due to miR146a. In order to utilize a more physiological inducer of miR146a expression, we employed H. pylori infection as a tool. Indeed, H. pylori led to a significant induction of miR146a, as well as reduced levels of FANCM and FANCD2 activation, which were reversed by anti-miR146a. Thus, our findings show that genome integrity is influenced by the functional link among pathogen-induced inflammation, NF-κB, and miR146a.
In light of the fact that implication of miR146a in tumorigenesis has been heavily discussed [5, 6, 26, 27, 37], our results further strengthen the notion that the aberrant expression of miR146a can increase tumorigenesis. Our finding that the breast cancer cell lines expressing a high level of miR146a failed to express the FANCM protein is particularly intriguing. Our work shows that the downregulation of FANCM at least in part contributes to the role of miR146a in compromising genome integrity. Although the statistically significant inverse correlation between miR146a and FANCM needs more extensive comparative studies in various types of cancer cells with clinical manifestation, our study provides the first line of evidence showing a negative correlation between endogenous miR146a and FANCM expression in breast cancer cell lines.
Our analysis suggests that the miR146a-mediated regulation of FANCM may be restricted to primates, based on the poorly conserved sequence within the FANCM 3′UTR. This finding suggests that sequences corresponding to the FANCM 3′UTR might have undergone massive species-specific gene rearrangements such as insertions and deletions and base substitutions after speciation since early vertebrate evolution [38]. Moreover, the alignment of the region spanning two miR146a target sites and their flanking regions were not applicable except in primates, nor were two target sites detected in the other species than primates through a BLAST search. This indicates that a regulation strategy for FANCM via miR146a has emerged as a relatively recent gain-of-function in the evolutionary history of vertebrate FANCM. As per the regulation of the FA pathway by miRNA, a several other FA-related genes such as BRCA1 and RAD51 were shown to be targeted by miRNAs [39–41].
Perhaps the most intriguing aspect of our work is the connection between pathogenic infection and disruption of genome integrity. Pathogens such as H. pylori have long been suspected as a potential carcinogen. Individuals afflicted with chronic infection of this microbe are at high risk for gastric cancer or gastric mucosa-associated lymphoid tissue lymphoma [42–44]. We found that miR146a expression was up-regulated by both H. pylori infection and NF-κB activation, the latter of which is regarded as a critical link between inflammation and cancer. While the contribution of inflammatory cytokines to inflammation-linked cancer susceptibility is now widely accepted, the DNA damage accompanying chronic inflammation has gradually gained attention as it can lead to gene mutations that can cause cancer [28, 45]. During inflammation, pro-inflammatory cytokines such as TNF-α, IL-1β, and IL-6, serve as the main way of communication between cells in different tissues and immune cells and trigger intracellular signaling cascades whose main feature is NF-κB activation [46–49]. miR146a is a well-known NF-κB-dependent gene but has also been reported to downregulate several signaling mediators involved in inflammatory responses such as TNF receptor-associated factor 6 (TRAF6) and IL-1 receptor-associated kinase 1 (IRAK1) that are located upstream of NF-κB activation, thus exerting a negative feedback loop for modulating NF-κB activity [4, 50, 51], which prevents constitutive activation of NF-κB during inflammatory response. On the other hand, NF-κB can be activated during the host cell response to bacterial infection (e.g., H. pylori in our study). H. pylori’s cell wall component peptidoglycan which is injected into gastric epithelial cells during infection, is recognized by the intracellular pattern recognition molecule, NOD1, eliciting the signaling cascade to activate NF-κB, which occurs independently of cytokine-triggered signaling cascades [7, 33, 52]. Our results demonstrate that GES-1 cells successfully responded to H. pylori infection, expressing IL-8 whose transcription is activated by NF-κB. Although additional studies on H. pylori-induced dampening of FA pathway activation in more physiological settings are needed, our finding that H. pylori influenced FANCM levels provides an understanding of the mechanism behind H. pylori-linked carcinogenesis. There are several ways to explain the mechanisms underlying genomic instability caused by H. pylori: i) H. pylori infection impairs mismatch repair and base excision repair by down-regulating component molecules [53, 54]; ii) H. pylori infection generates reactive oxygen species, causing oxidative damage of the DNA and genomic instability [55]; iii) specific oncogene activation in precancerous patient tissue samples is associated with double-strand breaks caused by H. pylori infection and the activation of DNA-damage checkpoints [56–58]. The disturbance of the FA pathway by H. pylori may not be critical for maintenance of the genomic integrity of terminally-differentiated gastric epithelial cells in the G0 phase. However, this pathogen would compromise the genomic integrity if the infection occurs in actively proliferating gastric epithelial progenitors [59]. Subsequent exposure to genotoxins such as ICL-inducing agents, which gastric epithelial cells have even higher chance to take up as food ingredients may also foster the gastric cancer development.
In summary, we demonstrated that miR146a decreased the FANCM protein level, thereby disabling FANCD2 activation upon DNA damaging agent treatment. Furthermore, we uncovered an important role of miR146a in NF-κB- and H. pylori- induced genomic instability. Our work suggests that dysregulated NF-κB activation and persistent H. pylori infection, both of which upregulate miR146a expression, can compromise genome integrity and potentially contribute to tumorigenesis in part by suppressing the DDR involving FANCM.
MATERIALS AND METHODS
Cell culture and treatment
The human cervical adenocarcinoma cell line HeLa, immortalized human normal gastric epithelial mucosa cell line GES-1, human gastric carcinoma cell line HGC-27, and human osteosarcoma bone morphogenetic cell line U2OS were purchased from the American Type Culture Collection (ATCC, Rockville, MD) and maintained as recommended: all of the cell types were cultured in Dulbecco’s Modified Eagle’s medium (Invitrogen, CA) supplemented with 10 % heat-inactivated fetal bovine serum (Invitrogen), 100 units/ml penicillin, and 100 μg/ml streptomycin sulfate (Invitrogen), and maintained in a humidified incubator containing 5% CO2 at 37oC. To induce replication fork stalling or ICL damage, exponentially growing cells were exposed to 5 mM HU or 1 mM cisplatin and allowed to recover at 37oC for 5 h.
H. pylori culture and infection
The H. pylori strain 26695 was obtained from HpKTCC (H. pylori Korean Type Culture Collection, Jinju, South Korea). The bacteria was grown in Brucella broth containing 10% fetal bovine serum, 10 μg/ml vancomycin, 25 μg/ml nalidixic acid and 5 μg/ml amphotericinB, and maintained in a humidified incubator containing 10% CO2 at 37oC. GES-1 cells were seeded at 10 × 105 cells/100 mm plate and grown to 70–80% confluency. H. pyroli infected the GES-1 cells at 100 MOI multiplicity of infection for 24 h. The infection was monitored by the release of IL-8.
Antibodies
The antibodies used for Western blotting were as follows: FANCM (sc-98710), FANCD2 (sc-20022), BRCA1 (sc-642), β-actin (sc-47778; Santa Cruz, CA), RPA (NA18; Calbiochem, CA), phosphor-RPA(S4/S8) (A300-245A; Bethyl Lab), CHK1 (2G1D5; Cell Signaling, MA) and phosphor-CHK1(S317) (AF2054; R&D System, MN). FANCD2 foci were detected by immunofluorescence staining using an anti-FANCD2 antibody (AB2187; Abcam). γ-H2AX foci were visualized by immunofluorescence staining using anti-γ-H2AX mouse monoclonal antibody (JBW301; Upstate Biotechnology, NY). RAD51 foci were detected by immunofluorescence staining using mouse monoclonal anti-RAD51 (14B4) (ab213; Abcam, MA).
miRNA luciferase reporter assay
Segments of the 3′UTR of FANCM containing putative miR146a binding sites were cloned into pMIR-REPORT firefly luciferase vector (Applied Biosystems, CA). Deletion mutants of predicted miR146a binding sites were made using the GENEART Site-Directed Mutagenesis kit (Invitrogen). For the luciferase activity assay, pMIR-REPORT luciferase vectors containing wild type or mutant 3′UTRs of FANCM and pRL-TK vector containing Renilla luciferase as a transfection control were co-transfected into HeLa cells using Lipofectamine 2000 (Invitrogen), and subsequently, the same cells were transfected with miR146a, anti-miR146a or RelA/p65 expression construct. After 24 h of transfection, the luciferase assay was performed using the dual luciferase reporter assay system (Promega, WI) according to the manufacturer’s instructions. Luciferase activity was quantified using a luminometer (Glomax, Promega).
NF-κB luciferase reporter assay
HeLa cells were seeded at a concentration of 5 × 10⁵ cells/well in 24-well plates. After overnight culture and reaching 80% confluence, the cells in each well were transiently transfected with 1 μg DNA consisting of pGL4.32 (luc2P/NF-κB-RE/Hygro) as a reporter (Promega), pRL-TK, as well as the RelA/p65 expression construct, in serum-free medium according to the manufacturer’s protocol. After 12 h, the transfection mix was removed and replaced with complete medium. Twenty-four hours after co-transfection, cells were harvested and luciferase activity was determined using the Luciferase Assay System (Promega, E1500).
miRNA and plasmid transfection
Hsa-miR146a duplex and negative control miRNA were purchased from Bioneer (Daejeon, South Korea). Cells were transfected with 50 nM miRNA using lipofectamine RNAiMax (Invitrogen) according to the manufacturer’s instructions. For rescue experiments, a miR146a inhibitor (anti-miR146a) was used. Full-length BRCA1 and FANCAM were cloned into pcDNA3-HA and pCMV-Flag vector, respectively, to generate mammalian expression vector. For experiments measuring NF-κB-mediated miR146a regulation, pcDNA HA-p65 vector was used. pcDNA-HA empty vector and scrambled oligonucleotide were used as negative controls.
Western blotting
Cells were lysed in RIPA buffer (50 mM Tris-HCl [pH 7.5], 150 mM NaCl, 1% Nonidet P-40, 0.5% sodium deoxycholate, 0.1% sodium dodecyl sulfate, 1 mM dithiothreitol, 1 mM phenylmethanesulfonyl fluoride, 10 μg/ml leupeptin and 10 μg/ml aprotinin). Equal amounts of cell or tissue extracts were separated by 6–12% SDS-PAGE gels followed by electrotransfer onto a PVDF membrane (Life Sciences, NJ). Western blots were performed by using the appropriate primary and secondary antibodies. The amounts of FANCM protein were quantified using Scion Image software (Scion Corp., MD).
Immunofluorescence staining
Cells cultured on cover slips were treated with 5 mM hydroxyurea or 1 mM cisplatin, allowed to recover for adequate times and then fixed in 4% paraformaldehyde and 98% methanol, followed by permeabilization with 0.3% Triton X-100. Then coverslips were blocked in 5% BSA in PBS and immunostained with primary antibodies and secondary antibodies conjugated with Alexa Fluor 488 (green, Molecular Probe, CA) or Alexa Fluor 594 (red, Molecular Probe). After washing, the coverslips were mounted onto slides using a Vectashield mounting medium with DAPI (Vector Laboratories, CV). Fluorescence images were taken using a confocal microscope (Zeiss LSM 510 Meta; Carl Zeiss) and analyzed with Zeiss microscopic imaging software ZEN (Carl Zeiss).
Array comparative genomic hybridization analysis
Array comparative genomic hybridization (CGH) analysis was performed using the Nimblegen Human CGH 12 × 135 K whole-genome tiling v3.1 Array (Agilent Technologies, CA). Human genomic DNA (1 μg) from human fibroblast GM00637 cells which were transfected with miR146a and reference DNA samples from control cells were independently labeled with fluorescent dyes (Cy3/Cy5), co-hybridized at 65°C for 24 h, and then subjected to the array. The hybridized array was scanned using NimbleGen MS200 scanner (NimbleGen Systems Inc., WI) with 2 μm resolution. Log2-ratio values of the probe signal intensities were calculated and plotted versus genomic position using Roche NimbleGen NimbleScan v2.5 software. Data are displayed and analyzed in Roche NimbleGen SignalMap software and CGH-explorer v2.55.
DNA fiber analysis
GES-1 cells were labeled with 25 μM 5-iodo-2′-deoxyuridine (IdU) for 20 min, followed by exposure to 5 mM HU for 5 h, and chased with 250 μM 5-chloro-2′-deoxyuridine (CldU) for 40 min. After labeled cells were harvested, DNA fibers were spread as previously described [60] before fluorescent staining for IdU and CldU tracts (with primary antibodies for IdU, (mouse α-BrdU (Sigma) at 1:25 dilution); and for CldU (rat α-BrdU (Sigma) at a 1:400 dilution) and secondary antibodies: anti-mouse IgG conjugated with AlexaFluor 488 and Cy3-conjugated anti-rat IgG, respectively, from Invitrogen). Fibers were visualized under a confocal microscope (Zeiss LSM 510 Meta) and analyzed using Zeiss microscopic imaging software ZEN (Carl Zeiss).
Clonogenic cell survival assay
After treatment of HU or cisplatin at different concentrations for 2 h, 5 ×10² cells were immediately seeded on 60-mm dishes in triplicate and grown for 2~3 weeks at 37oC to allow colonies to form. Colonies were stained with 2% methylene blue/50% ethanol and were counted. The fraction of surviving cells was calculated as the ratio of the number of colonies to the cell number at the time of seeding for the plating efficiency of treated cells over untreated cells. Cell survival results are reported as the mean value ± SD for three independent experiments.
RNA extraction and reverse rranscription-quantitative real-time PCR (RT-qPCR)
Total RNA was isolated from cultured cells, mouse tissues, and prostate cancer samples using TRIzol reagent (Invitrogen). For quantitation of FANCM and IL-8 mRNA, cDNA was synthesized using 1 μg total RNA, random hexamer (Promega) and M-MLV reverse transcriptase (Invitrogen). Real-time PCR analysis was performed using the SYBR green-based fluorescent method (SYBR premix Ex Taq kit, TaKaRa Bio) and the MX3000P® qRT-PCR system (Stratagene, CA) with specific primers. Primers used for real-time PCR are as follows: fancm forward, 5′-tgctcttcacaggagtggtg-3′ and fancm reverse, 5′-gggcacacaggaacttgact-3′; IL-8 forward, 5′-TTGGCAGCCTTCCTGATTTC-3′ and reverse 5′-AACTTCTCCACAACCCTCTG-3′. To quantify miRNAs, cDNA was synthesized using Mir-XTM miRNA first-strand synthesis and SYBR qRT-PCR kit (Clontech) according to the manufacturer’s instructions. Has-miR146a-MI0000477 was used as primer for real-time qPCR. The quantity of transcripts was calculated based on the threshold cycle (Ct) using the delta-delta Ct method that measures the relative of a target RNA between two samples by comparing them to a normalization control RNA (gapdh or U6).
Statistical analysis
Data in all of the experiments are presented as the mean ± standard deviation (SD) Statistical comparisons were performed using two-tailed paired Student’s t-test, where p < 0.01(**) was considered statistically significant. Analyses were performed using GraphPad Prism software (GraphPad software) and Excel (Microsoft).
ACKNOWLEDGMENTS
We are grateful to prof. JH Cha for help in culturing H. Pylori. We also thank all laboratory members that provided input and advice on this project.
CONFLICTS OF INTEREST
The authors declare that no conflicts of interest exist.
FINANCIAL SUPPORTS
This work is supported by the National Research Foundation of Korea (NRF), funded by the Ministry of Science, ICT, and Future Planning [NRF-2015R1A5A2009070].
REFERENCES
1. DiDonato JA, Mercurio F, Karin M. NF-kappaB and the link between inflammation and cancer. Immunol Rev. 2012; 246:379–400.
2. Wullaert A, Bonnet MC, Pasparakis M. NF-kappaB in the regulation of epithelial homeostasis and inflammation. Cell Res. 2011; 21:146–158.
3. Pasparakis M. Regulation of tissue homeostasis by NF-kappaB signalling: implications for inflammatory diseases. Nat Rev Immunol. 2009; 9:778–788.
4. Taganov KD, Boldin MP, Chang KJ, Baltimore D. NF-kappaB-dependent induction of microRNA miR-146, an inhibitor targeted to signaling proteins of innate immune responses. Proc Natl Acad Sci USA. 2006; 103:12481–12486.
5. Pacifico F, Crescenzi E, Mellone S, Iannetti A, Porrino N, Liguoro D, Moscato F, Grieco M, Formisano S, Leonardi A. Nuclear factor-{kappa}B contributes to anaplastic thyroid carcinomas through up-regulation of miR-146a. The J Clin Endocrinol Metab. 2010; 95:1421–1430.
6. Kogo R, Mimori K, Tanaka F, Komune S, Mori M. Clinical significance of miR-146a in gastric cancer cases. Clin Cancer Res. 2011; 17:4277–4284.
7. Viala J, Chaput C, Boneca IG, Cardona A, Girardin SE, Moran AP, Athman R, Memet S, Huerre MR, Coyle AJ, DiStefano PS, Sansonetti PJ, Labigne A, et al. Nod1 responds to peptidoglycan delivered by the Helicobacter pylori cag pathogenicity island. Nat Immunol. 2004; 5:1166–1174.
8. Allison CC, Kufer TA, Kremmer E, Kaparakis M, Ferrero RL. Helicobacter pylori induces MAPK phosphorylation and AP-1 activation via a NOD1-dependent mechanism. J Immunol (Baltimore, Md : 1950). 2009; 183:8099–8109.
9. Hutton ML, Kaparakis-Liaskos M, Turner L, Cardona A, Kwok T, Ferrero RL. Helicobacter pylori exploits cholesterol-rich microdomains for induction of NF-kappaB-dependent responses and peptidoglycan delivery in epithelial cells. Infect Immun. 2010; 78:4523–4531.
10. Kim H, D’Andrea AD. Regulation of DNA cross-link repair by the Fanconi anemia/BRCA pathway. Genes Dev. 2012; 26:1393–1408.
11. Kee Y, D’Andrea AD. Molecular pathogenesis and clinical management of Fanconi anemia. The J Clin Invest. 2012; 122:3799–3806.
12. Taniguchi T, Garcia-Higuera I, Andreassen PR, Gregory RC, Grompe M, D’Andrea AD. S-phase-specific interaction of the Fanconi anemia protein, FANCD2, with BRCA1 and RAD51. Blood. 2002; 100:2414–2420.
13. Murina O, von Aesch C, Karakus U, Ferretti LP, Bolck HA, Hanggi K, Sartori AA. FANCD2 and CtIP cooperate to repair DNA interstrand crosslinks. Cell Rep. 2014; 7:1030–1038.
14. Unno J, Itaya A, Taoka M, Sato K, Tomida J, Sakai W, Sugasawa K, Ishiai M, Ikura T, Isobe T, Kurumizaka H, Takata M. FANCD2 binds CtIP and regulates DNA-end resection during DNA interstrand crosslink repair. Cell Rep. 2014; 7:1039–1047.
15. Yeo JE, Lee EH, Hendrickson EA, Sobeck A. CtIP mediates replication fork recovery in a FANCD2-regulated manner. Hum Mol Genet. 2014; 23:3695–3705.
16. Knipscheer P, Raschle M, Smogorzewska A, Enoiu M, Ho TV, Scharer OD, Elledge SJ, Walter JC. The Fanconi anemia pathway promotes replication-dependent DNA interstrand cross-link repair. Science. 2009; 326:1698–1701.
17. Kim JM, Kee Y, Gurtan A, D’Andrea AD. Cell cycle-dependent chromatin loading of the Fanconi anemia core complex by FANCM/FAAP24. Blood. 2008; 111:5215–5222.
18. Gari K, Decaillet C, Stasiak AZ, Stasiak A, Constantinou A. The Fanconi anemia protein FANCM can promote branch migration of Holliday junctions and replication forks. Mol Cell. 2008; 29:141–148.
19. Gari K, Decaillet C, Delannoy M, Wu L, Constantinou A. Remodeling of DNA replication structures by the branch point translocase FANCM. Proc Natl Acad Sci U S A. 2008; 105:16107–16112.
20. Singh TR, Saro D, Ali AM, Zheng XF, Du CH, Killen MW, Sachpatzidis A, Wahengbam K, Pierce AJ, Xiong Y, Sung P, Meetei AR. MHF1-MHF2, a histone-fold-containing protein complex, participates in the Fanconi anemia pathway via FANCM. Mol Cell. 2010; 37:879–886.
21. Yan Z, Delannoy M, Ling C, Daee D, Osman F, Muniandy PA, Shen X, Oostra AB, Du H, Steltenpool J, Lin T, Schuster B, Decaillet C, et al. A histone-fold complex and FANCM form a conserved DNA-remodeling complex to maintain genome stability. Mol Cell. 2010; 37:865–878.
22. Tao Y, Jin C, Li X, Qi S, Chu L, Niu L, Yao X, Teng M. The structure of the FANCM-MHF complex reveals physical features for functional assembly. Nat Commun. 2012; 3:782.
23. Collis SJ, Ciccia A, Deans AJ, Horejsi Z, Martin JS, Maslen SL, Skehel JM, Elledge SJ, West SC, Boulton SJ. FANCM, FAAP24 function in ATR-mediated checkpoint signaling independently of the Fanconi anemia core complex. Mol Cell. 2008; 32:313–324.
24. Huang M, Kim JM, Shiotani B, Yang K, Zou L, D’Andrea AD. The FANCM/FAAP24 complex is required for the DNA interstrand crosslink-induced checkpoint response. Mol Cell. 2010; 39:259–268.
25. Xue X, Sung P, Zhao X. Functions and regulation of the multitasking FANCM family of DNA motor proteins. Genes Dev. 2015; 29:1777–1788.
26. Stuckrath I, Rack B, Janni W, Jager B, Pantel K, Schwarzenbach H. Aberrant plasma levels of circulating miR-16, miR-107, miR-130a and miR-146a are associated with lymph node metastasis and receptor status of breast cancer patients. Oncotarget. 2015; 6:13387–13401. doi: 10.18632/oncotarget.3874.
27. Garcia AI, Buisson M, Bertrand P, Rimokh R, Rouleau E, Lopez BS, Lidereau R, Mikaelian I, Mazoyer S. Down-regulation of BRCA1 expression by miR-146a and miR-146b-5p in triple negative sporadic breast cancers. EMBO Mol Med. 2011; 3:279–290.
28. Elstrodt F, Hollestelle A, Nagel JH, Gorin M, Wasielewski M, van den Ouweland A, Merajver SD, Ethier SP, Schutte M. BRCA1 mutation analysis of 41 human breast cancer cell lines reveals three new deleterious mutants. Cancer Res. 2006; 66:41–45.
29. Meetei AR, Medhurst AL, Ling C, Xue Y, Singh TR, Bier P, Steltenpool J, Stone S, Dokal I, Mathew CG, Hoatlin M, Joenje H, de Winter JP, et al. A human ortholog of archaeal DNA repair protein Hef is defective in Fanconi anemia complementation group M. Nat Genet. 2005; 37:958–963.
30. Schwab RA, Blackford AN, Niedzwiedz W. ATR activation and replication fork restart are defective in FANCM-deficient cells. Embo j. 2010; 29:806–818.
31. Moreira LO, Zamboni DS. NOD1 and NOD2 Signaling in Infection and Inflammation. Front Immunol. 2012; 3:328.
32. Liu Z, Wang D, Hu Y, Zhou G, Zhu C, Yu Q, Chi Y, Cao Y, Jia C, Zou Q. MicroRNA-146a negatively regulates PTGS2 expression induced by Helicobacter pylori in human gastric epithelial cells. J Gastroenterol. 2013; 48:86–92.
33. Belair C, Darfeuille F, Staedel C. Helicobacter pylori and gastric cancer: possible role of microRNAs in this intimate relationship. Clin Microbiol Infect. 2009; 15:806–812.
34. Crabtree JE, Xiang Z, Lindley IJ, Tompkins DS, Rappuoli R, Covacci A. Induction of interleukin-8 secretion from gastric epithelial cells by a cagA negative isogenic mutant of Helicobacter pylori. J Clin Pathol. 1995; 48:967–969.
35. Keates S, Hitti YS, Upton M, Kelly CP. Helicobacter pylori infection activates NF-kappa B in gastric epithelial cells. Gastroenterology. 1997; 113:1099–1109.
36. Chu SH, Kim H, Seo JY, Lim JW, Mukaida N, Kim KH. Role of NF-kappaB, AP-1 on Helicobater pylori-induced IL-8 expression in AGS cells. Dig Dis Sci. 2003; 48:257–265.
37. Xiao B, Zhu ED, Li N, Lu DS, Li W, Li BS, Zhao YL, Mao XH, Guo G, Yu PW, Zou QM. Increased miR-146a in gastric cancer directly targets SMAD4 and is involved in modulating cell proliferation and apoptosis. Oncol Rep. 2012; 27:559–566.
38. Siepel A, Bejerano G, Pedersen JS, Hinrichs AS, Hou M, Rosenbloom K, Clawson H, Spieth J, Hillier LW, Richards S, Weinstock GM, Wilson RK, Gibbs RA, et al. Evolutionarily conserved elements in vertebrate, insect, worm, and yeast genomes. Genome Res. 2005; 15:1034–1050.
39. Choi YE, Pan Y, Park E, Konstantinopoulos P, De S, D’Andrea A, Chowdhury D. MicroRNAs down-regulate homologous recombination in the G1 phase of cycling cells to maintain genomic stability. eLife. 2014; 3:e02445.
40. Huang JW, Wang Y, Dhillon KK, Calses P, Villegas E, Mitchell PS, Tewari M, Kemp CJ, Taniguchi T. Systematic screen identifies miRNAs that target RAD51 and RAD51D to enhance chemosensitivity. Mol Cancer Res. 2013; 11:1564–1573.
41. Moskwa P, Buffa FM, Pan Y, Panchakshari R, Gottipati P, Muschel RJ, Beech J, Kulshrestha R, Abdelmohsen K, Weinstock DM, Gorospe M, Harris AL, Helleday T, et al. miR-182-mediated downregulation of BRCA1 impacts DNA repair and sensitivity to PARP inhibitors. Mol Cell. 2011; 41:210–220.
42. Parsonnet J, Friedman GD, Orentreich N, Vogelman H. Risk for gastric cancer in people with CagA positive or CagA negative Helicobacter pylori infection. Gut. 1997; 40:297–301.
43. Group HaCC. Gastric cancer and Helicobacter pylori: a combined analysis of 12 case control studies nested within prospective cohorts. Gut. 2001; 49:347–353.
44. Parsonnet J, Isaacson PG. Bacterial infection and MALT lymphoma. N Engl J Med. 2004; 350:213–215.
45. Meira LB, Bugni JM, Green SL, Lee CW, Pang B, Borenshtein D, Rickman BH, Rogers AB, Moroski-Erkul CA, McFaline JL, Schauer DB, Dedon PC, Fox JG, et al. DNA damage induced by chronic inflammation contributes to colon carcinogenesis in mice. J Clin Invest. 2008; 118:2516–2525.
46. Renard P, Zachary MD, Bougelet C, Mirault ME, Haegeman G, Remacle J, Raes M. Effects of antioxidant enzyme modulations on interleukin-1-induced nuclear factor kappa B activation. Biochem Pharmacol. 1997; 53:149–160.
47. Wang L, Walia B, Evans J, Gewirtz AT, Merlin D, Sitaraman SV. IL-6 induces NF-kappa B activation in the intestinal epithelia. J Immunol. 2003; 171:3194–3201.
48. Hayden MS, West AP, Ghosh S. NF-kappaB and the immune response. Oncogene. 2006; 25:6758–6780.
49. Fitzgerald DC, Meade KG, McEvoy AN, Lillis L, Murphy EP, MacHugh DE, Baird AW. Tumour necrosis factor-alpha (TNF-alpha) increases nuclear factor kappaB (NFkappaB) activity in and interleukin-8 (IL-8) release from bovine mammary epithelial cells. Vet Immunol Immunopathol. 2007; 116:59–68.
50. Starczynowski DT, Kuchenbauer F, Argiropoulos B, Sung S, Morin R, Muranyi A, Hirst M, Hogge D, Marra M, Wells RA, Buckstein R, Lam W, Humphries RK, et al. Identification of miR-145 and miR-146a as mediators of the 5q- syndrome phenotype. Nat Med. 2010; 16:49–58.
51. Li Y, Vandenboom TG, 2nd, Wang Z, Kong D, Ali S, Philip PA, Sarkar FH. miR-146a suppresses invasion of pancreatic cancer cells. Cancer Res. 2010; 70:1486–1495.
52. Fox JG, Wang TC. Inflammation, atrophy, and gastric cancer. J Clin Invest. 2007; 117:60–69.
53. Kim JJ, Tao H, Carloni E, Leung WK, Graham DY, Sepulveda AR. Helicobacter pylori impairs DNA mismatch repair in gastric epithelial cells. Gastroenterology. 2002; 123:542–553.
54. Machado AM, Figueiredo C, Touati E, Maximo V, Sousa S, Michel V, Carneiro F, Nielsen FC, Seruca R, Rasmussen LJ. Helicobacter pylori infection induces genetic instability of nuclear and mitochondrial DNA in gastric cells. Clin Cancer Res. 2009; 15:2995–3002.
55. Touati E, Michel V, Thiberge JM, Wuscher N, Huerre M, Labigne A. Chronic Helicobacter pylori infections induce gastric mutations in mice. Gastroenterology. 2003; 124:1408–1419.
56. Bartkova J, Horejsi Z, Koed K, Kramer A, Tort F, Zieger K, Guldberg P, Sehested M, Nesland JM, Lukas C, Orntoft T, Lukas J, Bartek J. DNA damage response as a candidate anti-cancer barrier in early human tumorigenesis. Nature. 2005; 434:864–870.
57. Gorgoulis VG, Vassiliou LV, Karakaidos P, Zacharatos P, Kotsinas A, Liloglou T, Venere M, Ditullio RA Jr, Kastrinakis NG, Levy B, Kletsas D, Yoneta A, Herlyn M, et al. Activation of the DNA damage checkpoint and genomic instability in human precancerous lesions. Nature. 2005; 434:907–913.
58. Toller IM, Neelsen KJ, Steger M, Hartung ML, Hottiger MO, Stucki M, Kalali B, Gerhard M, Sartori AA, Lopes M, Muller A. Carcinogenic bacterial pathogen Helicobacter pylori triggers DNA double-strand breaks and a DNA damage response in its host cells. Proc Natl Acad Sci U S A. 2011; 108:14944–14949.
59. Karam SM, Tomasetto C, Rio MC. Amplification and invasiveness of epithelial progenitors during gastric carcinogenesis in trefoil factor 1 knockout mice. Cell Prolif. 2008; 41:923–935.
60. Jackson DA, Pombo A. Replicon clusters are stable units of chromosome structure: evidence that nuclear organization contributes to the efficient activation and propagation of S phase in human cells. J Cell Biol. 1998; 140:1285–1295.