
INTRODUCTION
Prostate cancer is the most common cause of cancer-related deaths globally and the incidence of prostate cancer has increased over the last two decades to be the second most commonly diagnosed cancer for males [1, 2]. The incidence of obesity has significantly increased during the same time, such that two in three men are now defined as overweight or obese [3]. While obesity is a major risk factor for many cancers, accounting for approximately one-third of cancer related deaths in 2012 [4], the epidemiological evidence linking obesity to prostate cancer incidence and disease outcomes is conflicting. Obesity has a mild or no association with prostate cancer incidence [5] but increases the risk of being diagnosed with advanced, high-grade prostate cancer [Relative Risk: 1.14 95% CI: 1.04–1.25] [6], increases biochemical recurrence after primary treatment [Relative Risk: 1.21 95% CI: 1.11–1.31] [5] and increases prostate cancer-specific mortality [Relative Risk: 1.15 95% CI: 1.06–1.25] compared to men of a healthy weight [5]. Thus, the weight of epidemiologic evidence suggests that obesity promotes aggressive prostate cancer, and provides a sound rationale to directly examine this association.
Murine studies support a pro-tumorigenic role for obesity in prostate cancer. Tumor mass and proliferation within xenografts derived from immortalized human prostate cancer cells (e.g. PC3 or LNCaP) are generally increased in mice rendered obese by high-fat feeding compared with lean mice fed a low-fat diet [7–10], while diet-induced obesity accelerates prostate cancer progression /aggressiveness in transgenic mouse strains of prostate cancer (e.g. TRAMP, Hi-Myc, Pten−/+) [9–15]. While these data are convincing, they are limited to immortalized metastatic cell lines and genetically modified mice, and studies using additional models that more closely replicate the biology of human prostate cancer are required to confirm these initial observations. In addition, these models do not faithfully mimic the structure/function relationship of the human prostate, which is covered anteriorly by a prominent peri-prostatic adipose tissue (PPAT). PPAT mass is increased in obese humans and is a risk factor for high-grade disease [16, 17], and the secreted factors from human PPAT are reported to promote tumorigenicity in cultured cells [18, 19]. Hence, PPAT is likely to be functionally relevant for prostate cancer progression.
Given that ~80% of prostate cancer patients have localized disease [20], we asked whether obesity presents a greater risk of developing an aggressive form of prostate cancer. Herein, we have utilized our well-established patient-derived xenograft (PDX) model [21] to address two clinically relevant inter-related questions: does obesity promote progression in moderate-grade localized human prostate cancer and/or, is the local impact of PPAT important in the tumorigenic process?
RESULTS
High-fat feeding recapitulates the features of an obese phenotype in SCID mice
SCID mice had similar body masses before allocation to the LFD or HFD (Figure 1B). Mice fed the HFD had an increased body mass compared with the LFD group at the time of surgery (Figure 1B, denoted by arrow), and this was entirely accounted for by a 48% increase in fat mass (Figure 1C). Body mass was greater in HFD vs. LFD mice throughout the period after PDX. Fat mass, but not lean mass (e.g. liver, heart, skeletal muscle), was different between groups after 15 weeks of high-fat feeding (Figure 1D), demonstrating the efficacy of the dietary regime to induce obesity.
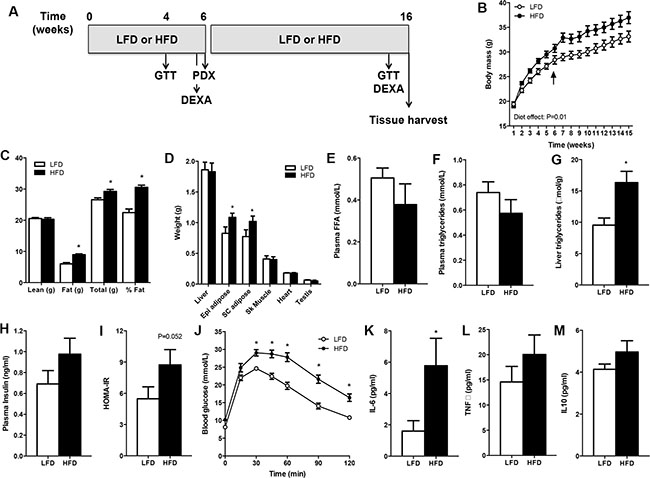
Figure 1: SCID mice develop diet-induced obesity. Mice were fed a low-fat (LFD) or high-fat diet (HFD) for 16 weeks. (A) Schematic of the study design. (B) Body mass. Arrow denotes PDX surgery. n = 10 for LFD, n = 9 for HFD. (C) Body composition assessed by DEXA. n = 10 for LFD, n = 9 for HFD. (D) Tissue weights of mice. n = 9 for LFD, n = 10 for HFD. (E) Plasma free fatty acid (FFA) concentration. n = 7 for LFD, n = 6 for HFD. (F) Plasma triglyceride concentration. n = 9 for LFD, n = 7 for HFD. (G) Liver triglyceride content. n = 9 for LFD, n = 7 for HFD. (H) Plasma insulin concentration. n = 7 for LFD, n = 6 for HFD. (I) Insulin sensitivity calculated by the homeostatic model assessment (HOMA). n = 7 for LFD, n = 6 for HFD. (J) Glucose tolerance of mice. n = 12 for LFD, n = 12 for HFD. (K) Plasma IL-6. n = 10 for LFD, n = 9 for HFD. (L) Plasma TNFa. n = 9 for LFD, n = 6 for HFD. (M) Plasma IL-10. n = 10 for LFD, n = 9 for HFD. Data presented in panel C was derived from mice aged 6 weeks, data in panels D-M was derived in mice aged 15–16 weeks. *P < 0.05 HFD vs. LFD. Statistical analysis for panels B and I was by two-way repeated measures ANOVA with Bonferroni post hoc testing. For panels C–H, data were compared by unpaired two-tailed t-tests. Data are presented as the mean ± SEM.
While serum free fatty acids (Figure 1E) and triglyceride (Figure 1F) levels were not different between groups, liver triglyceride content was increased by 216% in HFD vs. LFD mice (Figure 1G), demonstrating hepatic steatosis, which is a prominent comorbidity of obesity. Fasting serum insulin was increased by 41% (P = 0.08, Figure 1H) and the homeostatic model assessment of insulin resistance was increased by 60% (Figure 1I) in HFD vs. LFD mice, indicating that mice fed the HFD had impaired insulin sensitivity compared with LFD mice. Furthermore, HFD mice were remarkably glucose intolerant compared with littermates fed a LFD (Figure 1J). Obesity is often described as a low-grade inflammatory state and consistent with this notion plasma IL-6 was increased, and TNFa (P = 0.14) and IL-10 (P = 0.08) tended to increase, in obese vs. lean mice (Figure 1K, 1L, 1M). Collectively, these results indicated that the HFD created an obesogenic environment before xenograft implantation and that this was maintained throughout the grafting period.
High-fat feeding does not promote tumorigenesis in patient-derived xenografts grown in obese SCID mice
All patients had moderate-grade prostate cancer based on Gleason grade, prostate-specific antigen (PSA) and pathological stage (Table 1). We used immunohistochemistry on each patient specimen to determine the expression of proteins that frequently undergo alteration in prostate cancer, including PTEN, TMPRSS2-ERG, MYC and Nkx3.1. The results showed that although the clinic-pathological status was similar, there was heterogeneity in the genetic background of patients (Table 1).
Table 1: Patient information and genetic background
Patient |
PSA at diagnosis (ng/mL) |
Gleason score |
Pathological Score |
BMI |
Genetic Background/Status |
|||
|---|---|---|---|---|---|---|---|---|
PTEN |
MYC |
ERG |
Nkx3.1 |
|||||
1 |
3.6 |
(4 + 3) 7 |
pT3a |
24 |
Loss |
Amplification1 |
Negative |
Positive |
2 |
5.8 |
(3 + 4) 7 |
pT3a |
32 |
Low expression |
Negative |
Positive |
Positive |
3 |
n/a |
(4 + 4) 8 |
pT3a |
29 |
High expression |
Negative |
Negative |
Positive |
4* |
6.6 |
(3 + 4) 7 |
pT2c |
30 |
Low expression |
Negative |
Negative |
Positive |
5* |
4.8 |
(4 + 3) 7 |
pT3a |
26 |
Low expression |
Amplification1 |
Positive |
Positive |
6* |
11.6 |
(4 + 3) 7 |
pT3a |
26 |
Low expression |
Negative |
Negative |
Positive |
Patients 1–3 were used for study 1 (PDX in HFD and LFD).
Patients 4–6 were used for study 2 (PDX of prostate cancer + PPAT).
*Prostate cancer and PPAT samples were obtained from patients 4–6.
pT2c = Tumour is confined within the prostate but involves both lobes.
pT3a = Tumour has undergone extracapsular extension.
1Amplification leading to expression detected by immunohistochemistry.
Prostate cancer specimens were successfully grafted in SCID mice fed both LFD and HFD. Xenografts from all patients contained malignant tumors as shown by H&E pathology, α-methylacyl-CoA racemase (AMACR) expression and loss of p63+ basal cells (Figure 2A). The malignant regions were confirmed to be of human origin based on human-specific cytokeratin 8/18 expression (Figure 2A). Some grafts also contained adjacent benign glands, providing an accurate representation of the heterogeneity of human prostate specimens. Benign regions were excluded from further analysis. In addition, grafts from all patients expressed prostate cancer biomarkers including androgen receptor, PSA, and homeobox protein Nkx3.1 (Figure 2B). Overall, the pathology and biomarker expression of engrafted tissues was similar in the LFD and HFD groups.
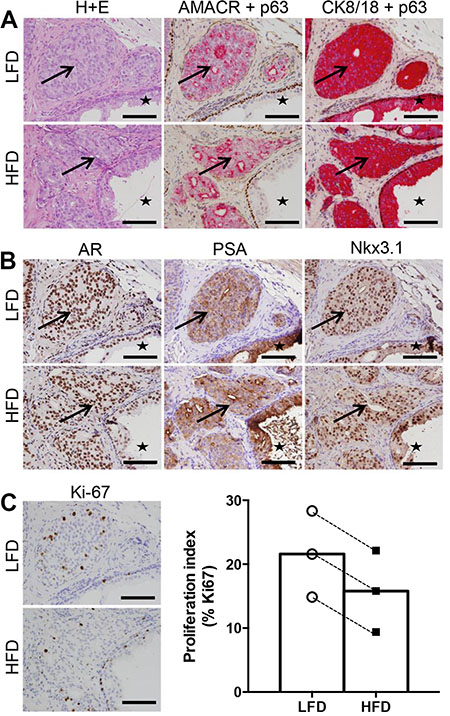
Figure 2: High fat feeding does not promote increased proliferation in patient-derived xenograft tissue. (A) Haematoxylin and eosin staining, dual immunohistochemistry of AMACR (red) and p63 (brown), cytokeratin 8/18 (red) and p63 (brown). Regions of cancer indicated by arrows, and benign glandular epithelium indicated by star in LFD and HFD xenograft tissue. (B) Immunolocalization of AR, PSA and Nkx3.1 in LFD and HFD xenografts. (C) Immunolocalization and percentage of Ki67 positive cells in LFD and HFD xenografts (n = 6 for LFD and n = 6 for HFD). Scale bars 100 μm in all images. Statistical analysis for panel C was by unpaired two-tailed t-test. Data are presented as the mean ± SEM.
The mass and size of grafts harvested from LFD and HFD treatment groups were not different (graft volume: LFD 9.56 ± 1.15 mm3 vs HFD 8.24 ± 1.62 mm3, P = 0.62. Supplementary Figure 1A). The presence of Ki67-positive tumor cells demonstrated malignant foci from all patients were actively proliferating (Figure 2C). Quantitation of Ki67 showed no significant difference between grafts grown in LFD or HFD SCID mice (Figure 2C). Together, these data demonstrate that tumorigenesis of human prostate xenografts was not exacerbated in obese mice.
Lipidomic analysis reveals no impact of obesity on the tumor lipid mass or composition
Alterations in lipid metabolism and remodelling of intracellular lipid pools have been implicated in the pathogenesis of various cancers [22]. Hence, we sought to determine whether obesity induced by high-fat feeding impacts the lipid profile in malignant prostate tissue. Quantitative assessment of the tumor lipidome revealed few significant differences between LFD and HFD mice. There were no differences in glycerolipids including triglycerides and diglycerides (Figure 3A), and these measures were supported by the observation of similar Oil Red O staining of neutral lipids between treatment groups (Figure 3B). The sphingolipid class contains important signalling and structural lipids implicated in cancer pathogenesis, and neither sphingomyelin, hydroxyshpingomyelin, ceramide, monohexosylceramide, dihexosylceramide, trihexosylceramide and dihydroceramide were different in the tumors of LFD and HFD mice (Figure 2C). Glycerophospholipids are critical membrane constituents and their production is required for tumor proliferation and growth [22]. There was no detectable difference in the glycerolphospholipid composition of the tumors between treatment groups (Figure 2D), including the major membrane constituents’ phosphatidlycholine, phosphatidylserine and phosphatidylethanolamine (Figure 2D). Similarly, members of the sterol lipids including cholesterol and cholesterol esters were not different between treatment groups (Figure 2E). Of the lipid types assessed, only bis (monoacylglycero) phosphate (BMP) was significantly different between groups, being increased by 120% in tumors from HFD vs. LFD mice (Figure 2F). Finally, we examined the proportion of saturated versus unsaturated fatty acids in the tumor lipidome, because increases in dietary saturated fatty acid intake is related to the risk of advanced prostate cancer [23]. The analysis showed that there was no significant differences between saturated (17.7% vs. 15.6%), monosaturated (16.5% vs. 16.9%) and polyunsaturated lipids (65.7% vs. 65.6%) in LFD vs. HFD mice (Figure 2G).
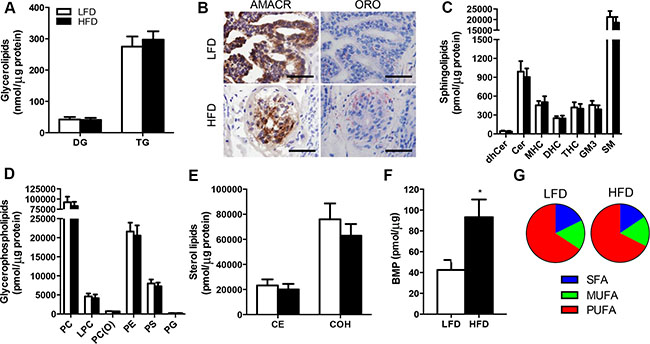
Figure 3: Lipidomic analysis reveals no effect of obesity on lipid deposition in the prostate cancer xenografts in SCID mice. (A) Glycerolipids in prostate tissue. DG, diglyceride; TG, triglyceride. (B) Immunolocalisation of AMACR and Oil Red O staining in malignant foci of LFD and HFD xenografts. Sections were frozen. Scale bars, 50 μm. (C) Sphingolipids in prostate tissue. dhCer, dihydroceramide; Cer, ceramide; MHC, monohexosylceramide; DHC, dihexosylceramide; THC, trihexosylceramide; GM3, GM3 ganglioside; SM, sphingomyelin. (D) Glycerophospholipids in prostate tissue. PC, phosphatidylcholine; LPC, lysophosphatidylcholine; PC(O), alkylphosphatidylcholine; PE, phosphatidylethanolamine; PS, phosphatidylserine; PG, phosphatidylglycerol. (E) Sterol lipids in prostate tissue. CE, cholesterol ester; COH, free cholesterol. (F) Bis(monoacylglycero)phosphate in prostate tissue. (G) Percentage of the prostate lipid pool composed of saturated (SFA), monounsaturated (MUFA) and polyunsaturated (PUFA) fatty acids. For all lipidomic analysis, n = 9 for LFD and n = 9 for HFD. *P < 0.05 HFD vs. LFD. Statistical analysis for individual lipids by unpaired two-tailed t-tests. Data are presented as the mean ± SEM.
Factors secreted from peri-prostatic adipose tissue promote tumorigenesis in cultured prostate epithelial cells
Given that obesity per se did not promote proliferation of human prostate cancer in mice, we reasoned that rather than a systemic mediator, factors secreted from the local PPAT may be important in prostate cancer tumorigenesis. As a proof-of-concept, we assessed whether human PPAT secretes factors that induce a pro-tumorigenic milieu in prostatic epithelial cells. PPAT conditioned medium increased proliferation compared to vehicle in PC3 cells (Figure 4A). We then utilized a bioengineered co-culture model where BPH-1 epithelial cells were grown on a bio-layer of human stromal cells (normal prostatic fibroblasts; Figure 4B showing experimental design and Supplementary Figure 2 showing confocal images). The BPH-1 cells were selected because they are non-tumorigenic but can be permanently transformed by the microenvironment to become tumorigenic [24]. Using the co-culture model, changes in BPH-1 morphology were assessed. PPAT conditioned medium significantly reduced mean shape factor, demonstrating a more elongated phenotype (Figure 4C–4D). Mean spread area, which is a measure of overall cell size, was significantly increased in BPH-1 cells treated with PPAT conditioned media (Figure 4E). Large elongated epithelial cells are consistent with progression to malignancy. Consistent with an invasive phenotype, BPH-1 cells were more motile as indicated by an increase in the mean length that cells travelled (Figure 4F). Together, these data demonstrate that factors secreted from PPAT promote a pro-tumorigenic environment.
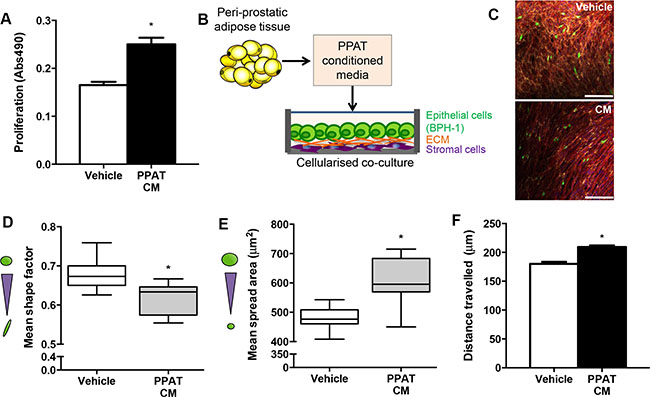
Figure 4: Secreted factors from periprostatic adipose induce a tumorigenic phenotype in a cellularized co-culture model. (A) Proliferation of PC3 cells grown in vehicle (CHO media alone) compared to vehicle media conditioned with PPAT secreted factors (CM, conditioned media) for 48 hours. Data are presented as the mean ± SEM (n = 6 per group from two independent experiments). (B) Schematic diagram of experimental design where conditioned media was obtained from human PPAT and applied to a cellularized co-culture model where human primary stromal fibroblasts produce naturally occurring extracellular matrix proteins (ECM) and provide a matrix for BPH-1 cells to be co-cultured for 24 hours. (C) Composite image of 3D co-culture components including normal prostatic fibroblasts stained for fibronectin extracellular matrix secretions (yellow), F-actin in fibroblasts (red), BPH-1 cells labelled with cell tracker green and DAPI staining of cell nuclei (blue). Images obtained using immunofluorescent labelling and confocal microscopy. Scale bar = 50 μm. Quantitation of morphological parameters including (D) shape factor (measure of elongation; n = 7 from independent donors), (E) spread area (cell size; n = 10 from independent donors) and (F) cell migration determined by mean length travelled (n = 4 from independent donors, n = 184 cells assessed for Vehicle; n = 947 cells assessed for PPAT CM). Statistical analysis by unpaired two-tailed t-tests. Data are presented as the mean ± SEM.
Periprostatic adipose tissue does not influence patient-derived xenograft tumorigenesis in SCID mice
To investigate the direct effects of human PPAT on prostate cancer proliferation, we co-grafted patient-matched PPAT with prostate cancer tissues (Figure 5A). This approach was used to recapitulate the close interaction between tumor cells and adipose tissue in vivo [25]. Visual inspection of harvested grafts confirmed the presence of human PPAT overlaying prostate cancer tissues (Figure 5A) and histological assessment showed the presence of adipocytes adjacent to and within human prostate tissue in co-grafted tissues (Figure 5B). Notably, adipose tissue was not present in prostate cancer only xenografts and there was no evidence of infiltrating adipocytes (Figure 5B). All xenografts contained prostate cancer tissue confirmed by AMACR expression and loss of p63+ basal cells, and there was no obvious difference in pathology between groups (Figure 5C). Consistent with these observations, tumor cell proliferation was not different between groups as demonstrated by quantitation of Ki67 expression (Figure 5C). The graft volume was not different between groups (PDX 8.14 ± 0.86 mm3 vs HFD 10.05 ± 0.84 mm3, P = 0.29. Supplementary Figure 1B).
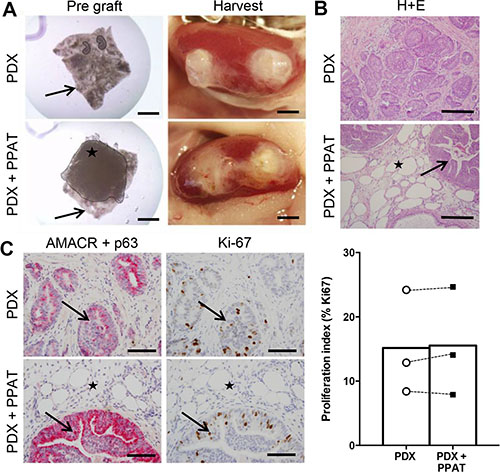
Figure 5: Periprostatic adipose tissue does not promote tumorigenesis in patient-derived xenograft tissues. (A) Whole mount images of PDX grafts prior to (left panels) and after (right panels) transplantation. PDX grafts contained prostate cancer tissue alone (top panels) or prostate cancer tissue plus human PPAT (bottom panels). Star indicates PPAT spread over the prostate cancer tissue (black arrow). (B) Haematoxylin and eosin staining of PDX grafts alone and PDX + PPAT xenografts showing the presence of adipocytes (star) in close proximity to tumor foci (arrow). (C) Dual immunohistochemistry of AMACR (red) and p63 (brown) demonstrates malignant foci (arrows) in PDX grafts alone and PDX + PPAT xenografts, with adipocyte infiltration (star) seen in PDX + PPAT tissues. Immunolocalization and quantitation of Ki67 positive cells in PDX grafts alone and PDX + PPAT xenografts. Scale bars, 2 mm (A), 200 μm (B) and 100 μm (C). Statistical analysis for panel C was by unpaired two-tailed t-test. Data are presented as the mean ± SEM (n = 3).
DISCUSSION
Large prospective studies report a significant association with obesity for many cancers and obesity is now considered a leading preventable cause of cancer [26, 27]. With respect to prostate cancer, obesity is associated with a small or no increase in prostate cancer incidence but diagnosis of more aggressive, high grade prostate cancer, with poorer prognosis [5]. Despite these associations, there remains a lack of direct evidence linking obesity to accelerated growth of human prostate cancer [25]. Herein, we utilized PDXs of moderate-grade localized human prostate cancer tissues and report two significant findings; that 1) prostate cancer tumorigenicity is not accelerated in the setting of rodent obesity and, 2) PPAT does not exacerbate prostate cancer pathogenesis in vivo.
Given the apparent impact of obesity on disease pathogenesis, several studies have attempted to recapitulate the obesity phenotype in rodent models of prostate cancer. These studies utilizing either injectable immortalized human cancer cells [7, 8] or transgenic mice including TRAMP [9, 10, 12], Pten [15] and Hi-Myc [13] have generally shown that prolonged high-fat feeding accelerates prostate cancer progression as demonstrated by increased tumor volume, proliferation, neoplastic progression, epithelial-mesenchymal transition, metastasis and mortality (see review [25]). While supporting a causative link between obesity and prostate cancer progression, it is notable that these oncogene-driven transgenic mouse models do not faithfully model human prostate cancer development. We sought to overcome these limitations by transplanting localized human prostate cancer [21] into lean and obese mice. We validated the experimental model by demonstrating that SCID mice fed a high-fat diet exhibited the hallmarks of obesity including increased fat mass, fatty liver, fasting hyperglycemia, glucose intolerance, insulin resistance and low-grade inflammation. We combined this obese phenotype with an efficient and reproducible PDX approach that has been optimized to maintain survival and proliferation of human prostate cancer tissues. Notably, we utilized specimens from men with moderate-grade localized prostate cancer rather than high-grade localized or metastatic disease. Using the combination of these validated models and detailed histological analyses, we failed to show that obesity promotes prostate cancer proliferation, at least in these moderate-grade localized human prostate cancer tissues. With respect to study design, the duration of the dietary intervention was comparable to previous studies in transgenic mice (i.e. 10 weeks), and well within the time frame required to modulate proliferation in PDX models. For example, changes in proliferation can be detected within 3 days after castration and 4 weeks after testosterone administration [28, 29], or after 1 week of other androgen-targeted agents, such as Enzalutamide (Taylor, unpublished data).
Obesity is associated with infiltration of immune cells into adipose tissue, which contributes to a state of low-grade inflammation [30], and chronic inflammation is regarded as an enabling characteristic of human cancer [31]. While SCID mice are commonly used for cell and tissue transplantation studies, the absence of mature B and T cells in these mice may pose a potential limitation to the interpretation of our work. However, the pro-inflammatory cytokines implicated in prostate cancer pathogenesis, including IL-6, TNFa and IL-10, were readily detected in serum at concentrations reported in other mouse lines [32], and IL-6 was significantly increased in obese compared with lean mice. This is consistent with the small, but significant changes that occur for most circulating pro-inflammatory cytokines when transitioning from the lean to obese state (i.e. < 5 pg/mL). In prostate cancer, the levels of serum IL-6 range from 1.5–2.2 pg/mL in localized and locally invaded tumors, which is well below the serum levels reported (~100 pg/mL) when metastatic disease ensues [33, 34]. Moreover, IL-6 is produced by prostatic stromal cells, including endothelial cells and macrophages, and appears to act in a paracrine manner in prostate tissue [35]. Thus, the modest obesity-induced pro-inflammatory milieu, involving small increases in systemic IL-6, are unlikely to impact the local IL-6 concentrations and accelerate inflammation-driven cancer progression. In addition, other pro-inflammatory cytokines/chemokines including TNFa, MCP-1, IL-8, or IL-1ß are not increased in prostate cancer patients. On balance, these observations suggest that obesity-associated inflammation is not a primary driver of prostate cancer progression.
It has been increasingly recognized that alterations in lipid metabolism are a hallmark of cancer [22, 31] and some evidence indicates that prostate cancer is associated with an increased reliance of fatty acid as a metabolic fuel and as a precursor for phospholipid production to generate cell membranes [36, 37]. Accordingly, we aimed to define the lipid profile of human prostate cancer tissues and hypothesized that obesity would alter the lipidome, potentially identifying a signature that might be prognostic for aggressive disease. Unbiased mass spectrometry analysis revealed no significant differences in the quantity of lipids (with the exception of Bis (Monoacylglycero)Phosphate), the type of lipids species detected or the degree of saturation within the prostatic lipid pool in prostate cancer PDX grafts from lean and obese mice. These results were surprising because the uptake and storage of fatty acids in almost all tissues is considered a pathogenic feature of obesity [38]. While lipid kinetics were not assessed in our studies, these results indicate that fatty acid uptake and storage are unaffected, and/or oxidative disposal of fatty acid is increased in the prostate PDX grafts in obesity. Further studies are needed to clarify whether changes in lipid metabolism are related to prostate cancer progression.
The only lipid that was increased in PDX grafts from HFD compared to LFD mice was BMP, an anionic phospholipid found in the lysosomal membrane. BMP contains a large quantity of hydrolases, known as cathepsins, which have been implicated in human cancer metastasis to breast and lung cancer [39, 40]. Whether alterations in BMP are important in prostate cancer is unknown, but given the similarity in the proliferation index in PDX grafts from lean and obese mice, it is unlikely that small changes in BMP are sufficient to drive prostate cancer progression.
Aside from obesity-driven systemic effects, it is also possible that secreted factors from the local PPAT influence the prostatic milieu to direct prostate cancer growth, invasion and possibly distant metastases. This view is based on the clinical observation that PPAT quantity is increased in obesity and is a risk factor for both the diagnosis of prostate cancer and predicting high-grade disease [41, 42]. In addition, in vitro studies have reported that factors secreted from PPAT increase proliferation and motility in PC3 prostate cancer cells, and that the PPAT-secreted factors from obese patients are more pro-tumorigenic than those from lean patients [18, 43]. We confirmed and extended on the key results of these in vitro studies by demonstrating pro-tumorigenic effects of PPAT-secreted factors in a cellularized co-culture model that incorporates human primary stromal-epithelial interactions, which more closely mimics the tumor microenvironment [24]. Ongoing studies are delineating the bioactive factors secreted from PPAT that may influence prostate cancer progression.
In order to understand the relevance of PPAT in promoting prostate cancer pathogenesis in vivo, we co-grafted human PPAT with prostate cancer tissues to mimic the prostate/PPAT anatomical relationship. Histological analysis showed successful harvest of both tissue types, evidence of adipocyte infiltration into the prostatic tissue and direct contact between cancer cells and adipocytes, mimicking an aggressive stage of disease involving local invasion [25]. Despite the knowledge that the PPAT secreted milieu is pro-tumorigenic in culture, we saw no evidence of increased proliferation in the prostate cancer grafts grown in association with PPAT compared to prostate cancer tissues grafted alone. Taken together, our data indicate that PPAT secreted factors can promote prostate cancer tumorigenesis in vitro, however, the secretion rates in vivo and the potential for dilution of PPAT-secreted factors through the systemic circulation question the absolute effect in vivo.
In conclusion, it is now 75 years since the initial observation that high-fat feeding induces obesity and promotes cutaneous tumor formation in mice [44]. While the epidemiological evidence indicates that obesity is associated with worse outcomes for prostate cancer patients, our data question a causative role for obesity in driving prostate cancer proliferation in moderate-grade localized disease, which is a common form of prostate cancer. However, we cannot discount that obesity may exacerbate tumorigenesis in high-grade prostate cancers, and this will be the subject of future investigations.
MATERIALS AND METHODS
Human ethics approval and collection of human tissues
Ethics approval was obtained from Cabrini Institute (07-07-04-14), Epworth Hospital (618-13) and Monash University Human Research Ethics Committees (RMO 2006/6108 – 2004000145). Patients provided informed written consent to medical treatment reports and the collection of fresh prostate tumor tissue. Treatment notes were accessed through physicians, hospitals and diagnostic laboratories. Fresh primary prostate cancer tissues were obtained from six patients at the time of radical prostatectomy. All patients had moderate-grade prostate cancer based on Gleason grade, prostate-specific antigen (PSA) and pathological stage (Table 1). The body mass index of patients averaged 28 ± 1 kg/m2, placing them in the overweight range. Pathologists dissected a tumor region for this study, which was subsequently transported to the laboratory in RPM1 1640 supplemented with 10% fetal calf serum (FCS), 1% penicillin-streptomycin, 0.5 μg/ml amphotericin B antimycin and 100 μg/ml gentamicin. For studies utilizing peri-prostatic adipose tissue (PPAT), patient matched adipose tissue samples were collected at the time of radical prostatectomy (patients 4–6; Table 1). PPAT was transported to the laboratory in RPMI media (Gibco, CA, USA) supplemented with 5 mM glucose (Sigma-Aldrich, MI, USA), 500 nM adenosine (Sigma-Aldrich, MI, USA) and 10 mg/ml of fatty acid free bovine serum albumin (Bovogen Biologicals, Australia).
Animal ethics and experimental design
All procedures were approved by The Monash Animal Research Platform (MARP) Animal Ethics Committee (MARP/2012/158) and were performed in accordance with Australian National Health and Medical Research Council Guidelines on Ethics in Animal Experimentation. Severe combined immunodeficiency (SCID) mice were obtained from the Animal Resources Centre (Perth, Australia) and were housed three mice per cage. Mice were kept on a 12-hour light, dark cycle with ad libitum access to food and water. Mice were either fed a standard low-fat diet (LFD, n = 12) (6% energy from fat, 20% protein, 74% carbohydrate; Barastoc, Ridley Corporation, Melbourne, Victoria, Australia) or a high-fat diet (HFD, n = 12) (43% energy from fat, 21% protein, 36% carbohydrate; SF04-001, Speciality Feeds) starting at five weeks of age. There were subtle differences in the macronutrient content of the diet, most notably the protein source, which was derived from casein in the HFD and from several sources in the LFD. The vitamin and mineral contents of the diets were similar (Supplementary Table 1). Mice were maintained on these diets for six weeks prior to PDX surgery. Mice aged 11 weeks underwent PDX surgery and were maintained on their respective diets for a further 10 weeks. In experiments designed to assess the effects of PPAT on human prostate cancer proliferation, all mice were fed a standard LFD. Body mass was monitored bi-weekly, glucose tolerance was assessed two weeks prior to PDX surgery and 10 weeks following surgery, and body composition was assessed two days prior to surgery (Figure 1A).
Patient-derived xenografts
Grafts were implanted under the kidney capsule of SCID mice as described previously [21]. Briefly, prostate specimens were sliced into 300 μm sections using the Krumdieck tissue slicer (Model number MD6000, Alabama Research and Development, AL, USA), with approximately every 5th section being fixed in formalin for pre-grafting histology. The remaining tissue slices were stored in RPMI/10% FCS/10 nM testosterone at 4°C until PDX preparation. Systematic precision-cutting of tissue slices allowed for pair-matched analysis between pre-grafted tissues, and PDX groups, thereby accounting for differences in tumor composition between individual pieces. Prostate tissue slices were combined with ~250,000 mouse seminal vesicle mesenchyme cells to aid the survival and growth of prostate PDXs in vivo. The seminal vesicle mesenchyme was isolated from day 0 BALB/c male mouse pups (Monash Animal Services). Xenografts were transplanted under the kidney capsule of host SCID mice for 10 weeks. Each host mouse was implanted with two grafts per kidney. At the time of graft surgery, host mice were implanted with a 5 mm testosterone implant to supplement the host testosterone levels. For analysis of the effects of a LFD or HFD on prostate cancer proliferation, three individual prostate donor tissues were utilized, and grafts were evenly divided between three LFD and three HFD SCID mice per patient.
For PPAT studies, PDX tissues were grafted as previously described with minor modifications [21]. Specifically, half of the PDX tissues were prepared without PPAT while the other half of the PDX tissues were combined with pieces of patient matched PPAT tissue (~ 4 mm × 4 mm × 1 mm pieces) prior to renal grafting. Adipose tissue was placed directly over the prostate tissue within the collagen gel as shown in Figure 5A, and the collagen gel containing the tissues was grafted under the kidney capsule. The PDX tissues without PPAT were grafted under the capsule of the contralateral kidney. For analysis of PPAT effects on prostate cancer proliferation, a further three patient tissues were utilized, with PDX tissue alone or PDX + PPAT grafts produced for each patient.
Glucose tolerance test
Mice were fasted for four hours (0700–1100 h) then injected with D-glucose (2 g/kg body mass) in the intraperitoneal cavity. Blood glucose was measured using a glucometer (Accu-chek, Roche, Mannheim, Germany) before and at 15 min intervals for 120 min after glucose administration.
Assessment of body composition
Body composition was analyzed using Dual Energy X-ray absorptiometry (DEXA; Lunar Pixi, PIXImus, WI, USA) as described previously [45].
Tissue collection
Ten weeks after PDX surgery, mice were fasted for four hours (0700–1100 h) then euthanized via cervical dislocation. Blood was collected by cardiac puncture, placed in an ethylenediaminetetraacetic acid collection tube and left of ice for 5 mins. Plasma was separated by centrifugation at 8000 × g for 10 mins and stored at −80°C until analysis. The livers of mice were dissected and rapidly frozen in liquid N2 for later analysis. Prostate cancer xenografts were removed from the kidney grafting site, with three grafts per mouse rapidly frozen in liquid N2 for later lipid analysis. The remaining graft per mouse was fixed in 10% neutral buffered formalin (Sigma-Aldrich, MA, USA) for 24 h before being processed and embedded in paraffin (n = 3 per patient/per diet group) for histological analysis.
Histological analysis
PDX tissues were sectioned (5 μM) and every 20th tissue section was used for analysis. Immunohistochemistry analysis was performed using the Leica BOND-MAX automated system (Leica Microsystems, Victoria, Australia) or manually using the Dako EnVision™ detection system (Dako, California, USA). Primary and secondary antibody details and staining conditions are outlined in Supplementary Table 2. Ki67 immunohistochemical staining was performed on three representative sections from each fixed xenograft. Slides were scanned using the Aperio ScanScope AT Turbo (Leica Microsystems GmbH, Germany) and positive cells were determined using Aperio ImageScope analysis software (version 12.2).
Plasma hormones and metabolites
Plasma insulin was determined using an Ultra-Sensitive Mouse Insulin ELISA Kit (Crystalchem, IL, USA) according to manufacturer’s instructions. Plasma free fatty acid concentration was determined using an enzymatic colorimetric assay (NEFA C Kit; Wako Chemicals, Richmond, VA, USA). Plasma triglyceride levels were determined using a colorimetric assay (Triglycerides GPOPAP; Roche Diagnostics, IN, USA).
Liver triglyceride content
Lipids were extracted from ~20 mg of liver in chloroform: methanol: PBS + 0.2% SDS (1:2:0.8) using a handheld homogenizer (Pro Scientific, Oxford, CT, USA). After brief centrifugation (1,000 × g for 10 min), the organic phase containing the lipids was transferred to a fresh tube and dried under N2 at 40°C. The dried lipid was reconstituted in ethanol and the triglyceride levels were determined using the triglyceride GPOPAP assay (Roche Diagnostics, IN, USA).
Lipid extraction and MS analysis
Lipid extraction and MS analysis was performed as described previously [46]. In brief, prostate cancer xenografts were harvested and stored at −80°C prior to lipid extractions. The whole prostate cancer xenograft was homogenized in ice-cold 1 X PBS and lipids were extracted using chloroform: methanol (2:1). Samples were dried and reconstituted in water saturated butanol and methanol followed by the addition of internal standards in chloroform:methanol (1:1, 15 μl). Lipid analysis was performed on the samples by liquid chromatography electrospray ionization-mass spectrometry/mass spectrometry using an Agilent 1200 liquid chromatography system (Agilent, CA, USA) and Applied Biosystems API 4000 Q/TRAP mass spectrometer with a turbo-ionspray source (Applied Biosystems, CA, USA) and Analyst 1.5 and Multiquant data systems (Sciex, MA, USA). Quantitative analysis of individual lipid species was performed using Multiquant v1.2 and the cellular content of each lipid class was calculated by summing each lipid species within that class.
PPAT conditioned media preparation
For conditioned media collection, approximately 1–3 g of fresh PPAT tissue was diced into ~25 mg pieces and incubated in EX-CELL™ 325 PF CHO Serum-Free Medium, Protein Free (Sigma-Aldrich, MI, USA) supplemented with 5 mM glucose (Sigma-Aldrich, MI, USA), protease inhibitor cocktail (Roche, Bavaria, Germany) and 500 nM adenosine (Sigma-Aldrich, MI, USA) for 5 hours at 37°C in 5% CO2. Prior to use for cell culture, conditioned media was passed through a 0.22 μm filter and supplemented with 5% heat inactivated fetal calf serum (Gibco, CA, USA), antibiotics (10,000 U/mL penicillin and 10,000 μg/mL streptomycin; Gibco, CA, USA) and 1 nM testosterone (Sigma-Aldrich, MI, USA).
In vitro co-culture
Primary normal prostate fibroblasts were isolated from prostate specimens [21, 47] and co-culture experiments were performed as previously described. Briefly, fibroblasts were seeded at 1.5 × 10⁴ in 24 well plates and were grown in RPMI media (School of Biomedical Sciences, Media Prep Services, Monash University, Victoria, Australia) supplemented with 5% FCS (Gibco, CA, USA), antibiotics (10,000 U/ml penicillin and 10,000 μg/mL streptomycin, Gibco, CA, USA), 1 nM testosterone (Sigma-Aldrich, MI, USA) and 10 ng/mL FGF (Millipore, MA, USA) at 37°C, 5% CO2 for approximately 7 days to allow confluency and secretion of extracellular matrix. Then 1.5 × 10⁴ BPH-1 epithelial cells (obtained from S. Hayward, Vanderbilt), pre-stained with Cell Tracker green CMFDA (5-chloromethylfluorescein diacetate; ThermoFisher Molecular Probes, MA, USA) were seeded on top of the fibroblasts. At this time, co- culture media was changed to PPAT conditioned media and cells were cultured for a further 24 hours at 37°C, 5% CO2.
Immunofluorescence staining
Matrix proteins were visualized using immunofluorescence for both fibronectin (ECM) and phalloidin (F-actin). To permeabilize cell membranes, cells were washed with 0.1% Triton X-100 (BDH Prolabo, Queensland). To reduce non-specific binding, cells were incubated with 1% bovine serum albumin (BSA; Sigma-Aldrich, MO, USA) for 10 min at room temperature before incubation in anti-fibronectin mouse monoclonal antibody (HFN7.1; 1:200 dilution) (Abcam, UK) at room temperature for 40 min. Cells were incubated with secondary antibodies for 30 min at room temperature. These included goat anti-mouse isotype specific IgG1 antibody tagged with alexa fluro 647 (Invitrogen Molecular Probes, California, USA; 1:400 dilution) for fibronectin, rhodamine phalloidin (Invitrogen Molecular Probes, California, USA; 1:300 dilution) to detect actin filaments, and DAPI (Invitrogen Molecular Probes, California, USA) to visualize cell nuclei. Cells were then washed with PBS and left at 4°C in PBS until imaging.
Morphological analysis
Co-culture plates were imaged using a Leica DM IL LED inverted fluorescent microscope (Leica Microsystems, Victoria, Australia). Assays were performed in duplicate with three technical replicates per well and analyzed as the combined mean of six images per fibroblast line. Quantitative analysis of BPH-1 cell morphology was performed using ImageJ software [48]. Parameters analyzed included shape factor, spread area and mean length travelled, which provides a measure of motility.
Proliferation assay
For proliferation assays, 3 × 10³ PC3 cells (ATCC, VA, USA) were seeded into 96 well plates and incubated in Vehicle or PPAT conditioned media for 48 hours. The “Vehicle” medium contained EX-CELL™ 325 PF CHO Serum-Free Medium, Protein Free medium supplemented with 5% heat inactivated fetal calf serum and antibiotics. The “Conditioned Medium” consisted of the same base ingredients plus PPAT secreted factors (described above). The Cell Titre 96 Aqueous One assay (Promega, WI, USA) was used to assess cell proliferation and absorbance was measured at 490 nm using a FLUOstar Optima plate reader (BMG LABTECH, Baden-Wüttemberg, Germany).
Statistical analysis
All data presented as means ± SEM. Data were analyzed by two-tailed unpaired student’s t-tests or two-way repeated measures analysis of variance, with a Bonferroni multiple comparisons post-hoc test where appropriate. Statistical significance was determined a priori at P < 0.05.
ACKNOWLEDGMENTS
We thank Brooke Pereira, Brindi Niranjan and Keith Schulze (Monash Micro Imaging) for assistance with the co-culture work and quantitative analysis, and Peter Meikle and Jackie Weir (Baker IDI Heart and Diabetes Institute) for assistance with the lipidomics analysis.
CONFLICTS OF INTEREST
The authors declare no potential conflicts of interest.
GRANT SUPPORT
This work was supported by the Prostate Cancer Foundation of Australia (Concept Grant, NCG 3313) and the Diabetes Australia Research Trust. MJ Watt (ID: APP1077703) and GP Risbridger (ID: 1102752) are supported by research fellowships from the National Health and Medical Research Council of Australia (ID: APP1077703) and RA Taylor is supported by a research fellowship from the Victorian Cancer Agency (MCRF15023). N Ascui received a scholarship from the Victorian Prostate Cancer Research Consortium.
REFERENCES
1. Ferlay J, Soerjomataram I and Ervik M. Cancer Incidence and Mortality Worldwide: IARC CancerBase No. 11. Lyon, France: International Agency for research on Cancer. 2013.
2. Howlader N, Noone A, Krapcho M, Garshell J, Miller D, Altekruse S, Kosary C, Yu M, Ruhl J, Tatalovich Z, Mariotto A, Lewis D, Chen H, et al. SEER Cancer Statistics Review, 1975–2012, National Cancer Institute. Bethesda, MD,. https://seer.cancer.gov/archive/csr/1975_2012/. 2015.
3. Ng M, Fleming T, Robinson M, Thomson B, Graetz N, Margono C, Mullany EC, Biryukov S, Abbafati C, Abera SF, Abraham JP, Abu-Rmeileh NM, Achoki T, et al. Global, regional, and national prevalence of overweight and obesity in children and adults during 1980–2013: a systematic analysis for the Global Burden of Disease Study 2013. Lancet. 2014; 384:766–781.
4. Wilson KM, Giovannucci EL, Mucci LA. Lifestyle and dietary factors in the prevention of lethal prostate cancer. Asian J. Androl. 2012; 14:365–374.
5. Allott EH, Masko EM, Freedland SJ. Obesity and prostate cancer: weighing the evidence. Eur Urol. 2013; 63:800–809.
6. Zhang X, Zhou G, Sun B, Zhao G, Liu D, Sun J, Liu C, Guo H. Impact of obesity upon prostate cancer-associated mortality: A meta-analysis of 17 cohort studies. Oncology letters. 2015; 9:1307–1312.
7. Huang M, Narita S, Numakura K, Tsuruta H, Saito M, Inoue T, Horikawa Y, Tsuchiya N, Habuchi T. A high-fat diet enhances proliferation of prostate cancer cells and activates MCP-1/CCR2 signaling. Prostate. 2012; 72:1779–1788.
8. Narita S, Tsuchiya N, Saito M, Inoue T, Kumazawa T, Yuasa T, Nakamura A, Habuchi T. Candidate genes involved in enhanced growth of human prostate cancer under high fat feeding identified by microarray analysis. Prostate. 2008; 68:321–335.
9. Bonorden MJ, Grossmann ME, Ewing SA, Rogozina OP, Ray A, Nkhata KJ, Liao DJ, Grande JP, Cleary MP. Growth and Progression of TRAMP Prostate Tumors in Relationship to Diet and Obesity. Prostate Cancer. 2012; 2012:543970.
10. Cho HJ, Kwon GT, Park H, Song H, Lee KW, Kim JI, Park JH. A high-fat diet containing lard accelerates prostate cancer progression and reduces survival rate in mice: possible contribution of adipose tissue-derived cytokines. Nutrients. 2015; 7:2539–2561.
11. Xu H, Hu MB, Bai PD, Zhu WH, Liu SH, Hou JY, Xiong ZQ, Ding Q, Jiang HW. Proinflammatory cytokines in prostate cancer development and progression promoted by high-fat diet. BioMed Res. Int. 2015; 2015:249741.
12. Chang SN, Han J, Abdelkader TS, Kim TH, Lee JM, Song J, Kim KS, Park JH, Park JH. High animal fat intake enhances prostate cancer progression and reduces glutathione peroxidase 3 expression in early stages of TRAMP mice. Prostate. 2014; 74:1266–1277.
13. Blando J, Moore T, Hursting S, Jiang G, Saha A, Beltran L, Shen J, Repass J, Strom S, DiGiovanni J. Dietary energy balance modulates prostate cancer progression in Hi-Myc mice. Cancer Prev Res (Phila). 2011; 4:2002–2014.
14. Kobayashi N, Barnard RJ, Said J, Hong-Gonzalez J, Corman DM, Ku M, Doan NB, Gui D, Elashoff D, Cohen P, Aronson WJ. Effect of low-fat diet on development of prostate cancer and Akt phosphorylation in the Hi-Myc transgenic mouse model. Cancer Res. 2008; 68:3066–3073.
15. Liu J, Ramakrishnan SK, Khuder SS, Kaw MK, Muturi HT, Lester SG, Lee SJ, Fedorova LV, Kim AJ, Mohamed IE, Gatto-Weis C, Eisenmann KM, Conran PB, et al. High-calorie diet exacerbates prostate neoplasia in mice with haploinsufficiency of Pten tumor suppressor gene. Mol. Metab. 2015; 4:186–198.
16. Woo S, Cho JY, Kim SY, Kim SH. Periprostatic fat thickness on MRI: correlation with Gleason score in prostate cancer. AJR Am J Roentgenol. 2015; 204:W43–47.
17. Zhang Q, Sun LJ, Qi J, Yang ZG, Huang T, Huo RC. Periprostatic adiposity measured on magnetic resonance imaging correlates with prostate cancer aggressiveness. Urol J. 2014; 11:1793–1799.
18. Ribeiro R, Monteiro C, Cunha V, Oliveira MJ, Freitas M, Fraga A, Principe P, Lobato C, Lobo F, Morais A, Silva V, Sanches-Magalhaes J, Oliveira J, et al. Human periprostatic adipose tissue promotes prostate cancer aggressiveness in vitro. J Exp Clin Canc Res. 2012; 31:32.
19. Sacca PA, Creydt VP, Choi H, Mazza ON, Fletcher SJ, Vallone VB, Scorticati C, Chasseing NA, Calvo JC. Human periprostatic adipose tissue: its influence on prostate cancer cells. Cellular Physiol Biochem. 2012; 30:113–122.
20. Litwin M, Saigal C. Urologic Diseases in America: National Institutes of health) 2007.
21. Lawrence MG, Taylor RA, Toivanen R, Pedersen J, Norden S, Pook DW, Frydenberg M, Australian Prostate Cancer B, Papargiris MM, Niranjan B, Richards MG, Wang H, Collins AT, et al. A preclinical xenograft model of prostate cancer using human tumors. Nat. Protoc. 2013; 8:836–848.
22. Currie E, Schulze A, Zechner R, Walther TC, Farese RV Jr. Cellular fatty acid metabolism and cancer. Cell Metab. 2013; 18:153–161.
23. Pelser C, Mondul AM, Hollenbeck AR, Park Y. Dietary fat, fatty acids, and risk of prostate cancer in the NIH-AARP diet and health study. Cancer Epidemiol Biomarkers Prev. 2013; 22:697–707.
24. Clark AK, Taubenberger AV, Taylor RA, Niranjan B, Chea ZY, Zotenko E, Sieh S, Pedersen JS, Norden S, Frydenberg M, Grummet JP, Pook DW, Australian Prostate Cancer B, et al. A bioengineered microenvironment to quantitatively measure the tumorigenic properties of cancer-associated fibroblasts in human prostate cancer. Biomaterials. 2013; 34:4777–4785.
25. Taylor RA, Lo J, Ascui N, Watt MJ. Linking obesogenic dysregulation to prostate cancer progression. Endocr Connect. 2015; 4:R68–80.
26. Calle EE, Kaaks R. Overweight, obesity and cancer: epidemiological evidence and proposed mechanisms. Nat Rev Cancer. 2004; 4:579–591.
27. Ligibel JA, Alfano CM, Courneya KS, Demark-Wahnefried W, Burger RA, Chlebowski RT, Fabian CJ, Gucalp A, Hershman DL, Hudson MM, Jones LW, Kakarala M, Ness KK, et al. American Society of Clinical Oncology position statement on obesity and cancer. J. Clin. Oncol. 2014; 32:3568–3574.
28. Toivanen R, Frydenberg M, Murphy D, Pedersen J, Ryan A, Pook D, Berman DM, Taylor RA, Risbridger GP. A preclinical xenograft model identifies castration-tolerant cancer-repopulating cells in localized prostate tumors. Sci. Transl. Med. 2013; 5:187ra171.
29. Zhao H, Thong A, Nolley R, Reese SW, Santos J, Ingels A, Peehl DM. Patient-derived tissue slice grafts accurately depict response of high-risk primary prostate cancer to androgen deprivation therapy. J Transl Med. 2013; 11:199.
30. Olefsky JM, Glass CK. Macrophages, inflammation, and insulin resistance. Annu. Rev. Physiol. 2010; 72:219–246.
31. Hanahan D, Weinberg RA. Hallmarks of cancer: the next generation. Cell. 2011; 144:646–674.
32. Williams LM, Campbell FM, Drew JE, Koch C, Hoggard N, Rees WD, Kamolrat T, Thi Ngo H, Steffensen IL, Gray SR, Tups A. The development of diet-induced obesity and glucose intolerance in C57BL/6 mice on a high-fat diet consists of distinct phases. PLoS One. 2014; 9:e106159.
33. Nguyen DP, Li J, Tewari AK. Inflammation and prostate cancer: the role of interleukin 6 (IL-6). BJU Int. 2014; 113:986–992.
34. Adler HL, McCurdy MA, Kattan MW, Timme TL, Scardino PT, Thompson TC. Elevated levels of circulating interleukin-6 and transforming growth factor-beta1 in patients with metastatic prostatic carcinoma. J Urol. 1999; 161:182–187.
35. Yu SH, Zheng Q, Esopi D, Macgregor-Das A, Luo J, Antonarakis ES, Drake CG, Vessella R, Morrissey C, De Marzo AM, Sfanos KS. A Paracrine Role for IL-6 in Prostate Cancer Patients: Lack of Production by Primary or Metastatic Tumor Cells. Cancer Immunol Res. 2015.
36. Zadra G, Photopoulos C, Loda M. The fat side of prostate cancer. Biochim Biophys Acta. 2013.
37. Schlaepfer IR, Glode LM, Hitz CA, Pac CT, Boyle KE, Maroni P, Deep G, Agarwal R, Lucia SM, Cramer SD, Serkova NJ, Eckel RH. Inhibition of Lipid Oxidation Increases Glucose Metabolism and Enhances 2-Deoxy-2-[(18)F]Fluoro-D-Glucose Uptake in Prostate Cancer Mouse Xenografts. Mol. Imaging Biol. 2015; 17:529–538.
38. Unger RH. Minireview: weapons of lean body mass destruction: the role of ectopic lipids in the metabolic syndrome. Endocrinology. 2003; 144:5159–5165.
39. Quail DF, Joyce JA. Microenvironmental regulation of tumor progression and metastasis. Nat Med. 2013; 19:1423–1437.
40. Ohri SS, Vashishta A, Proctor M, Fusek M, Vetvicka V. The propeptide of cathepsin D increases proliferation, invasion and metastasis of breast cancer cells. Int J Oncol. 2008; 32:491–498.
41. Bhindi B, Trottier G, Elharram M, Fernandes KA, Lockwood G, Toi A, Hersey KM, Finelli A, Evans A, van der Kwast TH, Fleshner NE. Measurement of peri-prostatic fat thickness using transrectal ultrasonography (TRUS): a new risk factor for prostate cancer. BJU Int. 2012; 110:980–986.
42. van Roermund JG, Hinnen KA, Tolman CJ, Bol GH, Witjes JA, Bosch JL, Kiemeney LA, van Vulpen M. Periprostatic fat correlates with tumour aggressiveness in prostate cancer patients. BJU Int. 2011; 107:1775–1779.
43. Venkatasubramanian PN, Brendler CB, Plunkett BA, Crawford SE, Fitchev PS, Morgan G, Cornwell ML, McGuire MS, Wyrwicz AM, Doll JA. Periprostatic adipose tissue from obese prostate cancer patients promotes tumor and endothelial cell proliferation: a functional and MR imaging pilot study. Prostate. 2014; 74:326–335.
44. DeClerck YA. Fat, Calories, and Cancer. Cancer Res. 2016; 76:509–510.
45. Huijsman E, van de Par C, Economou C, van der Poel C, Lynch GS, Schoiswohl G, Haemmerle G, Zechner R,Watt MJ. Adipose triacylglycerol lipase deletion alters whole body energy metabolism and impairs exercise performance in mice. Am J Physiol Endocrinol Metab. 2009; 297:E505–513.
46. Borg ML, Andrews ZB, Duh EJ, Zechner R, Meikle PJ, Watt MJ. Pigment epithelium-derived factor regulates lipid metabolism via adipose triglyceride lipase. Diabetes. 2011; 60:1458–1466.
47. Ellem SJ, Taylor RA, Furic L, Larsson O, Frydenberg M, Pook D, Pedersen J, Cawsey B, Trotta A, Need E, Buchanan G, Risbridger GP. A pro-tumourigenic loop at the human prostate tumour interface orchestrated by oestrogen, CXCL12 and mast cell recruitment. J. Pathol. 2014; 234:86–98.
48. Schneider CA, Rasband WS, Eliceiri KW. NIH Image to ImageJ: 25 years of image analysis. Nat. Methods. 2012; 9:671–675.