
INTRODUCTION
Gastric cancer (GC) is the fourth most common cancer in the world and the second most common cause of cancer-related death [1]. Although remarkable improvement has been made in surgical treatment, the survival of GC still remains poor, with the overall 5-year survival rate for gastric cancer approximately 27.4% in China [2]. Moreover, patients with the same TNM (tumor/node/metastasis) stage and treatment may demonstrate various clinical outcomes. As a complex disease, the initiation and progression of GC is strongly influenced by both genetic and environmental factors [3, 4]. Therefore, identification of genetic biomarkers that could predict prognosis of GC patients would greatly benefit the individualized therapy, post-operational treatment and follow-up strategies [5].
DNA repair systems play a pivotal role in maintaining the stability and integrity of the genome, which include nucleotide excision repair (NER), base excision repair (BER), mismatch repair (MMR) and double-strand break repair (DSBR) [6, 7]. Nucleotide excision repair (NER) is a versatile system that monitors and repairs DNA damage caused by both endogenous and exogenous factors, including therapeutic agents [8]. As a result, the alternation of NER capacity could contribute to the different clinical outcomes of GC patients. NER process include steps of damage recognition, damage demarcation and unwinding, damage incision, and new strand ligation, all of which require corresponding functional proteins [9]. XPA, XPC and DDB2 are responsible for the DNA damage recognition [10, 11]; ERCC2 and ERCC3 participate in the damage unwinding process [12, 13]; ERCC1, ERCC4 and ERCC5 are involved in the DNA damage incision [14, 15]. In addition, ERCC6 and ERCC8 are both essential factors involved in transcription-coupled NER [16, 17].
Polymorphisms of core NER genes could change the NER ability by influencing the expression and function of important proteins, thereby altering individual survival of GC patients. Driven by such hypothesis, polymorphisms of several NER genes have previously been studied in relation to the prognosis of GC patients [18]. For example, Liu et al. studied ERCC1 rs11615 C/T polymorphism and found that CT/TT genotype was significantly associated with worse prognosis compared with the CC genotype by evaluating overall survival (OS) in Chinese [19]. Han et al. investigated ERCC1 rs3212986 A/C polymorphism in Korean population and revealed that GC patients with the CC genotype had longer OS than CA/AA carriers [20]. In addition, Zou et al. investigated the ERCC5 rs17655 C/G polymorphism and found that GC patients with the CT/TT genotype had longer OS compared with CC genotype carriers in Chinese [21]. Although several NER polymorphisms have been reported to be related with survival of GC patients, most of these studies investigated only a few SNPs of a single NER gene. The association of NER gene polymorphisms with GC prognosis at the level of entire pathway and the joint effect of different polymorphisms of NER pathway genes remains largely unknown.
Until now, no study has yet been performed concerning the role of polymorphisms from perspective of the whole NER pathway in the prognosis of GC. In the present study, therefore, we systematically analyzed the association of 43 SNPs of ten key NER pathway genes (ERCC1, ERCC2, ERCC3, ERCC4, ERCC5, ERCC6, ERCC8, XPA, XPC, and DDB2) with survival of GC patients to investigate whether NER pathway polymorphisms could serve as potential biomarkers for GC prognosis.
RESULTS
Clinicopathological characteristics and OS of GC
A total of 373 patients including 263 (70.5%) males and 110 (29.5%) females were enrolled in the present study. The age of GC diagnosis ranged from 29 to 87 with a mean age of 58.8±10.2 years. At the last follow-up (September 2014), 114 patients died, with a median overall survival of 58.6 months. Among the patients, 184 (49.3%) presented with stages I-II and 189 (50.7%) with stages III-IV; 228 (61.1%) subjects were lymphatic metastasis positive while 145 (38.9%) patients were negative.
The effect of clinicopathological characteristics on survival of GC patients was summarized in Table 1. TNM stage (P<0.001), lymphatic metastasis (P<0.001), Borrmann classification (P=0.015) were all significant prognostic factors. No significant association was observed of Lauren’s classification, alcohol drinking and smoking with GC survival. Therefore, multivariate analysis was subsequently performed using Cox’s proportional hazards model adjusted by age, gender, TNM stage, lymphatic metastasis and Borrmann classification in order to identify independent prognostic value of polymorphism in NER pathway genes.
Table 1: Clinicopathological characteristics and OS of GC
Variables |
Patients(%) |
Deaths |
MST(month) |
HR(95%CI) |
P |
Age |
|||||
≦60 |
159(42.6) |
65 |
60.6 |
1(Ref) |
|
>60 |
214(57.4) |
49 |
52.5 |
1.08(0.74-1.56) |
0.692 |
Gender |
|||||
Male |
263(70.5) |
80 |
58.7 |
1(Ref) |
|
Female |
110(29.5) |
34 |
44.8 |
0.95(0.64-1.42) |
0.803 |
Growth pattern |
|||||
Expanding |
27(9.2) |
3 |
45.6 |
1(Ref) |
|
Intermediate |
85(29.0) |
17 |
41.7 |
2.38(0.70-8.15) |
0.166 |
Infiltrative |
181(61.8) |
60 |
33.9 |
5.43(1.69-17.45) |
0.004 |
Borrmann classification |
|||||
Borrmann I–II |
82(24.5) |
31 |
60.6 |
1(Ref) |
|
Borrmann III–IV |
253(75.5) |
81 |
48.4 |
1.36(1.09-2.08) |
0.015 |
Lauren’s classification |
|||||
Intestinal-type |
136(36.9) |
34 |
58.8 |
1(Ref) |
|
Diffuse-type |
233(63.1) |
78 |
56.6 |
0.70(0.46-1.04) |
0.078 |
TNM stage |
|||||
I-II |
184(49.3) |
18 |
71.6 |
1(Ref) |
|
III-IV |
189(50.7) |
96 |
41.7 |
6.92(4.18-11.48) |
<0.001 |
Lymphatic metastasis |
|||||
Negative |
145(38.9) |
16 |
70.6 |
1(Ref) |
|
Positive |
228(61.1) |
98 |
48.4 |
4.69(2.76-7.95) |
<0.001 |
Alcohol drinking |
|||||
Nondrinkers |
199(67.9) |
55 |
37.5 |
1(Ref) |
|
Drinkers |
94(32.1) |
25 |
37.0 |
0.90(0.56-1.45) |
0.665 |
Smoking |
|||||
Nonsmokers |
183(62.5) |
48 |
37.9 |
1(Ref) |
|
Smokers |
110(37.5) |
32 |
36.8 |
1.03(0.66-1.62) |
0.894 |
Polymorphisms of NER pathway genes and OS of GC
The results of the relation between all polymorphisms of NER pathway and GC survival in different genetic models were summarized in Supplementary Table S1. Of the 43 investigated SNPs in this study, six polymorphisms demonstrated significant association with GC survival, including ERCC1 rs3212961 A/C, ERCC2 rs50871 G/T, ERCC5 rs2094258 A/G, ERCC6 rs1917799 G/T, DDB2 rs3781619 A/G and DDB2 rs830083 C/G, which were shown in Table 2.
Table 2: NER pathway gene polymorphisms that demonstrate significant association with OS of GC
SNP |
Compared Genotype |
Patients(%) |
Deaths |
Crudea |
Adjustedb |
||
HR(95%CI) |
P |
HR(95%CI) |
P |
||||
ERCC1 rs3212961 |
CC |
92(25.9) |
34 |
ref. |
ref. |
||
AC |
189(53.2) |
53 |
0.73(0.47-1.12) |
0.149 |
0.67(0.43-1.04) |
0.076 |
|
AA |
74(20.8) |
17 |
0.52(0.29-0.94) |
0.031 |
0.54(0.30-0.99) |
0.045 |
|
Dominant |
0.66(0.44-1.00) |
0.050 |
0.63(0.41-0.95) |
0.028 |
|||
ERCC2 rs50871 |
TT |
125(35.2) |
38 |
ref. |
ref. |
||
GT |
207(58.3) |
54 |
0.98(0.64-1.49) |
0.912 |
0.89(0.58-1.36) |
0.577 |
|
GG |
23(6.5) |
12 |
2.54(1.31-4.90) |
0.006 |
1.74(0.86-3.50) |
0.121 |
|
Recessive |
2.55(1.39-4.66) |
0.002 |
1.82(0.98-3.38) |
0.059 |
|||
ERCC5 rs2094258 |
GG |
149(42.1) |
53 |
ref. |
ref. |
||
AG |
162(45.8) |
39 |
0.59(0.39-0.90) |
0.014 |
0.67(0.44-1.03) |
0.068 |
|
AA |
43(12.1) |
12 |
0.68(0.36-1.28) |
0.231 |
0.69(0.36-1.32) |
0.262 |
|
Dominant |
0.61(0.42-0.90) |
0.013 |
0.65(0.44-0.97) |
0.033 |
|||
ERCC6 rs1917799 |
TT |
70(32.6) |
22 |
ref. |
ref. |
||
GT |
105(48.8) |
45 |
1.44(0.86-2.40) |
0.162 |
1.68(1.01-2.81) |
0.048 |
|
GG |
40(18.6) |
15 |
1.23(0.64-2.37) |
0.540 |
0.95(0.48-1.88) |
0.874 |
|
Dominant |
1.40(0.85-2.26) |
0.191 |
1.47(0.90-2.41) |
0.124 |
|||
DDB2 rs3781619 |
AA |
132(37.2) |
34 |
ref. |
ref. |
||
AG |
187(52.7) |
54 |
1.18(0.76-1.82) |
0.456 |
1.20(0.77-1.88) |
0.419 |
|
GG |
36(10.1) |
16 |
2.06(1.13-3.75) |
0.018 |
2.40(1.27-4.55) |
0.007 |
|
Recessive |
1.89(1.11-3.22) |
0.019 |
2.30(1.33-3.97) |
0.003 |
|||
DDB2 rs830083 |
GG |
102(28.8) |
32 |
ref. |
ref. |
||
CG |
163(46.0) |
45 |
0.66(0.41-1.04) |
0.073 |
0.61(0.38-0.98) |
0.042 |
|
CC |
89(25.1) |
27 |
0.77(0.46-1.30) |
0.324 |
0.81(0.48-1.38) |
0.442 |
|
Dominant |
0.70(0.46-1.06) |
0.093 |
0.66(0.43-1.01) |
0.056 |
|||
a, Calculated by Cox proportional model using univariate analysis.
b, Calculated by Cox proportional model using multivariate analysis.
Carriers of ERCC1 rs3212961AA genotype showed significantly favorable OS than wild-type CC genotype both in univariate and multivariate analysis (crude HR=0.52, 95%CI=0.29-0.94, P=0.031; adjusted HR=0.54, 95%CI=0.30-0.99, P=0.045); After adjustment, patients with the variant AA/AC genotype exhibited longer OS than with those who had CC genotype (HR=0.63, 95%CI=0.41-0.95, P=0.028) (Figure 1A). For ERCC2 rs50871 G/T polymorphism, GG genotype subjects demonstrated significantly increased hazards of death in univariate model (GG vs. TT: HR=2.54, 95%CI=1.31-4.90, P=0.006; GG vs. (GT+TT): HR=2.55, 95%CI=1.39-4.66, P=0.002) (Figure 1B). ERCC5 rs2094258 AG genotype patients were found to have longer OS than wild-type GG carriers in univariate model (HR=0.59, 95%CI=0.39-0.90, P=0.014); (AA+AG) genotype individuals revealed significantly favorable survival both in univariate and multivariate analysis compared with GG genotype (crude HR=0.61, 95%CI=0.42-0.90, P=0.013; adjusted HR=0.65, 95%CI=0.44-0.97, P=0.033) (Figure 1C). Patients of ERCC6 rs1917799 heterozygote GT were associated with significantly shorter OS than TT genotype carriers after adjustments (adjusted HR=1.68, 95%CI=1.01-2.81, P=0.048) (Figure 1D). Patients with DDB2 rs3781619 GG genotype suffered higher hazards of death with adjustment of confounding factors (GG vs. AA: HR=2.40, 95%CI=1.27-4.55, P=0.007; GG vs. (AG+AA): HR=2.30, 95%CI=1.33-3.97, P=0.003) (Figure 1E). For DDB2 rs830083 C/G polymorphism, CG genotype could increase OS compared with GG genotype in multivariate model (HR=0.61, 95%CI=0.38-0.98, P=0.042) (Figure 1F).
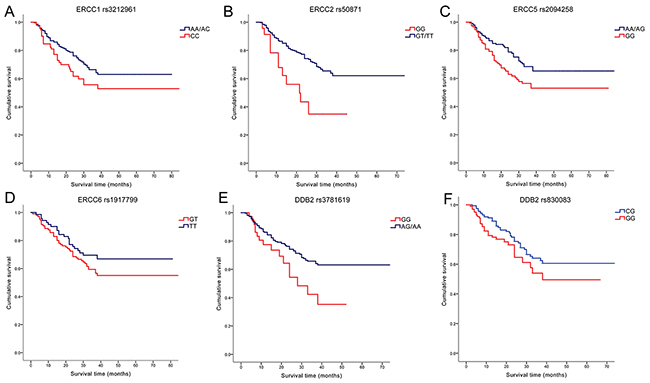
Figure 1: Kaplan–Meier survival curves by the genotypes of NER pathway polymorphisms in gastric cancer patients survival. (A. ERCC1 rs3212961 AA/AC vs. CC; B. ERCC2 rs50871 GG vs. GT/TT; C. ERCC5 rs2094258 AA/AG vs. GG; D. ERCC6 rs1917799 GT vs. TT; E. DDB2 rs3781619 GG vs. AG/AA; F. DDB2 rs830083 CG vs. GG).
To limit spurious findings, we attempted to use the Bonferroni correction for multiple comparisons considering significance thresholds for SNP association as P=1.16×10⁻³(0.05/43 SNPs). This is a fairly stringent correction given that not all of the SNPs analyzed were independent of each other because of linkage disequilibrium of SNPs. However, most results become not significant after Bonferroni correction.
Polymorphisms of NER pathway genes and OS of GC in different subgroups
Stratification analysis was further performed to explore the relation of NER pathway gene polymorphisms and OS of GC in different subgroups. As was displayed in Table 3, the relation of ERCC1 rs3212961 with favorable GC survival remained significant in subgroups of female, age≦60, Borrmann I–II, TNM stage III-IV, lymphatic metastasis and intestinal-type. ERCC2 rs50871 had a better prediction value for worse GC prognosis in subgroups of female and age≦60 after adjustment. (AA+AG) genotype of ERCC5 rs2094258 polymorphism could predict better OS in patients subgroups of age>60, Borrmann III–IV, TNM stage III-IV, lymphatic metastasis and diffuse-type. ERCC6 rs1917799 GT genotype was associated with shorter survival in TNM stage III-IV and smokers. For DDB2 rs3781619 polymorphism, significant relations were found in subgroups of age≦60, Borrmann III–IV, TNM stage III-IV, lymphatic metastasis and diffuse-type. DDB2 rs830083 CG genotype could predict favorable survival in males, Borrmann III–IV, TNM stage III-IV, lymphatic metastasis and intestinal-type.
Table 3: Polymorphisms of NER pathway genes and OS of GC in different subgroups
Variables |
Subgroup |
Genotype (deaths/patients) |
Crudea |
Adjustedb |
|||
HR(95%CI) |
P |
HR(95%CI) |
P |
||||
ERCC1 rs3212961 (AA+AC) vs. CC |
CC |
AA+AC |
|||||
Age |
≦60 |
20/49 |
38/153 |
0.54(0.31-0.93) |
0.026 |
0.54(0.31-0.94) |
0.028 |
>60 |
14/43 |
32/110 |
0.88(0.47-1.66) |
0.700 |
0.77(0.41-1.46) |
0.425 |
|
Gender |
Male |
22/64 |
54/189 |
0.77(0.47-1.27) |
0.308 |
0.72(0.43-1.19) |
0.199 |
Female |
12/28 |
16/74 |
0.46(0.22-0.98) |
0.043 |
0.45(0.21-0.97) |
0.043 |
|
Macroscopic type |
Borrmann I–II |
12/23 |
11/49 |
0.33(0.15-0.75) |
0.008 |
0.41(0.17-0.97) |
0.043 |
Borrmann III–IV |
21/58 |
58/189 |
0.82(0.50-1.36) |
0.441 |
0.74(0.44-1.22) |
0.236 |
|
TNM stage |
I-II |
5/46 |
11/130 |
0.77(0.27-2.22) |
0.629 |
0.91(0.31-2.69) |
0.863 |
III-IV |
29/46 |
59/133 |
0.61(0.39-0.95) |
0.028 |
0.59(0.37-0.93) |
0.023 |
|
Lymphatic metastasis |
Negative |
5/37 |
9/102 |
0.64(0.21-1.90) |
0.416 |
0.82(0.25-2.74) |
0.749 |
Positive |
29/55 |
61/161 |
0.63(0.41-0.98) |
0.042 |
0.62(0.39-0.97) |
0.035 |
|
Lauren’s classification |
Intestinal-type |
13/37 |
19/93 |
0.55(0.27-1.11) |
0.097 |
0.45(0.22-0.95) |
0.037 |
Diffuse-type |
20/54 |
50/167 |
0.72(0.43-1.22) |
0.223 |
0.71(0.42-1.21) |
0.211 |
|
ERCC2 rs50871 GG vs. (GT+TT) |
GT+TT |
GG |
|||||
Age |
≦60 |
49/184 |
9/18 |
2.75(1.34-5.64) |
0.006 |
2.16(1.04-4.47) |
0.039 |
>60 |
43/148 |
3/5 |
2.20(0.68-7.13) |
0.189 |
1.16(0.35-3.83) |
0.805 |
|
Gender |
Male |
66/233 |
10/20 |
2.22(1.14-4.33) |
0.019 |
1.46(0.74-2.86) |
0.274 |
Female |
26/99 |
2/3 |
8.27(1.84-37.12) |
0.006 |
7.88(1.67-37.14) |
0.009 |
|
Macroscopic type |
Borrmann I–II |
20/68 |
3/4 |
3.74(1.10-12.72) |
0.035 |
3.18(0.78-12.87) |
0.106 |
Borrmann III–IV |
71/229 |
8/18 |
1.71(0.82-3.57) |
0.149 |
1.43(0.68-3.01) |
0.346 |
|
Lymphatic metastasis |
Negative |
13/131 |
1/8 |
2.45(0.32-19.07) |
0.392 |
1.90(0.21-17.10) |
0.567 |
Positive |
79/201 |
11/15 |
2.26(1.20-4.26) |
0.011 |
1.78(0.93-3.40) |
0.081 |
|
Lauren’s classification |
Intestinal-type |
28/122 |
4/8 |
2.87(1.00-8.23) |
0.050 |
1.47(0.48-4.49) |
0.495 |
Diffuse-type |
62/206 |
8/15 |
2.50(1.19-5.24) |
0.015 |
1.89(0.88-4.03) |
0.102 |
|
ERCC5 rs2094258 (AA+AG) vs. GG |
GG |
AA+AG |
|||||
Age |
≦60 |
27/79 |
31/122 |
0.63(0.37-1.05) |
0.078 |
0.64(0.37-1.10) |
0.106 |
>60 |
26/70 |
20/83 |
0.61(0.34-1.09) |
0.095 |
0.50(0.28-0.92) |
0.025 |
|
Gender |
Male |
37/120 |
39/150 |
0.63(0.40-0.98) |
0.042 |
0.63(0.40-1.00) |
0.051 |
Female |
16/47 |
12/55 |
0.58(0.27-1.22) |
0.149 |
0.57(0.26-1.25) |
0.160 |
|
Macroscopic type |
Borrmann I–II |
10/28 |
13/44 |
0.79(0.35-1.80) |
0.569 |
0.76(0.32-1.79) |
0.528 |
Borrmann III–IV |
42/107 |
37/139 |
0.58(0.37-0.91) |
0.017 |
0.61(0.39-0.96) |
0.034 |
|
TNM stage |
I-II |
4/69 |
12/107 |
1.84(0.59-5.72) |
0.289 |
1.91(0.60-6.02) |
0.271 |
III-IV |
49/80 |
39/98 |
0.54(0.35-0.82) |
0.004 |
0.53(0.34-0.82) |
0.004 |
|
Lymphatic metastasis |
Negative |
6/60 |
8/79 |
0.89(0.31-2.56) |
0.823 |
1.04(0.36-3.10) |
0.951 |
Positive |
47/89 |
43/126 |
0.55(0.36-0.83) |
0.005 |
0.62(0.40-0.94) |
0.025 |
|
Lauren’s classification |
Intestinal-type |
14/50 |
18/79 |
0.80(0.40-1.62) |
0.540 |
1.03(0.50-2.12) |
0.943 |
Diffuse-type |
39/97 |
31/124 |
0.51(0.32-0.82) |
0.006 |
0.51(0.31-0.83) |
0.007 |
|
ERCC6 rs1917799 GT vs. TT |
TT |
GT |
|||||
Macroscopic type |
Borrmann I–II |
11/26 |
13/32 |
1.03(0.46-2.29) |
0.948 |
0.83(0.36-1.94) |
0.669 |
Borrmann III–IV |
11/37 |
31/56 |
2.03(1.02-4.04) |
0.044 |
2.42(1.20-4.87) |
0.014 |
|
Smoking |
Nonsmokers |
7/30 |
16/41 |
1.73(0.71-4.21) |
0.227 |
2.06(0.84-5.03) |
0.114 |
Smokers |
4/18 |
14/32 |
2.11(0.69-6.41) |
0.189 |
4.10(1.19-14.06) |
0.025 |
|
DDB2 rs3781619 GG vs. (AG+AA) |
AG+AA |
GG |
|||||
Age |
≦60 |
47/178 |
11/24 |
2.16(1.12-4.19) |
0.022 |
3.16(1.55-6.43) |
0.001 |
>60 |
41/141 |
5/12 |
1.41(0.56-3.57) |
0.469 |
1.45(0.56-3.77) |
0.446 |
|
Macroscopic type |
Borrmann I–II |
19/65 |
4/7 |
2.12(0.72-6.23) |
0.172 |
2.84(0.92-8.75) |
0.069 |
Borrmann III–IV |
68/223 |
11/24 |
1.83(0.96-3.47) |
0.065 |
2.02(1.05-3.89) |
0.035 |
|
TNM stage |
I-II |
13/156 |
3/20 |
2.36(0.67-8.29) |
0.181 |
2.60(0.66-10.20) |
0.171 |
III-IV |
75/163 |
13/16 |
2.08(1.15-3.76) |
0.015 |
2.05(1.09-3.84) |
0.026 |
|
Lymphatic metastasis |
Negative |
11/119 |
3/20 |
2.09(0.58-7.50) |
0.260 |
2.19(0.57-8.45) |
0.254 |
Positive |
77/200 |
13/16 |
2.66(1.47-4.79) |
0.001 |
2.23(1.21-4.11) |
0.010 |
|
Lauren’s classification |
Intestinal-type |
30/123 |
2/7 |
1.33(0.32-5.56) |
0.700 |
3.45(0.74-16.12) |
0.115 |
Diffuse-type |
56/192 |
14/29 |
1.91(1.06-3.43) |
0.032 |
2.03(1.10-3.75) |
0.024 |
|
DDB2 rs830083 CG vs. GG |
GG |
CG |
|||||
Gender |
Male |
30/75 |
30/121 |
0.42(0.25-0.71) |
0.001 |
0.45(0.26-0.76) |
0.003 |
Female |
2/27 |
15/42 |
4.51(1.03-19.81) |
0.046 |
3.44(0.75-15.68) |
0.111 |
|
Macroscopic type |
Borrmann I–II |
5/16 |
15/37 |
1.34(0.49-3.68) |
0.573 |
1.07(0.38-3.03) |
0.905 |
Borrmann III–IV |
25/78 |
30/111 |
0.56(0.32-0.97) |
0.038 |
0.56(0.33-0.98) |
0.041 |
|
TNM stage |
I-II |
3/54 |
8/78 |
1.03(0.27-3.94) |
0.970 |
1.16(0.29-4.74) |
0.834 |
III-IV |
29/48 |
37/85 |
0.56(0.34-0.91) |
0.019 |
0.58(0.35-0.97) |
0.039 |
|
Lymphatic metastasis |
Negative |
3/44 |
7/65 |
0.98(0.25-3.89) |
0.981 |
0.85(0.20-3.60) |
0.825 |
Positive |
29/58 |
38/98 |
0.59(0.36-0.96) |
0.032 |
0.60(0.36-0.99) |
0.045 |
|
Lauren’s classification |
Intestinal-type |
9/35 |
16/65 |
0.54(0.23-1.26) |
0.154 |
0.30(0.12-0.79) |
0.015 |
Diffuse-type |
23/67 |
29/97 |
0.75(0.43-1.30) |
0.306 |
0.81(0.46-1.43) |
0.467 |
|
a, Calculated by Cox proportional model using univariate analysis.
b, Calculated by Cox proportional model using multivariate analysis.
Polymorphisms of NER pathway genes and OS of GC in patients who received postoperative chemotherapy
We then performed survival analysis for patients who received postoperative chemotherapy to investigate whether chemotherapy had influence on the association between polymorphisms of NER pathway genes and OS of GC. Altogether 94 patients received chemotherapy after surgery. The results indicated that carriers of ERCC2 rs50871GG genotype showed significantly unfavorable OS than (GT+TT) genotype both in univariate and multivariate analysis (crude HR=3.48, 95%CI=1.16-10.44, P=0.026; adjusted HR=5.36, 95%CI=1.69-17.03, P=0.004); Patients with DDB2 rs3781619 GG genotype suffered higher hazards of death with adjustment (GG vs. AA: HR=10.30, 95%CI=1.11-95.80, P=0.040; GG vs. (AG+AA): HR=6.73, 95%CI=1.20-37.61, P=0.030) (Supplementary Table S2).
Joint effect of NER pathway gene polymorphisms on OS of GC
To investigate whether the combined detection of certain NER pathway polymorphisms could better predict the survival of GC, we further performed joint analysis of single NER polymorphism which demonstrated significant association (Table 4). The results indicated that patients simultaneously carrying two “hazard” genotypes exhibited even more significantly shorter OS (Figure 2A): carriers of both ERCC2 rs50871 GG and ERCC6 rs1917799 GT genotypes suffered a 3.75-fold increased hazards of death (P=0.019). Similarly, patients with both ERCC2 rs50871 GG and DDB2 rs3781619 GG genotypes (HR=6.30, P=0.001), with both ERCC6 rs1917799 GT and DDB2 rs3781619 GG genotypes (HR=3.76, P=0.006) showed significant worse survival.
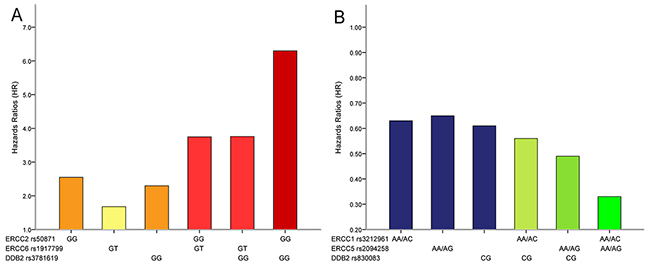
Figure 2: Combined detection of NER pathway polymorphisms could more effectively predict survival of gastric cancer patients. (A. combined detection of polymorphisms that could predict worse survival; B. combined detection of polymorphisms that could predict favorable survival).
Table 4: Joint effect of NER pathway gene polymorphisms on OS of GC
Combined Genotype |
Patients(%) |
Deaths |
Crudea |
Adjustedb |
|||
HR(95%CI) |
P |
HR(95%CI) |
P |
||||
ERCC2 rs50871 |
ERCC6 rs1917799 |
||||||
GT+TT |
TT |
61(37.7) |
18 |
ref. |
ref. |
||
GG |
TT |
4(2.5) |
2 |
1.79(0.41-7.75) |
0.439 |
0.98(0.21-4.65) |
0.979 |
GT+TT |
GT |
90(55.6) |
36 |
1.38(0.79-2.44) |
0.261 |
1.57(0.89-2.78) |
0.120 |
GG |
GT |
7(4.3) |
5 |
4.00(1.47-10.90) |
0.007 |
3.75(1.24-11.32) |
0.019 |
ERCC2 rs50871 |
DDB2 rs3781619 |
||||||
GT+TT |
AA+AG |
301(84.8) |
80 |
ref. |
ref. |
||
GG |
AA+AG |
18(5.1) |
8 |
2.03(0.98-4.21) |
0.056 |
1.54(0.73-3.25) |
0.256 |
GT+TT |
GG |
31(8.7) |
12 |
1.60(0.87-2.93) |
0.132 |
1.97(1.06-3.67) |
0.032 |
GG |
GG |
5(1.4) |
4 |
7.16(2.57-19.93) |
1.65×10⁻⁴ |
6.30(2.19-18.18) |
0.001 |
ERCC6 rs1917799 |
DDB2 rs3781619 |
||||||
TT |
AA+AG |
58(35.8) |
16 |
ref. |
ref. |
||
GT |
AA+AG |
87(53.7) |
34 |
1.47(0.81-2.66) |
0.204 |
1.70(0.94-3.10) |
0.082 |
TT |
GG |
7(4.3) |
4 |
2.33(0.78-6.99) |
0.131 |
1.95(0.58-6.61) |
0.282 |
GT |
GG |
10(6.2) |
7 |
3.16(1.30-7.69) |
0.011 |
3.76(1.47-9.63) |
0.006 |
ERCC1 rs3212961 |
ERCC5 rs2094258 |
||||||
CC |
GG |
39(11.0) |
16 |
ref. |
ref. |
||
AA+AC |
GG |
110(31.1) |
37 |
0.70(0.39-1.26) |
0.234 |
0.58(0.30-1.11) |
0.099 |
CC |
AA+AG |
53(15.0) |
18 |
0.68(0.35-1.35) |
0.272 |
0.69(0.32-1.48) |
0.343 |
AA+AC |
AA+AG |
152(42.9) |
33 |
0.42(0.23-0.76) |
0.004 |
0.33(0.17-0.63) |
0.001 |
ERCC1 rs3212961 |
DDB2 rs830083 |
||||||
CC |
GG |
27(10.2) |
10 |
ref. |
ref. |
||
AA+AC |
GG |
75(28.3) |
22 |
0.78(0.37-1.65) |
0.516 |
0.89(0.40-1.99) |
0.779 |
CC |
CG |
49(18.5) |
16 |
0.68(0.31-1.51) |
0.343 |
0.69(0.29-1.66) |
0.407 |
AA+AC |
CG |
114(43.0) |
29 |
0.51(0.25-1.06) |
0.070 |
0.56(0.26-1.20) |
0.135 |
ERCC5 rs2094258 |
DDB2 rs830083 |
||||||
GG |
GG |
41(15.5) |
14 |
ref. |
ref. |
||
AA+AG |
GG |
60(22.7) |
18 |
0.88(0.44-1.78) |
0.727 |
0.88(0.42-1.86) |
0.733 |
GG |
CG |
66(25.0) |
22 |
0.83(0.41-1.63) |
0.589 |
0.79(0.37-1.67) |
0.537 |
AA+AG |
CG |
97(36.7) |
23 |
0.49(0.25-0.96) |
0.038 |
0.49(0.24-1.00) |
0.048 |
a, Calculated by Cox proportional model using univariate analysis.
b, Calculated by Cox proportional model using multivariate analysis.
The combination of single NER polymorphism predicting better prognosis also revealed even more favorable survival (Figure 2B): ERCC1 rs3212961 AA/AC and ERCC5 rs2094258 AA/AG genotypes carriers had a significant longer OS (HR=0.33, 95%CI=0.17-0.63, P=0.001); individuals with both ERCC5 rs2094258 AA/AG and DDB2 rs830083 CG genotypes were associated with significantly increased OS (HR=0.49, 95%CI=0.24-1.00, P=0.048). It was therefore obvious that combined detection of two core NER pathway gene polymorphisms could more effectively predict GC survival.
DISCUSSION
Identifying biomarkers associated with GC survival is essential for the individualized therapy and post-operational treatment for different patients. Although several previous studies have revealed that NER gene polymorphisms could alter GC survival, to the best of our knowledge this is the first comprehensive investigation of the relationship between polymorphisms of the entire NER pathway and prognosis of GC. In this study, 43 SNPs of ten NER pathway genes were investigated in relation to OS of GC patients. We for the first time found that ERCC2 rs50871 G/T, ERCC6 rs1917799 G/T, DDB2 rs3781619 A/G polymorphisms were significantly associated with shorter OS while ERCC1 rs3212961 A/C, ERCC5 rs2094258 A/G, DDB2 rs830083 C/G could predict favorable OS of GC patients in Chinese. In addition, the combined detection of NER pathway gene polymorphisms could more effectively predict the prognosis of GC.
NER process includes steps of damage recognition, damage demarcation and unwinding, damage incision, and new strand ligation [22, 23]. Multiple genes are involved in this pathway and in charge of different functions [24]: XPA, XPC and DDB2 are responsible for the DNA damage recognition; ERCC2 and ERCC3 participate in the damage unwinding process; ERCC1, ERCC4 and ERCC5 are involved in the DNA damage incision; ERCC6 and ERCC8 are both essential factors involved in transcription-coupled NER. In this study, we found that ERCC2 rs50871 GG, ERCC6 rs1917799 GT and DDB2 rs3781619 GG genotypes indicated worse OS of GC. The results for ERCC2 rs50871 was opposite to the previous findings in melanoma [25] or head and neck cancer [26], in which the GG genotype was related to favorable survival. ERCC6 rs1917799 was previously linked to increased risk of GC [27], but its role in GC prognosis has not been studied before. In this study, ERCC6 rs1917799 heterozygote GT was firstly found to be associated with significantly shorter OS than wild-type TT. In addition, we found that ERCC1 rs3212961 AA/AC, ERCC5 rs2094258 AA/AG and DDB2 rs830083 CG genotypes could predict favorable OS. After analyzing patients who received postoperative chemotherapy, we found that ERCC2 rs50871 and DDB2 rs3781619 polymorphisms were significantly associated with worse OS. However, due to the limited number of patients who received chemotherapy, the detailed role of chemotherapy in the relation between NER pathway polymorphisms and GC prognosis stilled need further investigations.
Among these newly discovered polymorphisms which could predict GC survival, ERCC5 rs2094258 and ERCC6 rs1917799 were both located in the 5’ upstream regulatory region, which may influence the binding activity of certain transcriptional factor, thus altering the expression and function of corresponding NER factors. ERCC1 rs3212961, ERCC2 rs50871, DDB2 rs3781619 and DDB2 rs830083 were all located in the intron region of genes. Sequence variation of introns especially the polymorphic site which changes alternative splicing patterns hold great promise in altering the regulation of the gene’s transcription and thereby modulating function of specific factors of NER pathway [28]. By this way, these polymorphisms of NER pathway genes may modulate the DRC phenotype. The alteration in the NER capacity may in turn change frequencies of DNA mutation due to unrepaired damaged DNA. Thus, it is biologically plausible that polymorphisms in NER genes may influence clinical outcomes in GC patients. Furthermore, it is notable that the polymorphisms which demonstrated significant associations with GC survival are located within different genes responsible for each step of NER process: DDB2 of “damage recognition” step, ERCC2 of “damage unwinding” step, ERCC1 and ERCC5 of “damage incision” step. This interesting phenomenon suggested that each step of the NER process was important for the role of NER in GC prognosis. Although the above-mentioned mechanisms might, at least in part, explained the observed significant associations of certain NER polymorphisms and GC survival, further molecular researches are still needed to reveal the underlying mechanism.
As a complicated and multi-step process, NER pathway factors might function jointly to alter GC prognosis, and a single polymorphism may be insufficient to predict GC survival. Therefore, on the basis of our findings of certain relations between single polymorphism and GC survival, we further explored whether the combined detection of certain NER pathway gene polymorphisms could better predict the survival of GC through joint analysis of single NER polymorphism which demonstrated significant association with GC survival. The findings suggested that patients simultaneously carrying two “hazard” genotypes exhibited even more significantly worse OS: carriers of both ERCC2 rs50871 GG and ERCC6 rs1917799 GT genotypes suffered a 3.75-fold increased hazards of death; patients with both ERCC2 rs50871 GG and DDB2 rs3781619 GG genotypes (HR=6.30), with both ERCC6 rs1917799 GT and DDB2 rs3781619 GG genotypes (HR=3.76) showed significant worse OS. Similarly, the combination of single NER polymorphism predicting better prognosis also revealed even more favorable survival: ERCC1 rs3212961 AA/AC and ERCC5 rs2094258 AA/AG genotypes carriers had a significant longer survival (HR=0.33); individuals with both ERCC5 rs2094258 AA/AG and DDB2 rs830083 CG genotypes were associated with significantly increased OS (HR=0.49). Therefore, it was obvious that combined detection of two core NER pathway polymorphisms could more effectively predict GC survival. These results might due to the interaction or joint effect of polymorphisms of different factors involved in NER pathway. It is promising that the joint detection of different polymorphisms of NER pathway could be applied in the prediction of the prognosis of GC.
Several limitations should be acknowledged in this study. Considering the availability of our data, we could only get the information that whether the patients received chemotherapy after surgery rather than detailed chemotherapeutic information. Secondly, the sample size of this study was relatively insufficient especially for the subgroup analysis, which requires future studies based on large population to confirm. Thirdly, most results became not significant after Bonferroni correction which required stricter significance. Bonferroni correction might be a fairly stringent correction given that not all of the SNPs analyzed were independent of each other because of linkage disequilibrium of SNPs. We therefore considered the results of this study as preliminary screening and exploration, which provide direction for future studies concerning NER pathway and GC prognosis.
Our study for the first time unravelled the promising role of NER pathway gene polymorphism as a prognosis biomarker from the perspective of the entire pathway. Such NER pathway gene polymorphisms would largely benefit the management strategy for GC patients, making it possible to enhance the follow-up and dynamic monitoring for GC individuals with the specific genotype of certain polymorphisms.
In summary, our findings demonstrated that ERCC2 rs50871 G/T, ERCC6 rs1917799 G/T, DDB2 rs3781619 A/G polymorphisms were significantly associated with shorter OS of GC; ERCC1 rs3212961 A/C, ERCC5 rs2094258 A/G, DDB2 rs830083 C/G could predict favorable OS of GC patients in Chinese. Joint detection of ERCC2 rs50871, ERCC6 rs1917799 and DDB2 rs3781619 could more efficiently predict worse OS while combined detection of ERCC1 rs3212961, ERCC5 rs2094258 and DDB2 rs830083 could predict even better OS. Therefore, polymorphisms of multiple genes involved in NER pathway might serve as promising biomarkers to predict prognosis of gastric cancer.
MATERIALS AND METHODS
Study subjects
This study project was approved by the Institute Research Medical Ethics Committee of the First Affiliated Hospital of China Medical University. A total of 373 GC patients were recruited from the Department of Surgical Oncology of the First Affiliated Hospital of China Medical University between 2008 and 2013. Written informed consents were obtained from participants. Medical histories were acquired by questionnaire and the records were computerized. All the GC patients were histopathologically confirmed and classified based on current Borrmann and Lauren’s classification. Tumors were staged using the 7th edition of the TNM staging system of the International Union Against Cancer (UICC)/American Joint Committee on Cancer (AJCC) (2010) according to postoperative pathologic examination. Patients who (i) had other malignant tumours (ii) distant metastasis found preoperatively (iii) underwent preoperative radiotherapy or chemotherapy were excluded from this study. And the prognostic parameter is overall survival (OS) in this study. OS was calculated up to either the date of death or last clinical follow-up, whichever occurred first. Patients without death at the time of the analysis were censored at the date of the last follow-up. The follow-up of the patients was completed by September 2014.
Candidate genes and SNP selection
Genotype data from extended NER pathway gene regions encompassing 5 kb of upstream and downstream flanking sequences were extracted from the HapMap Chinese Han Beijing population (Release 27, Phase I + II + III, http://www.HapMap.org). Haploview software (http://www.broadinstitute.org/mpg/haploview) was used to minimize the number of SNPs needed to be genotyped, providing a significant shortcut to carry out candidate gene association studies in a particular population. Tag SNPs were selected on the basis of pairwise linkage disequilibrium information to maximally capture (r2 > 0.8) common or rare variants (minor allele frequency [MAF] > 0.05) by Haploview 4.2. FastSNP Search was used to predict the potential SNP function (leading to amino acid substitutions, altering splicing or transcription factor-binding motifs, acting as intronic enhancers) [29, 30]. Totally 43 SNPs covering ten key NER pathway genes (ERCC1, ERCC2, ERCC3, ERCC4, ERCC5, ERCC6, ERCC8, XPA, XPC, and DDB2) were eventually chosen by integrating these two publicly available tools. The detailed information of selected SNPs from NER pathway genes was shown in Table 5.
Table 5: Detailed information of 43 genotyped SNPs in NER pathway
Gene |
dbSNP number |
Base change |
SNP location |
MAF |
|
In database |
GC patients |
||||
ERCC1 |
rs11615 |
C>T |
Exon |
0.243 |
0.241 |
rs2298881 |
C>A |
Promoter |
0.444 |
0.399 |
|
rs3212955 |
A>G |
Intron |
0.289 |
0.300 |
|
rs3212961 |
C>A |
Intron |
0.453 |
0.475 |
|
rs3212986 |
G>T |
3′ Untranslated region |
0.310 |
0.330 |
|
rs735482 |
A>C |
3′ Untranslated region |
0.427 |
0.435 |
|
ERCC2 |
rs1052555 |
C>T |
Exon |
0.104 |
0.068 |
rs13181 |
T>G |
Exon |
0.095 |
0.082 |
|
rs238406 |
G>T |
Exon |
0.407 |
0.461 |
|
rs238417 |
G>C |
Intron |
0.488 |
0.461 |
|
rs50871 |
T>G |
Intron |
0.279 |
0.356 |
|
rs50872 |
C>T |
Intron |
0.190 |
0.221 |
|
ERCC3 |
rs4150441 |
G>A |
Intron |
0.444 |
0.424 |
rs4150448 |
G>A |
Intron |
0.109 |
0.110 |
|
rs4150506 |
C>T |
Intron |
0.320 |
0.307 |
|
ERCC4 |
rs6498486 |
A>C |
5′ Upstream |
0.282 |
0.225 |
rs1799801 |
T>C |
Exon |
0.237 |
0.210 |
|
rs2276464 |
G>C |
3′ Untranslated region |
0.275 |
0.207 |
|
rs254942 |
T>C |
Intron |
0.241 |
0.215 |
|
ERCC5 |
rs1047768 |
T>C |
Exon |
0.241 |
0.312 |
rs2094258 |
G>A |
Promoter |
0.383 |
0.350 |
|
rs2228959 |
C>A |
Exon |
0.062 |
0.046 |
|
rs2296147 |
T>C |
5′ Upstream |
0.201 |
0.218 |
|
rs4150291 |
A>T |
Intron |
0.081 |
0.100 |
|
rs4150383 |
G>A |
Intron |
0.088 |
0.063 |
|
rs751402 |
C>T |
Promoter |
0.367 |
0.359 |
|
rs873601 |
G>A |
3′ Untranslated region |
0.496 |
0.479 |
|
ERCC6 |
rs1917799 |
T>G |
5′ Upstream |
0.303 |
0.430 |
ERCC8 |
rs158572 |
A>G |
Intron |
0.306 |
0.107 |
rs158916 |
T>C |
5′ Upstream |
0.152 |
0.121 |
|
XPA |
rs10817938 |
T>C |
5′ Upstream |
0.208 |
0.236 |
rs2808668 |
T>C |
Intron |
0.478 |
0.499 |
|
rs3176629 |
C>T |
Promoter |
0.088 |
0.096 |
|
rs3176658 |
C>T |
Intron |
0.256 |
/ |
|
XPC |
rs1870134 |
G>C |
5′ Upstream |
0.244 |
0.269 |
rs2228000 |
C>T |
Exon |
0.325 |
0.312 |
|
rs2228001 |
A>C |
Exon |
0.372 |
0.375 |
|
rs2470352 |
A>T |
3′ UTR |
0.058 |
0.007 |
|
rs2607775 |
C>G |
5′ Upstream |
0.089 |
0.049 |
|
DDB2 |
rs2029298 |
G>A |
Promoter |
0.354 |
0.324 |
rs326222 |
T>C |
Intron |
0.274 |
0.268 |
|
rs3781619 |
A>G |
Intron |
0.383 |
0.365 |
|
rs830083 |
C>G |
Intron |
0.367 |
0.482 |
|
MAF for Chinese in Hapmap database (www.hapmap.org)
Abbreviations: MAF, minor allele frequency; GC, gastric cancer.
Genotyping assay
Genomic DNA was isolated from blood samples by routine phenol–chloroform extraction and then diluted into working concentrations (50 ng/μl) for further genotyping. Samples were placed randomly on the 384-well plates and blinded for the status of disease. The design of the assay and SNP genotyping were performed by Bio Miao Biological Technology (Beijing, China) using the Sequenom MassARRAY platform (Sequenom, San Diego, CA) according to the manufacturer’s instructions. The results of all duplicated samples were 100% consistent.
Statistical analysis
Statistical analysis was performed by using SPSS (16.0) statistical software (SPSS, Chicago, IL, USA). The Kaplan-Meier method was applied to visualize overall survival (OS) by different genotype groups. The median survival time (MST) was calculated; mean survival time was chosen if the median survival time could not be calculated. The log-rank test was used to test for equality of the survival distributions. Univariate and multivariate Cox proportional hazards models were performed to calculate crude or adjusted hazards ratios (HR) and 95% confidence intervals (CI) of each genotype to estimate its effect on OS with or without adjustment for confounding factors. Significant variables in univariate models were further analyzed by multivariate Cox proportional hazards regression models to identify the independent prognostic value. Two-tailed P values < 0.05 were considered statistically significant.
ACKNOWLEDGMENTS
This study is supported partly by grants from National Basic Research Program of China (973 Program Ref No.2010CB529304) and the grants of the Science and Technology Project of Liaoning province (Ref No.2012225016).
CONFLICTS OF INTEREST
All of the authors declare that there is no conflict of interest.
Author contributions
Jingwei Liu, Qian Xu, Liping Sun and Huakang Tu performed statistical analysis, data interpretation and wrote the paper. Na Deng and Zhenning Wang collected clinical information and revised the manuscript. Chengzhong Xing and Yuan Yuan conceived this study and revised the manuscript. All authors read and approved the final manuscript.
REFERENCES
1. Siegel R, Ward E, Brawley O and Jemal A. Cancer statistics, 2011: the impact of eliminating socioeconomic and racial disparities on premature cancer deaths. CA Cancer J Clin. 2011; 61:212-236.
2. Zeng H, Zheng R, Guo Y, Zhang S, Zou X, Wang N, Zhang L, Tang J, Chen J, Wei K, Huang S, Wang J, Yu L, Zhao D, Song G, Chen J, et al. Cancer survival in China, 2003-2005: A population-based study. Int J Cancer. 2014; 2014:29227.
3. Zabaleta J. Multifactorial etiology of gastric cancer. Methods Mol Biol. 2012; 863:411-435.
4. Yang X, Takano Y and Zheng HC. The pathobiological features of gastrointestinal cancers (Review). Oncol Lett. 2012; 3:961-969.
5. Ludwig JA and Weinstein JN. Biomarkers in cancer staging, prognosis and treatment selection. Nat Rev Cancer. 2005; 5:845-856.
6. Goode EL, Ulrich CM and Potter JD. Polymorphisms in DNA repair genes and associations with cancer risk. Cancer Epidemiol Biomarkers Prev. 2002; 11:1513-1530.
7. Lindahl T and Wood RD. Quality control by DNA repair. Science. 1999; 286:1897-1905.
8. de Laat WL, Jaspers NG and Hoeijmakers JH. Molecular mechanism of nucleotide excision repair. Genes Dev. 1999; 13:768-785.
9. Nouspikel T. DNA repair in mammalian cells : Nucleotide excision repair: variations on versatility. Cell Mol Life Sci. 2009; 66:994-1009.
10. Sugasawa K. Multiple DNA damage recognition factors involved in mammalian nucleotide excision repair. Biochemistry (Mosc). 2011; 76:16-23.
11. Araki M, Masutani C, Takemura M, Uchida A, Sugasawa K, Kondoh J, Ohkuma Y and Hanaoka F. Centrosome protein centrin 2/caltractin 1 is part of the xeroderma pigmentosum group C complex that initiates global genome nucleotide excision repair. J Biol Chem. 2001; 276:18665-18672.
12. Coin F, Oksenych V and Egly JM. Distinct roles for the XPB/p52 and XPD/p44 subcomplexes of TFIIH in damaged DNA opening during nucleotide excision repair. Mol Cell. 2007; 26:245-256.
13. Evans E, Moggs JG, Hwang JR, Egly JM and Wood RD. Mechanism of open complex and dual incision formation by human nucleotide excision repair factors. Embo J. 1997; 16:6559-6573.
14. Enzlin JH and Scharer OD. The active site of the DNA repair endonuclease XPF-ERCC1 forms a highly conserved nuclease motif. Embo J. 2002; 21:2045-2053.
15. Matsunaga T, Mu D, Park CH, Reardon JT and Sancar A. Human DNA repair excision nuclease. Analysis of the roles of the subunits involved in dual incisions by using anti-XPG and anti-ERCC1 antibodies. J Biol Chem. 1995; 270:20862-20869.
16. Fousteri M, Vermeulen W, van Zeeland AA and Mullenders LH. Cockayne syndrome A and B proteins differentially regulate recruitment of chromatin remodeling and repair factors to stalled RNA polymerase II in vivo. Mol Cell. 2006; 23:471-482.
17. Laine JP and Egly JM. Initiation of DNA repair mediated by a stalled RNA polymerase IIO. Embo J. 2006; 25:387-397.
18. Liu J, He C, Xing C and Yuan Y. Nucleotide excision repair related gene polymorphisms and genetic susceptibility, chemotherapeutic sensitivity and prognosis of gastric cancer. Mutat Res. 2014; 765:11-21.
19. Liu YP, Ling Y, Zhang YP and Liu BR. Predictive values of platinum-related gene polymorphisms in gastric cancer patients on oxaliplatin-based adjuvant chemotherapy [Article in Chinese]. Zhonghua Yi Xue Za Zhi. 2011; 91:256-259.
20. Han SW, Oh DY, Im SA, Park SR, Lee KW, Song HS, Lee NS, Lee KH, Choi IS, Lee MH, Kim MA, Kim WH, Bang YJ and Kim TY. Epidermal growth factor receptor intron 1 CA dinucleotide repeat polymorphism and survival of advanced gastric cancer patients treated with cetuximab plus modified FOLFOX6. Cancer Sci. 2010; 101:793-799.
21. Zou HZ and Yang SJ. Prediction role of seven SNPs of DNA repair genes for survival of gastric cancer patients receiving chemotherapy. Asian Pac J Cancer Prev. 2012; 13:6187-6190.
22. Kamileri I, Karakasilioti I and Garinis GA. Nucleotide excision repair: new tricks with old bricks. Trends Genet. 2012; 28:566-573.
23. Ng JM, Vermeulen W, van der Horst GT, Bergink S, Sugasawa K, Vrieling H and Hoeijmakers JH. A novel regulation mechanism of DNA repair by damage-induced and RAD23-dependent stabilization of xeroderma pigmentosum group C protein. Genes Dev. 2003; 17:1630-1645.
24. Friedberg EC. How nucleotide excision repair protects against cancer. Nat Rev Cancer. 2001; 1:22-33.
25. Li C, Yin M, Wang LE, Amos CI, Zhu D, Lee JE, Gershenwald JE, Grimm EA and Wei Q. Polymorphisms of nucleotide excision repair genes predict melanoma survival. J Invest Dermatol. 2013; 133:1813-1821.
26. Wyss AB, Weissler MC, Avery CL, Herring AH, Bensen JT, Barnholtz-Sloan JS, Funkhouser WK, Olshan AF, Li C, Yin M, Wang LE, Amos CI, Zhu D, Lee JE, Gershenwald JE, Grimm EA, et al. Single nucleotide polymorphisms in nucleotide excision repair genes, cancer treatment, and head and neck cancer survival. Cancer Causes Control. 2014; 25:437-450.
27. Liu JW, He CY, Sun LP, Xu Q, Xing CZ and Yuan Y. The DNA repair gene ERCC6 rs1917799 polymorphism is associated with gastric cancer risk in Chinese. Asian Pac J Cancer Prev. 2013; 14:6103-6108.
28. Hamajima N, Naito M, Kondo T and Goto Y. Genetic factors involved in the development of Helicobacter pylori-related gastric cancer. Cancer Sci. 2006; 97:1129-1138.
29. Tabor HK, Risch NJ and Myers RM. Candidate-gene approaches for studying complex genetic traits: practical considerations. Nat Rev Genet. 2002; 3:391-397.
30. Yuan HY, Chiou JJ, Tseng WH, Liu CH, Liu CK, Lin YJ, Wang HH, Yao A, Chen YT and Hsu CN. FASTSNP: an always up-to-date and extendable service for SNP function analysis and prioritization. Nucleic Acids Res. 2006; 34:W635-641.