
INTRODUCTION
Head and neck squamous cell carcinoma is the fifth most common cancer worldwide [1]. Multimodal management of non-metastatic disease includes surgery, radiotherapy, and chemotherapy. Prognosis of patients remains poor when they recur, with more than half of locally advanced HNSCC patients who recur [2, 3].
The Cancer Genome Atlas (TCGA) recently published the whole genome analysis of HNSCC, reporting DNA mutations, gene copy number alterations and main altered expressed genes [4]. Cetuximab, that targets EGFR, is the only approved targeted agent in combination with radiotherapy for HNSCC treatment in the recurrent and/or metastatic setting [5, 6]. Cetuximab lacks a predictive biomarker of efficacy.
We aimed in our study at identifying druggable molecular alterations at the RNA level from untreated HNSCC patients, and at assessing their prognostic significance in order to find new targetable genes that could be of interest for new treatment strategies.
RESULTS
Patient characteristics
We analyzed tumor samples from 96 untreated HNSCC patients treated with primary surgery at Institut Curie (Paris, France) between 1990 and 2006. Patient characteristics are presented in Table 1. Median follow-up was 125 months (range: 2.6 days to 236 months). Median age was 56, most of patients were male and heavy smokers (mean pack years = 19). Twelve patients had HPV-positive tumors (Table 1).
Table 1: Clinical, biological and pathological characteristics of the 96 HNSCC patients, in relation with disease-free interval (DFI)
Patients (%) |
Eventsa(%) |
DFIb |
|
|---|---|---|---|
Total |
96 (100) |
45 (46.8) |
|
Age |
|||
< 56 |
46 (47.9) |
23 (42.6) |
0.62 (NS) |
≥ 56 |
50 (52.1) |
22 (52.4) |
|
Sexe |
|||
Female |
19 (19.8) |
8 (42.1) |
0.81 (NS) |
Male |
77 (80.2) |
37 (48.1) |
|
Alcoolc |
|||
Yes |
50 (70.4) |
24 (48) |
0.32 (NS) |
No |
21 (29.6) |
8 (38.1) |
|
Tobaccod |
|||
Yes |
58 (72.5) |
28 (48.3) |
0.42 (NS) |
No |
22 (27.5) |
7 (31.8) |
|
HPV |
|||
Negative |
84 (87.5) |
42 (50) |
0.036 |
Positive |
12 (12.5) |
3 (25) |
|
AJCC stage |
|||
Stage I |
10 (10.4) |
5 (50) |
0.69 (NS) |
Stage II |
15 (15.6) |
6 (40) |
|
Stage III |
12 (12.5) |
4 (33.3) |
|
Stage IV |
59 (61.5) |
30 (50.8) |
|
Tumor location |
|||
Oral cavity |
43 (44.8) |
22 (51.2) |
0.072 (NS) |
Larynx |
17 (17.7) |
8 (47.1) |
|
Oropharynx |
20 (20.8) |
5 (25) |
|
Hypopharynx |
16 (16.7) |
10 (62.5) |
aEvents: local or metastatic recurrence, second cancer.
bLog-rank test.
cTobacco use was considered at 10 packyears or more. Information available for 71 patients.
dAlcohol use was considered at 10 gr/day or more (ie. alcohol unit). Information available for 80 patients.
DFI: disease-free interval; NS: not significant; HNSCC: head and neck squamous cell carcinoma.
AJCC: American Joint Committee on Cancer.
mRNA expression of the 42 targetable genes
To determine the cut-off point for the 42 genes expression in HNSCCs, all mRNA values were determined for the 27 normal head and neck RNA samples. As these values remained under 3, normalized mRNA values of 3 or more were considered to represent gene overexpression in tumor samples. We previously used the same cut-off points for tumor gene overexpression [7].
The mRNA levels of all targetable genes were detectable and quantifiable by real-time quantitative RT-PCR based on fluorescence SYBR Green method (Cycle Threshold, Ct < 32), in both the normal and tumorous head and neck tissue (except for ALK and ROS1). Medians and ranges of mRNA levels for the 40 expressed genes and controls CCND1, MKI67 are shown in Table 2, along with the percentages of gene overexpression. In our series of 96 HNSCCs, PGF, PDL1/CD274, CDK6, MET, EGFR and VEGFA were the most frequently over-expressed genes in respectively 30%, 28%, 21%, 18%, 14% and 14% of the samples. Six additional genes were overexpressed in 3% to 8% of the samples (i.e. IGF1R, RET, CDK4, KITLG, PDGFRB and PIK3CA). CCND1 and MKI67, used as prognostic controls, were overexpressed in 27% and 31% of samples, respectively.
Table 2: mRNA expression of 40 expressed druggable genes and CCND1, MKI67 in HNSCC relative to normal head and neck tissue and percentages of overexpressed tumors
Genes |
Ct median of normal |
Normal head and |
HNSCC (n = 96) |
% of overexpressed |
|---|---|---|---|---|
PGF |
29.12 (27.97–30.25)a |
1.00 (0.37–2.26)b |
1.93 (0.57–15.5) |
30.2% |
PDL1 |
28.60 (26.35–32.59) |
1.00 (0.12–2.95) |
1.67 (0.06–23.40) |
28.1% |
CDK6 |
25.29 (23.88–27.41) |
1.00 (0.32–1.62) |
2.25 (0.33–8.32) |
20.8% |
MET |
27.28 (25.33–28.42) |
1.00 (0.30–1.91) |
1.87 (0.21–16.5) |
17.7% |
EGFR |
26.00 (24.08–27.31) |
1.00 (040–2.12) |
1.51 (0.21–46.1) |
13.5% |
VEGFA |
25.70 (23.64–28.17) |
1.00 (0.34–2.32) |
1.43 (0.19–10.25) |
13.5% |
IGF1R |
27.97 (26.07–30.90) |
1.00 (0.29–2.50) |
1.36 (0.18–4.62) |
8.3% |
RET |
29.86 (26.86–32.75) |
1.00 (0.16–2.90) |
0.57 (0.05–26.5) |
7.3% |
CDK4 |
24.95 (24.11–26.67) |
1.00 (0.67–1.38) |
1.39 (0.76–4.19) |
7.3% |
KITLG |
27.76 (21.04–29.91) |
0.96 (0.34–2.55) |
0.85 (0.09–3.99) |
4.2% |
PDGFRB |
25.23 (23.38–26.21) |
1.00 (0.21–1.89) |
1.02 (0.13–4.60) |
3.1% |
PIK3CA |
25.92 (25.19–27.51) |
1.00 (0.67–1.76) |
1.14 (0.52–5.24) |
3.1% |
FGFR1 |
24.84 (23.62–26.29) |
1.00 (0.25–1.84) |
0.37 (0.08–4.48) |
2.1% |
FGFR3 |
25.23 (22.55–32.47) |
1.00 (0.01–2.95) |
0.73 (0.03–4.38) |
2.1% |
IGF2 |
24.46 (22.23–26.06) |
1.00 (0.15–2.91) |
0.32 (0.00–3.90) |
2.1% |
SRC |
26.69 (24.87–30.29) |
1.00 (0.12–2.11) |
1.39 (0.68–3.23) |
2.1% |
VEGFR3 |
28.51 (26.93–29.74) |
1.00 (0.48–2.35) |
0.61 (0.14–3.52) |
2.1% |
SMO |
27.75 (26.01–30.00) |
1.00 (0.34–2.45) |
0.65 (0.06–4.77) |
2.1% |
DLL4 |
27.87 (26.26–29.83) |
1.00 (0.33–2.76) |
0.98 (0.38–3.63) |
2.1% |
ERBB2 |
25.75 (23.78–29.99) |
1.00 (0.10–2.36) |
0.42 (0.08–3.56) |
1.0% |
FGFR2 |
25.76 (23.33–33.59) |
1.00 (0.00–2.11) |
0.45 (0.07–4.06) |
1.0% |
KIT |
28.19 (25.45–30.88) |
1.00 (0.21–2.80) |
0.26 (0.05–3.44) |
1.0% |
ERBB3 |
25.96 (23.59–31.12) |
1.00 (0.05–2.86) |
0.48 (0.08–1.54) |
0.0% |
ERBB4 |
29.95 (26.09–34.76) |
1.00 (0.03–2.97) |
0.03 (0.00–1.99) |
0.0% |
HGF |
29.70 (27.66–31.12) |
1.00 (0.26–2.91) |
0.33 (0.05–2.24) |
0.0% |
CSF1R |
25.97 (24.54–27.46) |
1.00 (0.47–2.38) |
0.76 (0.00–2.70) |
0.0% |
PDGFRA |
25.27 (24.13–25.94) |
1.00 (0.35–1.99) |
0.47 (0.07–2.40) |
0.0% |
DDR2 |
26.76 (24.66–27.60) |
1.00 (0.29–2.70) |
0.52 (0.07–1.75) |
0.0% |
VEGFR1 |
26.04 (24.26–27.96) |
1.00 (0.30–2.82) |
0.88 (0.25–2.68) |
0.0% |
VEGFR2 |
27.26 (25.74–28.42) |
1.00 (0.35–1.65) |
0.46 (0.12–1.78) |
0.0% |
VEGFB |
26.33 (24.53–30.32) |
1.00 (0.16–2.52) |
0.63 (0.09–1.74) |
0.0% |
STAT3 |
23.32 (22.00–24.61) |
1.00 (0.57–2.27) |
0.84 (0.24–1.64) |
0.0% |
MDM2 |
24.71 (22.75–26.12) |
1.00 (0.39–1.73) |
0.86 (0.27–2.83) |
0.0% |
ABL1 |
25.22 (24.22–26.48) |
1.00 (0.52–2.95) |
0.69 (0.20–2.03) |
0.0% |
NOTCH1 |
27.82 (25.93–29.22) |
1.00 (0.36–2.03) |
0.71 (0.12–2.23) |
0.0% |
NOTCH2 |
26.13 (25.14–27.75) |
1.00 (0.47–2.15) |
0.72 (0.16–1.67) |
0.0% |
NOTCH4 |
27.72 (26.51–29.10) |
1.00 (0.42–2.95) |
0.65 (0.07–2.40) |
0.0% |
JAK2 |
25.75 (24.28–26.87) |
1.00 (0.41–2.58) |
0.48 (0.07–2.51) |
0.0% |
TEK |
27.20 (25.85–28.30) |
1.00 (0.24–2.49) |
0.29 (0.07–1.42) |
0.0% |
AKT1 |
24.72 (23.64–26.40) |
1.00 (0.66–1.61) |
1.12 (0.49–2.15) |
0.0% |
CCND1 |
23.87 (21.70–27.36) |
1.00 (0.14–2.91) |
1.44 (0.19–13.85) |
27.0% |
MKI67 |
27.36 (25.13–35.33) |
1.00 (0.00–1.58) |
2.39 (0.61–13.37) |
31.3% |
aMedian (range) of gene Ct (Cycle threshold) values.
bMedian (range) of gene mRNA levels. The mRNA values of the samples were normalized such that the median of the 27 normal head and neck mRNA values was 1.
The mRNA levels of ALK and ROS1 were low (Cycle Threshold, Ct > 32) in the normal head and neck tissue. Only 4 (4%) tumor samples showed ALK overexpression. ROS1 was highly differentially expressed across tumor samples: mRNA levels were high (Cycle Threshold, Ct < 32) in 63% and low (Cycle Threshold, Ct > 32) in 38% of samples. Immunohistochemical analysis (IHC) of ALK and ROS1 was considered IHC-negative (H score = 0 to 1) in some of the most overexpressed samples for these 2 genes (data not shown).
We also sought for EGFRVIII variant expression in our series of 96 HNSCCs, only 3 tumors showed a very low expression of this variant (Ct≈35) (data not shown).
HRAS, NRAS, KRAS and PIK3CA mutations
Mutation frequencies of classical theragnostic genes HRAS, NRAS and PIK3CA were 3.1%, 1.0% and 8.3% respectively. No KRAS mutation was identified. None of the 3 PIK3CA mutated tumors had PIK3CA overexpression.
mRNA levels of EGFR, MET and CDK6 compared to protein expression
We detected specific expression for EGFR, MET and CDK6 proteins in tumor cells of all tumor samples studied by IHC. Groups of three tumor samples studied by IHC were selected from the most RNA-overexpressed samples for EGFR, MET or CDK6, respectively. Three additional groups of tumor samples were selected from normally expressed samples for both EGFR, MET and CDK6.
A moderate to intense cytoplasmic staining of tumor cells (H score = 2 to 3) with EGFR and MET Abs, and a moderate to intense nuclear staining of tumor cells (H score = 2 to 3) with CDK6 Abs were considered to define IHC positivity (Figure 1).
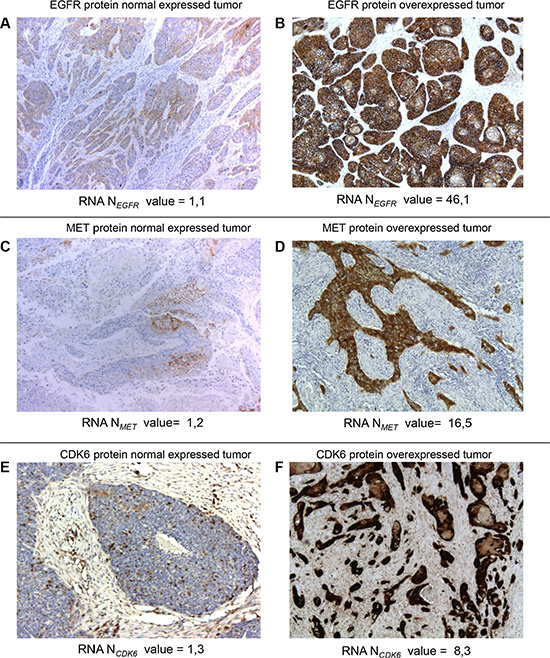
Figure 1: Normal and overexpressed tumors at the protein and mRNA levels for EGFR, MET and CDK6. Immunohistochemical staining for EGFR (A, B), MET (C, D) and CDK6 (E, F) proteins in HNSCC tumors. Examples of three tumors with EGFR (A), MET (C) and CDK6 (E) normal mRNA-expressions and three tumors with EGFR (B), MET (D) and CDK6 (F) mRNA-overexpressions. Intense EGFR (B), MET (D) and CDK6 (F) immunoreactivity was found in tumor epithelial cells from the EGFR, MET, CK6 mRNA-overexpressing tumors but not in cells from the tumor without EGFR, MET, CK6 mRNA-overexpression (A, C, E) (original magnification × 50).
We detected strong specific immunoreactivity in tumor cells of the 3 tumors which had RNA-overexpression for EGFR, MET and CDK6. On the contrary, none of the 3 tumors which were normally expressed for EGFR, MET and CDK6 mRNA were considered IHC positive. We thus obtained a strong match between EGFR, MET and CDK6 mRNA overexpression and IHC positivity (Figure 1).
Relationship between gene expressions of the 6 most overexpressed genes
We tested, using the Spearman rank correlation test, the possible relation between mRNA levels of the 6 most overexpressed genes: PGF, PDL1/CD274, CDK6, MET, EGFR and VEGFA, as well as the proliferation marker MKI67. We observed a marked positive association (i.e. Spearman’s rank correlation coefficient r > 0.3) between MET and CDK6 (p < 0.001), PGF and VEGFA (p < 0.001), EGFR and CDK6 (p = 0.001) (Table 3). No marked correlation could be observed with MKI67 expression.
Table 3: Relationship between gene expressions of the 6 most overexpressed genes in our series of 96 HNSCCs
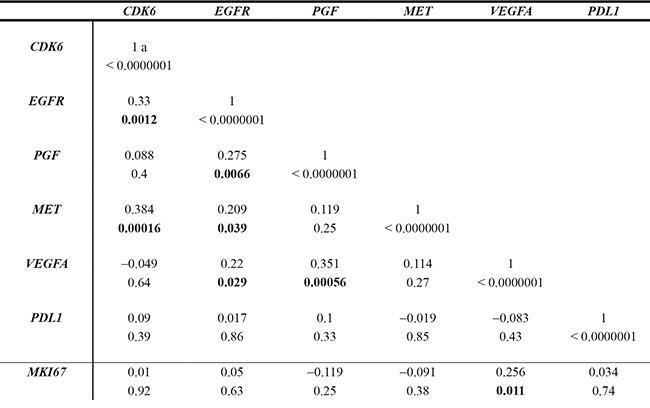
aSpearman rank correlation test.
Qualitatively, 8 of the VEGFA overexpressed tumors (8/13, 62%) were also PGF overexpressed, as compared to only 21 (21/83, 25%) of the VEGFA non-overexpressed tumors. We observed, using Chi2-square test, a positive association between VEGFA overexpression status (Ntarget > 3) and PGF overexpression (p = 0.02).
Prognostic value of overexpressed genes
To further investigate whether mRNA expression of the 12 most frequently overexpressed genes (PGF, PDL1/CD274, CDK6, MET, EGFR, VEGFA, IGF1R, RET, CDK4, KITLG, PDGFRB and PIK3CA) could be of prognostic relevance, the log-rank test was used to identify relations between DFI (disease-free interval) and mRNA expression (Table 4). A total of 45 events has been observed. Results showed that DFI was significantly influenced by PDGFRB (p = 0.0055), PIK3CA (p = 0.03) overexpression status (Ntarget>3), as well as CCND1 overexpression status (p < 0.001), used as control. Area under curve analyses (as determined in Materials and methods section) were then performed to identify a putative cut-point by which to divide the cohort into 2 relevant gene expression subgroups for PDGFRB, PIK3CA and CCND1. Results confirmed that the DFI of patients with high PDGFRB expressing tumors was shorter than the DFI of patients with low PDGFRB expressing tumors (p = 0.03). Same results were observed for patients with high PIK3CA expressing tumors (p < 0.001), as well as for patients with high CCND1 expressing tumors (p = 0.02), used as controls (Figure 2).
Table 4: Relationship between most overexpressed genes mRNA levels and disease-free interval (DFI) in the 96 HNSCC
Gene mRNA |
Population |
Events |
p-valuea |
Gene mRNA expression |
Population |
Events |
p-valuea |
|---|---|---|---|---|---|---|---|
Whole population (%) |
96 (100) |
45 (46,9) |
|||||
PGF |
|||||||
No overexpression |
67 (69.8) |
30 (44.8) |
0.77 (NS) |
||||
Overexpression |
29 (30.2) |
15 (51.7) |
|||||
PDL1 |
|||||||
No overexpression |
69 (71.9) |
34 (49.3) |
0.36 (NS) |
||||
Overexpression |
27 (28.1) |
11 (40.7) |
|||||
CDK6 |
|||||||
No overexpression |
76 (79.2) |
37 (48.7) |
0.62 (NS) |
||||
Overexpression |
20 (20.8) |
8 (40.0) |
|||||
MET |
|||||||
No overexpression |
79 (82.3) |
37 (46.8) |
0.28 (NS) |
||||
Overexpression |
17 (17.7) |
8 (47.1) |
|||||
EGFR |
|||||||
No overexpression |
83 (86.5) |
38 (45.8) |
0.74 (NS) |
||||
Overexpression |
13 (13.5) |
7 (53.8) |
|||||
VEGFA |
|||||||
No overexpression |
83 (86.5) |
40 (48.2) |
0.46 (NS) |
||||
Overexpression |
13 (13.5) |
5 (38.5) |
|||||
IGF1R |
|||||||
No overexpression |
88 (91.7) |
41 (46.6) |
0.98 (NS) |
||||
Overexpression |
8 (8.3) |
4 (50.0) |
|||||
RET |
|||||||
No overexpression |
89 (92.7) |
40 (44.9) |
0.35 (NS) |
||||
Overexpression |
7 (7.3) |
5 (71.4) |
|||||
CDK4 |
|||||||
No overexpression |
89 (92.7) |
41 (46.1) |
0.44 (NS) |
||||
Overexpression |
7 (7.3) |
4 (57.1) |
|||||
KITLG |
|||||||
Normal expression |
92 (95.8) |
43 (46.7) |
0.81 (NS) |
||||
Overexpression |
4 (4.2) |
2 (50.0) |
|||||
PDGFRB |
PDGFRB |
||||||
No overexpression < 3 |
93 (96.9) |
42 (45.2) |
0.0055 |
Low expression ≤ 1.14 |
52 (54.1) |
21 (40) |
0.03 |
Overexpression > 3 |
3 (3.1) |
3 (100) |
High expression >1.14 |
44 (45.9) |
24 (54.5) |
||
PIK3CA |
PIK3CA |
||||||
No overexpression < 3 |
93 (96.9) |
43 (46.2) |
0.03 |
Low expression ≤ 1.15 |
50 (52.1) |
18 (36) |
< 0.001 |
Overexpression > 3 |
3 (3.1) |
2 (66.7) |
High expression > 1.15 |
46 (47.9) |
27 (58.7) |
||
CCND1 |
CCND1 |
||||||
No over expression < 3 |
70 (89.6) |
8 (30.8) |
< 0.001 |
Low expression ≤ 2 |
59 (61.4) |
24 (40.7) |
0.02 |
Overexpression > 3 |
26 (10.4) |
18 (69.2) |
High expression > 2 |
37 (38.6) |
21 (56.7) |
aHazard ratio.
b95% Confidence Interval.
cMultivariate analysis.
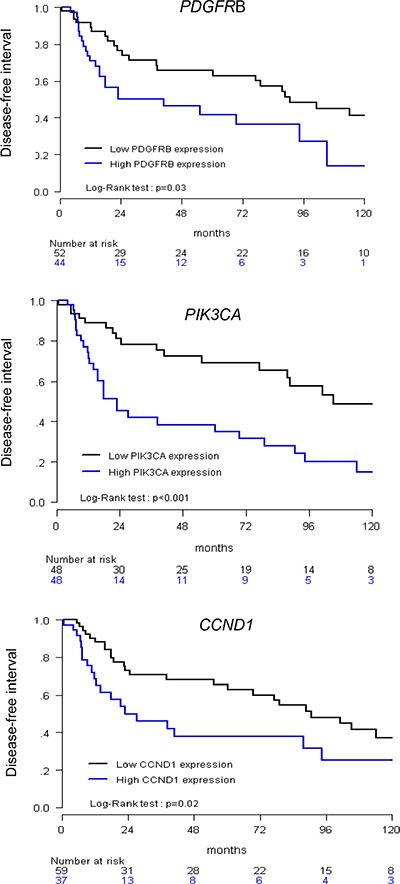
Figure 2: Relationship between disease-free interval (DFI) and CCND1, PIK3CA and PDGFRB expression. High versus low expression was determined according to an optimal cut-off.
Univariate analysis (log-rank test) thus showed that DFI was significantly linked to HPV status (p = 0.036), and same trend was observed for tumor location (p = 0.072) (Table 1). DFI was also significantly influenced by PDGFRB, PIK3CA and CCND1 mRNA high expression status (p = 0.03, p < 0.001 and p = 0.02, respectively) (Figure 2). Multivariate analysis was performed including these 5 parameters (p < 0.1 in univariate analysis, Table 1): only PIK3CA (p = 0.0055) high expression remained an independent significant prognostic factor for DFI, but not PDGFRB (p = 0.10) and CCND1 (p = 0.22) expression, HPV status (p = 0.21) and tumor location (p = 0.42) (Table 5).
Table 5: Multivariate analysis of DFI in our series of 96 HNSCCs
HRa |
95% CIb |
p-valuec |
||
|---|---|---|---|---|
RNA expression levels |
||||
PDGFRB |
Low ≤ 1.14 |
1 |
||
High > 1.14 |
1.66 |
0.91–3.03 |
0.10 (NS) |
|
PIK3CA |
Low ≤ 1.15 |
1 |
||
High > 1.15 |
2.61 |
1.33–5.15 |
0.0055 |
|
CCND1 |
Low ≤ 2 |
1 |
||
High > 2 |
1.49 |
0.79–2.81 |
0.22 (NS) |
|
Clinico-pathological parameters |
||||
HPV |
Negative |
1 |
||
Positive |
0.38 |
0.11–1.29 |
0.12 (NS) |
|
Tumor Location |
Oral cavity |
1 |
||
Oropharynx |
0.87 |
0.64–1.18 |
0.39 (NS) |
|
Hypopharynx |
0.76 |
0.42–1.40 |
||
Larynx |
0.67 |
0.27–1.97 |
||
aHazard ratio.
b95% Confidence Interval.
cMultivariate analysis.
We also sought links between PIK3CA expression (low versus high) and standard clinicopathological and biological factors in HNSCC. Significant positive associations were observed between patients with high PIK3CA expressing tumors and male gender (p = 0.0089), alcohol consumption (p = 0.013), tobacco use (p = 0.036), high AJCC Stage (p = 0.014) and hypopharynx location (p = 0.0011) (Table S3).
DISCUSSION
Among the 42 genes analyzed, our study reveals that 6 are relevant targets in head and neck squamous cell carcinoma: PGF, PDL1/CD274, CDK6, EGFR, MET, VEGFA. Almost a third of the tumors harbored an alteration of PGF, more than a quarter an alteration of PDL1/CD274, a fifth an alteration of CDK6 and between 10 to 20% of the tumors presented EGFR, MET or VEGFA alterations. By using immunohistochemical analysis, we showed that overexpressed EGFR, MET and CDK6 transcripts translated into overexpressed proteins, suggesting that these 3 gene expressions are mainly dysregulated at the transcriptional level in HNSCC.
All these 6 genes (PGF, PDL1/CD274, CDK6, EGFR, MET, VEGFA) are involved in crucial tumorogenesis pathways and thus their related proteins represent potential targets for new drugs. PGF and VEGFA are ligands of angiogenesis. CDK6 participates to the regulation of G1 restriction point, S phase entry and cell proliferation. EGFR activation plays an important role in malignant cell proliferation, angiogenesis, metastasis and inhibition of apoptosis, and PD1 plays a critical role in tumor immune evasion.
At the DNA level, we focused on 4 main oncogenes: HRAS, NRAS, KRAS and PIK3CA. Despite RAS family is known to be a marker of cetuximab resistance, RAS mutations appeared to be infrequent in our series (5%, 3 HRAS and 1 NRAS mutated tumors), and do not make RAS an attractive target. The incidence of PIK3CA mutations in our study is in the same range than reported in COSMIC. PIK3CA mutations are also known to be a marker of cetuximab resistance [8]. Interestingly, PIK3CA high expression was an independent unfavorable prognostic marker. This finding may have therapeutic implications. Agents that targets PI3K/AKT/mTOR pathway have already been evaluated in HNSCC. Temsirolimus demonstrated a progression-free survival rate of 40% in patients refractory to cetuximab and platinum [9]. Everolimus in combination with induction chemotherapy provided encouraging efficacy results with an overall response rate of 79% in locally advanced tumors [10]. A partial response in a heavily pretreated patient harboring a PIK3CA mutation was observed with BYL719, an α-specific PI3K inhibitor [11]. On the opposite, no improvement has been observed with the addition of the panPI3K inhibitor PX-866 to docetaxel in patients with advanced HNSCC without any molecular selection [12].
These discrepancies enhanced the need of predictive markers for PI3K inhibitors. It would also be worth to evaluate these agents specifically in a poor prognostic context and in an enriched population with PIK3CA mutations and/or overexpression. The correlation we observed between PIK3CA overexpression and clinicopathological and biological characteristics has previously been reported [13, 14].
Our findings are concordant with the TCGA data [4]. In both series, we observed alterations of tyrosine kinase receptors, RAS and PIK3CA pathways, cell cycle regulation and also immune evasion. However, there are important differences in terms of prevalences. We observed only 8% of PIK3CA mutations, whereas 21% are described in TCGA. At the RNA level we observed 3% of overexpression of PIK3CA versus 22% in TCGA series. These differences may be explained by the patient population with different tumor site and HPV status. In our series 45% of tumors derived from oral cavity versus 62% in TCGA. We included 17% of hypopharynx tumors versus none in TCGA. Only 12% of our tumors were HPV positive but a quarter was HPV positive in TCGA. These observations are crucial as we know that HPV induces a specific tumorogenesis and PIK3CA alterations are enriched in HPV positive population [15]. Noteworthy, tumor stage was not found to be a significant prognostic factor in our study. This might be due to the limited number of small tumors.
Our findings are noticeable because targeted drugs against the 6 relevant genes are available. In addition for 3 of these genes (EGFR, MET and CDK6), the good correlation between gene expression and protein expression by IHC would allow a wide and easy screening in clinical practice. To date, cetuximab is the only targeted drug used in HNSCC, but all HNSCC patients are eligible to this therapy without any molecular selection. Our data suggest that eligible tumors for cetuximab could be selected from the 13.5% EGFR RNA-overexpressed HNSCC. Indeed, the 13 EGFR-overexpressed samples in our series did not have any HRAS, NRAS, KRAS or PIK3CA mutation. New drugs have been developed and evaluated in other cancer types and might be interesting in HNSCC. Small inhibitor molecules of CDK 4/6 (e.g. palbociclib) have been currently approved in metastatic breast cancer by FDA and the EMA authorization is pending [16]. A clinical trial is evaluating the combination of cetuximab and palbociclib in recurrent or metastatic HNSCC (NCT02499120). MET inhibitors are also available and are currently evaluated (e.g. tivantinib, cabozantinib, crizotinib). These last years, immunotherapy has made its come-back with immune checkpoint inhibitors (e.g. pembrolizumab, nivolumab). In recurrent and/or metastatic HNSCC, Seiwert et al. have already reported a 50% of disease control rate (25% of overall response and 25% disease stabilization) in an expansion cohort with pembrolizumab [17]. Several phase II and III trials are currently ongoing and evaluate pembrolizumab in monotherapy or in combination with chemotherapy in recurrent and/or metastatic HNSCC (NCT02252042, NCT02358031, NCT02255097). Despite disappointing results with first generation of antiangiogenics, angiogenesis remains an important step in tumorigenesis [18, 19]. VEGF-trap is a second generation antiangiogenic agent. Like bevacizumab, it neutralizes all VEGF-A isoforms but it also inhibits other antiangiogenic ligands: VEGF-B and PGF. As, PGF is overexpressed in approximately 30% of HNSCC in our series, and correlates with VEGFA overexpression, its ability to predict response warrants further investigation.
The overexpressed genes identified in our series were only overexpressed in a fraction of HNSCC. It will therefore be necessary to test their value as predictive biomarkers of response to targeted drugs. Window of opportunity trials are good tools to assess their values. Some studies are already ongoing (NCT01415674- PREDICTOR trial and NCT01538381) which aims to identifying predictive and pharmacodynamics biomarkers of efficacy to afatinib, a dual EGFR/HER2 inhibitor. Given the high number of statistical performed in our study, we cannot exclude false positive results. Our results will have to be validated on an independent cohort of patients.
In conclusion, we identified druggable overexpressed genes associated with a poor outcome. Our data need to be confirmed in another cohort but these findings might be of interest for personalizing treatment of HNSCC patients.
MATERIALS AND METHODS
Patients and samples
Patients met the following criteria: primary non metastatic HNSCC for which complete clinical, histological and biological data were available; treatment with primary surgery (no radiotherapy or chemotherapy before surgery); and full follow-up at Institut Curie. All patients signed a consent form mentioning that their tumor samples might be used for scientific purposes.
Twenty seven of adjacent normal head and neck tissue from HNSCC patients were used as sources of normal RNA. Frozen tumors were used for RNA extraction. A tumor sample was considered suitable for our study if it was extracted from primary tumor with a proportion of tumor cells exceeding 70%.
Real-time RT-PCR
The theoretical and practical aspects of real-time quantitative PCR have previously been described in detail [7].
Quantitative values were obtained from the cycle number (Cycle Threshold, Ct value) at which the increase in the fluorescence signal associated with exponential growth of PCR products started to be detected. Detection is performed by the laser detector of the ABI Prism 7900 Sequence Detection System (Perkin-Elmer Applied Biosystems, Foster City, CA), using PE Biosystems analysis software according to the manufacturer’s manuals.
As the precise amount of total RNA added to each reaction mix (based on optical density) and its quality (i.e., lack of extensive degradation) are both difficult to assess, we also quantified transcripts of an endogenous RNA control gene. TBP (Genbank accession NM_003194) [20], which encodes the TATA box-binding protein (a component of the DNA-binding protein complex TFIID), was selected as an endogenous control because the prevalence of its transcripts is moderate, and because there are no known TBP retropseudogenes (retropseudogenes lead to co-amplification of contaminating genomic DNA and thus interfere with RT-PCR, despite the use of primers in separate exons).
Each sample was normalized on the basis of its TBP content. Results, expressed as N-fold differences in target gene expression relative to the TBP gene and termed “Ntarget,” were determined as Ntarget = 2ΔCtsample, where the ΔCt value of the sample is determined by subtracting the average Ct value of the target gene from the average Ct value of the TBP gene [7, 20]. The Ntarget values of the samples were subsequently normalized such that the median of the 27 normal head and neck tissue Ntarget values was 1. RNA extraction, cDNA synthesis, and PCR conditions were as described [7].
Browsing literature [21, 22] helped us to choose a panel of 42 oncogenes coding for the major proteins directly targeted by drugs used to treat other cancers, or for proteins targeted in ongoing HNSCC clinical trials. The 42 target genes of this study are listed in Table S1. We also analyzed MKI67 and CCND1 mRNA levels as prognostic controls [23].
Primers for TBP, CCND1, MKI67 and the 42 target genes were designed with the assistance of Oligo 6.0 computer program (National Biosciences, Plymouth, MN). We searched the dbEST and nr databases to confirm the total gene specificity of the nucleotide sequences chosen as primers and the absence of single nucleotide polymorphisms. In particular, the primer pairs were selected to be unique relative to the sequences of closely related family member genes or of the corresponding retropseudogenes. To avoid amplification of contaminating genomic DNA, one of the two primers was placed at the junction between two exons or on two different exons. Agarose gel electrophoresis was used to verify the specificity of PCR amplicons. The nucleotide sequences of the oligonucleotide primers used to amplify CCND1, MKI67 and the 42 target genes are shown in Table S2.
HPV genotyping
HPV status has been assessed in the Pathology Department of Institut Curie. Total DNA, isolated from formalin-fixed tissue blocks, was used for HPV typing. Real-time PCR using Sybr®Green and specific primers for HPV16 and 18, was performed on a 7900HT Fast Real-Time PCR System (Applied Biosystems, Foster City, CA).
Mutations assessment
HRM primers for screening mutations were designed for HRAS, NRAS, KRAS (RAS exon 2, 3, 4), and PIK3CA (exon 9 and 20). PCR for HRM analysis was performed on a 384-well plate in the presence of the fluorescent DNA intercalating dye, LCgreen (Idaho Technology) in a LightCycler480® (Roche). All samples were tested in duplicate. HRM analysis was performed on the Genescan software (Roche). All samples including the wild-type were plotted according to their melting profiles on the differential plot graph. All samples were sequenced using Sanger sequencing approach, as soon as an abnormal HRM curve was suspected.
Immunohistochemistry
We performed immunohistochemical assay by using EGFR (InVitrogen, monoclonal, mouse, 31G7, 1/40, Trypsine), MET (Spring Biosciences, monoclonal, rabbit, SP44, 1/100, pH6) and CDK6 (GeneTex, monoclonal, rabbit, EPR4515, 1/100, pH 6) antibodies (Abs). IHC was performed in some samples harboring normal (Ntarget= 1) and high expression (Ntarget >3) levels for EGFR, MET and CDK6.
Sections of 3 μm were cut from the paraffin-embedded tissue blocks of HNSCCs and normal head and neck tissue. Tissue sections were deparaffinized and rehydrated through a series of xylene and ethanol washes. All immunostaining was processed by using a LEICA (BOND III) automated immunostaining device. The specificity of the antibodies was confirmed by doing immunohistochemical studies with the same protocol on paraffin-embedded human tissue sections containing lymphocytes. A semi-quantitative histological score (H score = intensity × frequency) was performed (score 0 = negative staining, score 1 = weak staining, score 2 = moderate staining, score 3 = strong staining).
Statistical analysis
The distributions of target mRNA levels were characterized by their median values and ranges. Relationships between mRNA levels of the different target genes, and clinical, biological and pathological parameters, were identified by using parametric test, namely the Chi-square test, and non-parametric tests such as Kruskal-Wallis test, and the Spearman rank correlation test. Differences between 2 populations were considered significant at confidence levels greater than 95% (P < 0.05).
Disease-free interval (DFI) was determined from the time of initial diagnosis to the time of the first event among local recurrence, metastatic recurrence or second cancer. Survival distributions were estimated by the Kaplan-Meier method, and the significance of differences between survival rates was ascertained with the log-rank test. Univariate and multivariate Cox proportional hazard models were performed to identify the clinical and molecular markers that impact the DFI. The results are presented as hazard ratios and 95% confidence intervals (CIs). To visualize the efficacy of a molecular marker (gene expression level) to discriminate two populations (patients that remained/or not disease-free at latest follow-up) in the absence of an arbitrary cut-off value, data were summarized in a ROC (receiver operating characteristic) curve [24]. The AUC (area under curve) was calculated as a single measure for discriminate efficacy. A P value less than 0.05 was considered to be statistically significant, except for univariate analysis that considered a P value less than 0.10.
Abbreviations
AJCC American Joint Committee on Cancer; AUC Area Under Curve; DFI Disease Free Interval; EGFR Epidermal Growth Factor Receptor; HNSCC Head and neck squamous cell carcinoma; HPV Human Papilloma Virus; HRM High Resolution Melting; IHC Immunohistochemistry; PCR Polymerase Chain Reaction; ROC Receiver Operating Characteristic; RT-PCR Reverse transcription Polymerase Chain Reaction; TCGA The Cancer Genome Atlas
ACKNOWLEDGMENTS AND FUNDING
This work was supported by the Fondation ARC pour la recherche sur le cancer (ARC), the Comité d’évaluation et suivi des projets de recherche de transfert of Institut Curie (CEST), and ICGEx project ANR-10-EQPX-03 (Equipement de biologie intégrative du cancer pour une médecine personnalisée). We also thank the staff of Institut Curie for assistance in specimen collection and patient care.
CONFLICTS OF INTEREST
No conflicts to disclose
REFERENCES
1. Leemans CR, Braakhuis BJM, Brakenhoff RH. The molecular biology of head and neck cancer. Nat Rev Cancer. 2011;11:9–22. doi: 10.1038/nrc2982.
2. Seiwert TY, Cohen EEW. State-of-the-art management of locally advanced head and neck cancer. Br J Cancer. 2005; 92:1341–8.
3. Marur S, Forastiere AA. Head and neck cancer: changing epidemiology, diagnosis, and treatment. Mayo Clin Proc. 2008; 83:489–501. doi: 10.4065/83.4.489.
4. Lawrence MS, Sougnez C, Lichtenstein L, Cibulskis K, Lander E, Gabriel SB, Getz G, Ally A, Balasundaram M, Birol I, Bowlby R, Brooks D, Butterfield YS, et al. Comprehensive genomic characterization of head and neck squamous cell carcinomas. Nature. 2015; 517:576–82. doi: 10.1038/nature14129.
5. Vermorken JB, Mesia R, Rivera F, Remenar E, Kawecki A, Rottey S, Erfan J, Zabolotnyy D, Kienzer HR, Cupissol D, Peyrade F, Benasso M, Vynnychenko I, et al. Platinum-based chemotherapy plus cetuximab in head and neck cancer. N Engl J Med. 2008; 359:1116–27. doi: 10.1056/NEJMoa0802656.
6. Bonner JA, Harari PM, Giralt J, Azarnia N, Shin DM, Cohen RB, Jones CU, Sur R, Raben D, Jassem J, Ove R, Kies, MS, et al. Radiotherapy plus cetuximab for squamous-cell carcinoma of the head and neck. N Engl J Med. 2006; 354:567–78.
7. Bieche I, Parfait B, Le Doussal V, Olivi M, Rio MC, Lidereau R, Vidaud M. Identification of CGA as a novel estrogen receptor-responsive gene in breast cancer: an outstanding candidate marker to predict the response to endocrine therapy. Cancer Res. 2001; 61:1652–8.
8. Wang Z, Martin D, Molinolo AA, Patel V, Iglesias-Bartolome R, Degese MS, Vitale-Cross L, Chen Q, Gutkind JS. mTOR co-targeting in cetuximab resistance in head and neck cancers harboring PIK3CA, RAS mutations. J Natl Cancer Inst. 2014; 106:dju215. doi: 10.1093/jnci/dju215
9. Grünwald V, Keilholz U, Boehm A, Guntinas-Lichius O, Hennemann B, Schmoll HJ, Ivanyi P, Abbas M, Lehmann U, Koch A, Karch A. TEMHEAD: a single-arm multicentre phase II study of temsirolimus in platin- and cetuximab refractory recurrent and/or metastatic squamous cell carcinoma of the head and neck (SCCHN) of the German SCCHN Group (AIO). Ann Oncol. 2015; 26:561–7.
10. Raymond E, Le Tourneau C, Gatineau M, Delord JP, Fayette J, Dreyer C, Tijeras-Raballand A, Albert S, Granier M, Chibaudel B, Hadengue A. CAPRA: Safety, efficacy, and translational biomarkers of weekly everolimus, carboplatin, and paclitaxel as induction therapy for locally advanced head and neck squamous cell carcinoma (HNSCC). J Clin Oncol 31. 2013; abstr 6036.
11. Gonzalez-Angulo AM, Juric D, Argiles G, Schellens JH, Burris HA, Berlin J, Middleton MR, Schuler MH, Van Geel R, Helgason T, Bootle D. Safety, pharmacokinetics, and preliminary activity of the α-specific PI3K inhibitor BYL719: results from the first-in-human study. J Clin Oncol. 2013; 31, abstr 2531.
12. Jimeno A, Bauman JE, Weissman C, Adkins D, Schnadig I, Beauregard P, Bowles DW, Spira A, Levy B, Seetharamu N, Hausman D, Walker L, Rudin CM, et al A randomized, phase 2 trial of docetaxel with or without PX-866, an irreversible oral phosphatidylinositol 3-kinase inhibitor, in patients with relapsed or metastatic head and neck squamous cell cancer. Oral Oncol. 2015; 51:383–8.
13. Kommineni N, Jamil K, Pingali UR, Addala L, M V, Naidu M. Association of PIK3CA gene mutations with head and neck squamous cell carcinomas. Neoplasma. 2015; 62:72–80.
14. Urashima M, Hama T, Suda T, Suzuki Y, Ikegami M, Sakanashi C, Akutsu T, Amagaya S, Horiuchi K, Imai Y, Mezawa H, Noya M, Nakashima A, et al. Distinct effects of alcohol consumption and smoking on genetic alterations in head and neck carcinoma. PLoS One. 2013; 8:e80828. doi: 10.1371/journal.pone.0080828.
15. Hammerman PS, Hayes DN, Grandis JR. Therapeutic Insights from Genomic Studies of Head and Neck Squamous Cell Carcinomas. Cancer Discov. 2015; 5:239– 44. doi: 10.1158/2159–8290.CD-14–1205.
16. Finn R, Crown J, Lang I, Boer K, Bondarenko I, Kulyk S, Ettl J, Patel R, Pinter T, Schmidt M, Shparyk Y, Thummala AR, Voytko NL, et al. The cyclin-dependent kinase 4/6 inhibitor palbociclib in combination with letrozole versus letrozole alone as first-line treatment of oestrogen receptor-positive, HER2-negative, advanced breast cancer (PALOMA-1/TRIO-18): a randomised phase 2 Study. 2015 Lancet Oncol. 2015; 16:25–35. doi: 10.1016/S1470–204571159–3.
17. Seiwert TY, Haddad RI, Gupta S, Mehra R, Tahara M, Berger R, Lee SH, Burtness B, Le D, Heath K, Blum A, Dolled-Filhart M, Emancipator K, et al. Antitumor activity of the anti-PD-1 antibody pembrolizumab in biomarker-unselected patients with R/M head and neck cancer: preliminary results from the KEYNOTE-012 expansion cohort. J Clin Oncol. 2015.
18. Machiels J-PH, Henry S, Zanetta S, Kaminsky M-C, Michoux N, Rommel D, Schmitz S, Bompas E, Dillies AF, Faivre S, Moxhon A, Duprez T, Guigay J. Phase II Study of Sunitinib in Recurrent or Metastatic Squamous Cell Carcinoma of the Head and Neck: GORTEC 2006–01. J Clin Oncol. 2010; 28:21–8. doi: 10.1200/JCO.2009.23.8584.
19. Cohen EE, Davis DW, Karrison TG, Seiwert TY, Wong SJ, Nattam S, Kozloff MF, Clark JI, Yan DH, Liu W, Pierce C, Dancey JE, Stenson K, et al. Erlotinib and bevacizumab in patients with recurrent or metastatic squamous-cell carcinoma of the head and neck: a phase I/II study. Lancet Oncol. 2009; 10:247–57. doi: 10.1016/S1470–204570002–6.
20. Bièche I, Onody P, Laurendeau I, Olivi M, Vidaud D, Lidereau R, Vidaud M. Real-time reverse transcription-PCR assay for future management of ERBB2-based clinical applications. Clin Chem. 1999; 45:1148–56.
21. Kandoth C, McLellan MD, Vandin F, Ye K, Niu B, Lu C, Xie M, Zhang Q, McMichael JF, Wyczalkowski MA, Leiserson MDM, Miller CA, Welch JS et al. Mutational landscape and significance across 12 major cancer types. Nature. 2013; 502:333–9. doi: 10.1038/nature12634.
22. Agrawal N, Frederick MJ, Pickering CR, Bettegowda C, Chang K, Li RJ, Fakhry C, Xie TX, Zhang J, Wang J, Zhang N, El-Naggar AK, Jasser SA, et al. Exome Sequencing of Head and Neck Squamous Cell Carcinoma Reveals Inactivating Mutations in NOTCH1. Science. 2011; 333:1154–7.doi: 10.1126/science.1206923
23. Musgrove EA, Caldon CE, Barraclough J, Stone A, Sutherland RL. Cyclin D as a therapeutic target in cancer. Nat Rev Cancer. 2011; 11:558–72. doi: 10.1038/nrc3090.
24. Harrell FE, Lee KL, Mark DB. Tutorial in biostatistics: multivariable prognostic models: issues in developing models, evaluating assumptions and adequacy, and measuring and reducing errors. Statistics in Medicine. 1996; 15:361–387.