
INTRODUCTION
Colorectal cancer (CRC) is the third most common malignancy and the fourth leading cause of cancer worldwide. During the past 10 years, the incidence of CRC in China has increased 4-6% annually, representing 376.3 and 191.0 thousand new cases and deaths in 2015, respectively [1, 2]. Surgical resection is the mainstay curative treatment modality. However, approximately 20-45% patients develop metastasis and/or recurrence disease [3, 4]. Therefore, fluoropyrimidine-based chemotherapy regimens are recommended as adjuvant treatment for patients with stage III or stage II with risk factors after curative-intent resection.
In the past, abundant evidence has suggested the important role of aberrant lipid metabolism in the pathogenesis and progression of cancers [5-7]. Recently, chemotherapy drugs were reported to affect lipid profiles. For instance, significant increases of serum total cholesterol and low-density lipoprotein cholesterol (LDL-C) were observed after effective chemotherapy in patients with malignant lymphoma, small-cell lung carcinoma and urothelial-cell carcinoma but not breast cancer [8]. In metastatic CRC patients, decreased LDL-C and cholesterol and increased high-density lipoprotein cholesterol (HDL-C) were observed after anti-angiogenic combined chemotherapy [9]. However, these reports were based on a small number of patients and varied among different cancer types.
It remains unclear whether lipid alterations exist in CRC patients receiving fluoropyrimidine-based adjuvant chemotherapy. Furthermore, given the association between aberrant lipid metabolism and the pathogenesis and progression of cancers whether chemotherapy-related lipid alterations play roles in the prognosis of CRC is also speculative. Based on this knowledge, we conducted this retrospective study in CRC patients after radical resection to investigate the fluctuations of lipid profiles after the fluoropyrimidine-based adjuvant chemotherapy and assessed its roles in prognosis.
RESULTS
Patient characteristics
Table 1 presents the baseline clinicopathological characteristics of cohort 1 and 2. Cohort 1 included 667 CRC patients who underwent fluoropyrimidine-based adjuvant chemotherapy, whereas cohort 2 consisted of 184 contemporary patients not undergoing chemotherapy. The median age was 55 years in cohort 1 but was relatively older in cohort 2 (Median: 62.5 years). The population in both cohorts was predominantly comprised of men. The distribution of TNM stages was approximately equally distributed between stage II (42.9%) and III (57.1%) in cohort 1 but was predominated by stage II (80.1%) in cohort 2. The chemotherapy regimens administered in cohort 1 consisted of CapeOx (61.8%, 412 patients), FOLFOX (24.1%, 161 patients), capecitabine (10.6%, 71 patients), 5- fluorouracil (FU)/ leucovorin (LV) (2.4%, 16 patients) and other regimens including fluoropyrimidine-agents (1.0%, 7 patients). 5-Fu/LV or capecitabine was predominantly delivered to stage II patients (86.2%, 72/87 patients), while FOLFOX or CapeOx was mainly administrated in those with stage III disease (63.7%, 365/573 patients). All patients in cohort 1 had received adjuvant chemotherapy, and 115 (17.2%) of the patients with rectal cancer also had received pre- or post-operative radiotherapy. One hundred eleven patients (16.6%) received concurrent chemotherapy, including CapeOx (82.9%), capecitabine (2.7%), FOLFOX (12.6%), or S-1(1.8%).
Table 1: Clinicopathological characteristics of included study cohorts (cohort 1: N = 667; cohort 2: N = 184).
Characteristics and lipid fluctuation |
Cohort 1 (N = 667) |
Cohort 2 (N = 184) |
P value |
|
N (%) |
N (%) |
|||
Age at diagnosis |
Median (range) |
55 (23-75) |
62.5 (20-82) |
|
≤ 65 year |
566 (84.9) |
106 (57.6) |
< 0.001 |
|
> 65 year |
101 (15.1) |
78 (42.4) |
||
Gender |
Male |
417 (62.5) |
110 (59.8) |
0.499 |
Female |
250 (37.5) |
74 (40.2) |
||
BMI |
Median (range) |
22.6 (13.5-34.3) |
22.2 (14.8-34.9) |
|
< 24 kg/m2 |
440 (66.0) |
127 (29) |
0.437 |
|
≥ 24 kg/m2 |
227 (34.0) |
57 (31) |
||
Location of primary tumor |
Colon |
340 (51.0) |
101 (54.9) |
0.347 |
Rectum |
327 (49.0) |
83 (45.1) |
||
Histological subtype |
Non-mucinous |
609 (91.3) |
168 (91.3) |
1.000 |
Mucinous |
58 (8.7) |
16 (8.7) |
||
Tumor grade |
G1 |
148 (22.2) |
32 (17.4) |
0.158 |
G2-3 |
519 (77.8) |
152 (82.6) |
||
T-stage |
pT1-3 |
138 (20.8) |
30 (16.3) |
0.186 |
pT4 |
529 (79.3) |
154 (83.7) |
||
N-stage |
pN0 |
286 (42.9) |
135 (73.4) |
< 0.001 |
pN1-2 |
381 (57.1) |
49 (26.6) |
||
TNM-stage |
Stage I |
0 (0) |
4 (2.2) |
< 0.001 |
Stage II |
286 (42.9) |
129 (80.1) |
||
Stage III |
381 (57.1) |
51 (27.7) |
||
Tumor size |
≤ 4 cm |
396 (59.4) |
99 (53.8) |
0.175 |
> 4 cm |
271 (40.6) |
85 (46.3) |
||
pre-operative CEA§ |
Positive |
380 (57.0) |
102 (55.4) |
0.710 |
Negative |
287 (43.0) |
82 (44.6) |
||
pre-operative CA19-9 |
≤ 30 cm |
527 (79.0) |
145 (78.8) |
0.952 |
> 30 cm |
140 (21.0) |
39 (21.2) |
||
Smoker |
Yes |
151 (22.6) |
37 (20.1) |
0.485 |
No |
516 (77.4) |
146 (79.3) |
||
Dignosis of diabetes |
Yes |
37 (5.5) |
4 (2.2) |
0.060 |
No |
630 (94.5) |
179 (97.3) |
||
Dignosis of hypertension |
Yes |
95 (14.2) |
24 (13) |
0.678 |
No |
572 (85.8) |
160 (87) |
||
Radiotherapy |
Yes |
115 (17.2) |
||
No |
552 (82.8) |
|||
Chmotherapy used |
5-Fu+LV/capecitabine |
87 (13.0) |
||
FOLFOX/CapeOx |
573 (85.9) |
|||
Others* |
7 (1.0) |
|||
BMI = Body Mass Index, CEA = carcinoembryonic antigen, CA19-9 = Carbohydrate antigen 19-9. §The reference value of CEA: nonsmoker ≤ 2.5 ng/ml, smoker ≤ 5ng/ml. *Other regimens including fluoropyrimidine-agents.
Lipid fluctuations and the predictive value
To measure the association between lipid fluctuations and chemotherapy, the paired t-test was applied to compare the difference in the lipid levels before and after chemotherapy in cohort 1, as well as within 1 month after resection and at the 6-month follow-up in cohort 2. Patients in cohort 1 exhibited the significantly increased cholesterol (P < 0.001), triglyceride (P < 0.001), HDL-C (P < 0.001), and ApoA-I levels (P < 0.001) and decreased LDL-C (P < 0.001) and apolipoprotein B (ApoB) levels (P = 0.004) after adjuvant chemotherapy. No significant lipid alterations were observed in patients without adjuvant chemotherapy in cohort 2 (Table 2). In addtion, to investigate the potential effect of the age, tumor stage, grade, gender, body mass index (BMI) and different regimens on chemotherapy-related lipid fluctuations, a stratified analysis was also performed in cohort 1. Even though the chemotherapy-related lipid alterations were inconsistent between various subgroups, HDL-C remained to increase after chemotherapy in every subgroup significantly (Stable 1).
Table 2: The alterations of lipids in cohort 1 and cohort 2.
Cohort 1 (N = 667) |
Cohort 2 (N = 184) |
|||||||
Pre-CT |
Post-CT |
Differenceƪ |
P valueф |
Level at diagnoses |
Level at follow-up |
Difference& |
P valueф |
|
Cholesterol (mmol/L) |
4.91±0.97 |
5.09±1.00 |
0.18±1.03 |
< 0.001 |
4.64±0.99 |
5.11±4.48 |
0.46±4.56 |
0.169 |
Triglyceride (mmol/L) |
1.41±0.88 |
1.70±1.01 |
0.29±1.08 |
< 0.001 |
1.52±1.16 |
1.52±1.05 |
0.00±1.35 |
0.986 |
HDL-C (mmol/L) |
1.15±0.30 |
1.37±0.37 |
0.22±0.36 |
< 0.001 |
1.13±0.32 |
1.11±0.43 |
-0.03±0.43 |
0.373 |
LDL-C (mmol/L) |
3.11±0.86 |
2.96±0.90 |
-0.15±0.91 |
< 0.001 |
2.93±0.83 |
2.87±0.90 |
-0.06±0.98 |
0.380 |
ApoA-I (g/L) |
1.18±0.37 |
1.36±0.28 |
0.18±0.43 |
< 0.001 |
1.13±0.24 |
1.12±0.30 |
-0.01±0.33 |
0.785 |
ApoB (g/L) |
0.98±0.50 |
0.92±0.26 |
-0.06±0.49 |
0.004 |
1.04±1.05 |
0.96±0.77 |
-0.07±1.28 |
0.430 |
HDL-C = high-density lipoprotein cholesterol, LDL-C = low-density lipoprotein cholesterol, ApoA-I = apolipoprotein A-I, ApoB = apolipoprotein B, CT = chemotherapy. Data are mean ± standard deviations. ƪDifference = lipidspost-CT - lipidspre-CT. &Difference = lipidsfollow-up. -lipidsat diagnoses фCompared with paired t-test.
According to the comparison before and after chemotherapy in cohort 1, we further identified 379 (56.8%) patients with elevated cholesterol, 431 (64.6%) patients with elevated triglycerides, 512 (76.8%) patients with elevated HDL-C, 498 (74.7%) patients with elevated ApoA-I, 371 (55.6%) patients with decreased LDL-C, and 369 (55.3%) patients with decreased ApoB. We further investigated the prognostic value of various chemotherapy-related lipid fluctuations. The median follow-up was 5.5 years (IQR: 3.7-7.6 years). As shown in Table 3, chemotherapy-related HDL-C elevation and ApoA-I elevation exhibited significant associations with disease-free survival (DFS) and overall survival (OS). Patients with HDL-C elevation during chemotherapy exhibited better 3-year DFS (84.5% vs. 73%, P = 0.001, Figure 1A) and 7-year OS (82% vs. 70%, P = 0.002, Figure 1B) than those without HDL-C elevation. Similarly, the 3-year DFS and 7-year OS were superior in chemotherapy-related ApoA-I elevation patients (3-year DFS: 83.3% vs. 77.6%, P = 0.008, Figure 1C; 7-year OS: 81% vs. 74.6%, P = 0.040, Figure 1D; respectively).
Table 3: Chemotherapy-related lipids alteration for PFS and OS (cohort 1: N = 667).
Lipid fluctuations |
N (%) |
3-year DFS (%) |
P value |
7-year OS (%) |
P value |
|
Cholesterol elevation* |
Yes |
379 (56.8) |
81.9 |
0.680 |
79.6 |
0.910 |
No |
288 (43.2) |
81.9 |
79.0 |
|||
Triglyceride elevation* |
Yes |
431 (64.6) |
81.1 |
0.398 |
79.5 |
0.824 |
No |
236 (35.4) |
83.4 |
79.2 |
|||
HDL-C elevation* |
Yes |
512 (76.8) |
84.5 |
0.001 |
82.0 |
0.002 |
No |
155 (23.2) |
73.0 |
70.0 |
|||
LDL-C reduction* |
Yes |
371 (55.6) |
80.8 |
0.203 |
79.0 |
0.665 |
No |
296 (44.4) |
83.3 |
79.8 |
|||
ApoA-I elevation* |
Yes |
498 (74.7) |
83.3 |
0.008 |
81.0 |
0.040 |
No |
169 (25.3) |
77.6 |
74.6 |
|||
ApoB reduction* |
Yes |
369 (55.3) |
82.0 |
0.938 |
78.3 |
0.669 |
No |
298 (44.7) |
81.8 |
80.2 |
*Comparision between before and after chemotherapy.
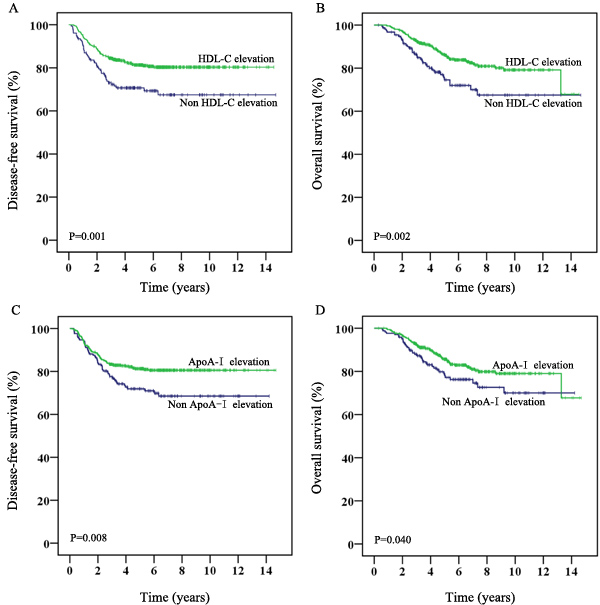
Figure 1: Survival of CRC patients receiving adjuvant chemotherapy stratified by chemotherapy-related HDL-C or ApoA-I alteration (cohort 1: N = 667). A. and B. Kaplan-Meier plots of disease-free survival and overall survival based on chemotherapy-related HDL-C alteration, respectively. C. and D. Kaplan-Meier curves of disease-free survival and overall survival based on chemotherapy-related ApoA-I alteration, respectively.
Univariate and multivariate Cox analysis for DFS and OS
Furthermore, the prognostic value of HDL-C elevation after adjuvant chemotherapy was observed in univariate Cox regression analysis both for superior DFS (hazard ratio[HR]: 0.56; 95% confidence interval[CI]: 0.39-0.80, P = 0.001) and OS( HR[95%CI]: 0.54[0.37-0.80], P = 0.002 ) and was maintained in the multivariate Cox model (HR [95%CI] for DFS: 0.59[0.41-0.84], P = 0.004; HR[95%CI] for OS: 0.56[0.38-0.83], P = 0.004; Table 4 ). However, the positive predictive ability of ApoA-I elevation was only observed in univariate Cox analysis for DFS and OS but not in multivariate analysis (Table 4). Location of the primary tumor (colon cancer vs. rectal cancer) was also a superior independent indicator for DFS and OS. Other inferior independent indicators included advanced T-stage, N-stage and higher level preoperative CA19-9 for DFS, as well as older age, male sex, advanced N-stage, and higher level preoperative CA19-9 for OS (Table 4).
Table 4: Predictive factors for survival by univariate and multivariate analysis in cohort 1 (N = 667).
Univariate analysis |
Multivariate analysis |
||||
HR (95%CI) |
P value |
HR (95%CI) |
P value |
||
Disease-free survival |
|||||
Location of tumor |
colon vs. rectal |
0.68 (0.48-0.95) |
0.023 |
0.67 (0.48-0.94) |
0.021 |
T-stage |
pT4 vs. pT1-3 |
1.88 (1.13-3.13) |
0.015 |
1.99 (1.20-3.31) |
0.008 |
N-stage |
pN2 vs. pN0-1 |
2.54 (1.74-3.73) |
< 0.001 |
2.49 (1.69-3.66) |
< 0.001 |
Pre-operative CEA§ |
pos vs. neg |
1.48 (1.05-2.10) |
0.026 |
- |
ns |
Pre-operative CA19-9 |
> 30 vs. ≤ 30 |
1.62 (1.12-2.34) |
0.010 |
1.52 (1.05-2.21) |
0.028 |
HDL-C elevation |
yes vs. no |
0.56 (0.39-0.80) |
0.001 |
0.59 (0.41-0.84) |
0.004 |
ApoA-I elevation |
yes vs. no |
0.63 (0.44-0.89) |
0.008 |
- |
ns |
Overall survival |
|||||
Age |
> 65 vs. ≤ 65 |
1.79 (1.17-2.75) |
0.008 |
1.82 (1.17-2.82) |
0.007 |
Gender |
male vs. female |
1.61 (1.07-2.41) |
0.022 |
1.72 (1.14-2.60) |
0.010 |
Location of primary tumor |
colon vs. rectal |
0.57 (0.39-0.82) |
0.003 |
0.55 (0.37-0.80) |
0.002 |
Tumor grade |
G2-3 vs. G1 |
0.68 (0.46-1.00) |
0.048 |
- |
ns |
N-stage |
pN2 vs. pN0-1 |
2.46 (1.62-3.75) |
< 0.001 |
2.50 (1.64-3.83) |
< 0.001 |
Pre-operative CEA§ |
pos vs. neg |
1.50 (1.03-2.20) |
0.037 |
- |
ns |
Pre-operative CA19-9 |
> 30 vs. ≤ 30 |
1.58 (1.06-2.35) |
0.026 |
1.62 (1.08-2.43) |
0.020 |
HDL-C elevation* |
yes vs. no |
0.54 (0.37-0.80) |
0.002 |
0.56 (0.38-0.83) |
0.004 |
ApoA-I elevation* |
yes vs. no |
0.67 (0.45-0.98) |
0.041 |
- |
ns |
§The reference value of CEA: nonsmoker ≤ 2.5 ng/ml, smoker ≤ 5ng/ml. *Comparision between before and after chemotherapy. ns, not significant.
Internal validation
Internal validation using a re-sampling procedure was performed to investigate the robustness of the multivariate Cox model. The replication rate of HDL-C elevation was 84% and 86% for DFS and OS, with a mean HR of 0.58 and 0.56 for DFS and OS, respectively (Stable 2).
Stratification analysis by different regimens
Patients in cohort 1 were further categorized into two stratification groups according to different chemotherapy regimens to exclude the influence of oxalipaltin. Both in patients treated with 5-Fu+LV/capecitabine and FOLFOX/CapeOx, chemotherapy-related HDL-C elevation remained the superior predictive ability for both 3-year DFS (5-Fu+LV/capecitabine: 95.0% vs. 80.8%, P = 0.030; FOLFOX/CapeOx: 83.1% vs. 71.1%, P = 0.004; Table 5) and 7-year OS (5-Fu+LV/capecitabine: 90.5% vs. 72.7%, P = 0.025; FOLFOX/CAPEOX: 80.7% vs. 69.2%, P = 0.007; Table 5).
Table 5: The predictive value of chemotherapy-related HDL-C elevation in different regimens.
N (%) |
3-year DFS (%) |
P value |
7-year OS (%) |
P value |
||
FOLFOX/CapeOx |
||||||
HDL-C elevation* |
Yes |
446 (77.8) |
83.1 |
0.004 |
80.7 |
0.007 |
No |
127 (22.2) |
71.1 |
69.8 |
|||
5-Fu+LV/capecitabine |
||||||
HDL-C elevation* |
Yes |
60 (69.0) |
95.0 |
0.030 |
90.5 |
0.025 |
No |
27 (31.0) |
80.8 |
72.7 |
*Comparision between before and after chemotherapy.
Lipid-related factors according to chemotherapy-related HDL-C elevation
To investigate the association between chemotherapy-related HDL-C elevation and other lipid-related features, patients who were overweight (BMI ≥ 24 kg/m2, according to Chinese standard criteria) and those with diabetes, hypertension, smoking addiction and other chemotherapy-related lipid fluctuations were analyzed according to their chemotherapy-related HDL-C elevation. As listed in Table 6, chemotherapy-related cholesterol elevation, ApoA-I elevation, LDL-C reduction, and ApoB reduction were associated with chemotherapy-related HDL-C elevation.
Table 6: The association between the HDL-C elevation and other lipids-related factors in cohort 1 (N = 667).
Variables |
HDL-C elevation* |
P value |
||
Yes |
No |
|||
BMI |
< 24 kg/m2 |
332 |
108 |
0.266 |
≥ 24 kg/m2 |
180 |
47 |
||
Smoker |
Yes |
113 |
38 |
0.524 |
No |
399 |
117 |
||
Dignosis of diabetes |
Yes |
30 |
7 |
0.522 |
No |
482 |
148 |
||
Dignosis of hypertension |
Yes |
74 |
21 |
0.778 |
No |
438 |
134 |
||
Cholesterol elevation* |
Yes |
334 |
45 |
< 0.001 |
No |
178 |
110 |
||
Triglyceride elevation* |
Yes |
328 |
103 |
0.586 |
No |
184 |
52 |
||
LDL-C reduction* |
Yes |
262 |
109 |
< 0.001 |
No |
250 |
46 |
||
ApoA-I elevation* |
Yes |
438 |
60 |
< 0.001 |
No |
74 |
95 |
||
ApoB reduction* |
Yes |
265 |
104 |
0.001 |
No |
247 |
51 |
||
*Comparision between before and after chemotherapy.
Discussion
In this current study, we observed significant changes in various lipids after adjuvant chemotherapy in CRC, including significant increases in cholesterol, triglyceride, HDL-C, and ApoA-I levels and decreases in LDL-C and ApoB levels. Furthermore, HDL-C elevation was found to be an independent prognostic indicator for both superior DFS and OS. To our knowledge, the present study is a much larger one in comparison with those previously reported on chemotherapy-related lipid fluctuations in CRC, and the first one to investigate its potential prognostic role.
Studies focused on chemotherapy-induced lipid alterations are limited and have reported inconsistent results. For instance, Alexopoulos first reported a significant chemotherapy-induced increase in cholesterol and LDL-C in 39 patients with cancer, including lymphoma, small cell lung carcinoma and urothelial cell carcinomas. However, only triglycerides were observed to significantly increase in 18 breast cancer patients [8]. Results from another 12 breast cancer patients demonstrated a significant reduction in HDL-C and ApoA-I and an elevation in ApoB after the treatment of either doxorubicin and cyclophosphamide followed by paclitaxel or epirubicin, cyclophosphamide and 5-Fu followed by docetaxel [10]. Bassani reported an increase in serum triglycerides and an obvious reduction in HDL-C due to high dose bexarotene therapy in a case with cutaneous T-cell lymphoma [11]. In another study conducted by Melichar and his colleagues, 31 patients with metastatic CRC were observed to experience a reduction in cholesterol and LDL-C as well as an increase in HDL-C after treatment with bevacizumab, oxaliplatin, 5-fluorouracil and leucovorin [9]. Nevertheless, all of these observations were based on a small number of patients. In our current study, we measured the lipid fluctuations after adjuvant chemotherapy in 667 stage II-III CRC patients. The significant increases in cholesterol, triglyceride, HDL-C and ApoA-I levels with concurrent decreases in LDL-C and ApoB were observed after the fluoropyrimidine-based chemotherapy. To exclude the impact of other confounding factors, the lipid fluctuations of contemporary cohort 2 patients who did not undergo adjuvant chemotherapy were analyzed as controls. There were no significant lipid alterations in these cohort 2 patients, underlining the association between lipid alterations and chemotherapy administration.
To date, the underlying mechanism of chemotherapy-related lipid alterations remains unclear. Alexopoulos attributed the phenomena to a reversion of cancer-related aberrant lipid profiles after effective chemotherapy treatment [8]. However, the CRC patients enrolled in our study all underwent primary tumor radical resection. Therefore, we suggest the effect of chemotherapy drugs on lipid metabolism. Consistently, a previous study reported that animal models with no tumor burden treated with fluorouracil exhibited significant reductions in total cholesterol and triglyceride after drug administration, which supported the interference of 5- fluorouracil with lipid metabolism [12]. It had been demonstrated that chemotherapy agents like doxorubicin can decrease ATP binding cassette transporter A1 (ABCA1), a receptor of ApoA-I, via a downregulation of the peroxisomal proliferator activated receptor γ (PPARγ) and liver X receptor α (LXRα) transcription factors in liver cells directly, but no effect on ABCA1 was observed by cyclophosphamide or paclitaxel [10]. Therefore, the different trends of chemotherapy-related lipid alterations among the different reports is probably due to the complicated mechanisms that varied by different cancer types, animal species and drugs.
In our study, both HDL-C and ApoA-I exhibited a strong prognostic role in the univariate analysis. As the only athero-protective lipid, HDL-C is known for of its ability to transport excess cholesterol from the periphery to the liver for excretion. Moreover, HDL-C has been demonstrated to exhibit antioxidant, anti-inflammatory, anti-thrombotic within the last decade and exhibits an inverse association with cancers [13-16]. HDL-C was demonstrated to reduce the risk of cancer by 36% for every 10 mg/dl increase and is positively correlated with the prognosis of numerous cancers [13-16]. ApoA-I, the predominant protein component of HDL that is responsible for the assembly and function of HDL, was also found to consistently exhibit a protective effect in non-small cell lung cancer and nasopharyngeal carcinoma [17-19].The result of the multivariate model in our study revealed that only HDL-C elevation remained an independent predictive variable, which is consistent with the close association between HDL-C and ApoA-I.
The mechanism underlying the association between chemotherapy-related elevated HDL-C/ApoA-I and superior survival remains speculative. The HDL-C/ApoA-I elevation may play a role in the inhibition of tumor metastasis. Patients with metastasis often exhibit with lower HDL-C than those without metastasis [20]. Consistently, recent preclinical studies indicated the potential inhibitory effect of HDL-C on the tumor-permissive microenvironment instead of a direct effect on tumor cells [21-23]. By suppressing myeloid-derived suppressor cell (MDSC) recruitment and MMP9, a matrix-degrading enzyme critical for pro-angiogenesis, HDL-C/ApoA-I may inhibit tumor angiogenesis, invasion and metastasis [23]. HDL-C/ApoA-I may also increase the conversion of tumor-associated macrophages (TAMs) from an M2-like pro-tumor phenotype to an M1-like anti-tumor phenotype [23, 24]. In addition, increasing ApoA-I or ApoA-I /HDL mimetics may effectively protect against tumor development and growth in mice model studies [23, 25, 26], and both the innate and adaptive immune responses are required for full anti-tumor activity [21, 23]. However, further investigations into the complicated mechanism underlying the anti-tumor function of HDL-C/ApoA-I elevation are required.
Although the larger cohort of the present study and the internal validation enhanced the confidence of our results, the study is nonetheless limited by its retrospective nature and restriction within one institution.
In conclusion, we observed significant changes in the levels of various lipids in patients with CRC receiving adjuvant chemotherapy after curative-intent resection, including significant increases in cholesterol, triglyceride, HDL-C, ApoA-I levels and decreases in LDL-C and ApoB levels. Furthermore, HDL-C elevation after adjuvant chemotherapy was found to be an independent prognostic indicator for both superior DFS and OS.
MATERIALS AND METHODS
Patients
CRC patients receiving curative-intent resection treatment at the Sun Yat-sen University Cancer Center, China, between 2002 and 2012 were retrospectively reviewed in this study. The inclusion criteria were as follows: (a) pathologically confirmed colorectal cancer; (b) underwent the curative-intent resection; (c) postoperative pathologically identified negative margins; (d) no evidence of distant metastasis at the initial diagnosis; and (e) adequate clinicopathological and lipid information for analysis. Patients who had received fluoropyrimidine-based adjuvant chemotherapy more than 3 months (more than 4 cycles for 3 weekly dosing schedules, or 6 cycles for two weekly schedules) were enrolled in cohort 1. Other contemporary eligible patients who received surgery alone were enrolled in cohort 2 as controls.
Information collection
The clinicopathological information was reviewed from patient charts. Information at diagnoses including, age, sex, height, weight, tumor location, histological subtype, tumor grade, pre-operative CEA and CA19-9, alcohol consumption, smoking history and comorbidities were collected both for cohort 1 and cohort 2. TNM stage was reclassified according to the Union International Control Cancer (UICC) staging system (the 7th version). BMI was calculated by the following formula: weight (in kilograms)/height (in meters2). For cohort 1, levels of lipids and lipoproteins (including cholesterol, triglycerides, HDL-C, LDL-C, ApoA-I, and ApoB) prior to the initial adjuvant chemotherapy were collected and recorded as lipid pre-chemotherapy (CT); levels measured at 2-3 weeks after the administration of last chemotherapy were recorded as lipid post-CT. For cohort 2, lipid and lipoprotein information was collected within 1 month after radical resection and half-year follow-up. The detection of lipids and lipoproteins was performed with early morning samples on an empty stomach and measured immediately by a Hitachi 7600-020 automatic biochemical analyzer (Hitachi High-Technologies, Tokyo, Japan) but were reviewed retrospectively.
Treatment and follow-up
Whether the patients in this study received adjuvant chemotherapy after radical resection was based on pathological staging and clinical characteristics, as decided by the physicians in Sun Yat-sen University Cancer Center. Patients with stage III or high-risk stage II were recommended with fluoropyrimidine-based adjuvant chemotherapy except for those with serious comorbidities or poor anticipated life expectancy assessed by physicians. High-risk was defined as any of the following: pre-operative obstruction, perforation, T4 lesion, lymphovascular invasion, perineural invasion, close, indeterminate or positive margins, poorly differentiated histology or number of lymph nodes analyzed after surgery < 12. The fluoropyrimidine-based regimens included CapeOx (oxaliplatin and capecitabine, repeated every 3 weeks), FOLFOX (oxaliplatin, FU and LV, repeated every 2 weeks), capecitabine single agents (repeated every 3 weeks), 5-FU/LV (repeated every 2 weeks) and other regimens, including fluoropyrimidine. The addition of oxaliplatin was decided according to patients’ tumor stage, age, risk factors and testing for mismatch repair proteins. Pre- or post-operative concurrent chemoradiotherapy for rectal cancer was permitted. Follow-up was performed every 3 months for the first 3 years and then every 6 months for 5 years in cohort 1 and cohort 2 patients. The date of relapse and death were confirmed by the hospital records or phone contact with the patient or their relatives. This study was approved by the institutional ethical review board of Sun Yat-sen University Cancer Center and was conducted in accordance with the Helsinki Declaration of the World Medical Association. Given the non-interventional retrospective design, informed consent was not required in this study.
Statistical analysis
The pertinent patient characteristics and lipid changes were presented as descriptive statistics. Differences between lipid pre-CT and lipid post-CT were investigated using paired student t-test for each patient in cohort 1. Paired student t-test was also used to compare lipid levels in cohort 2. The predictive value of significantly changed serum lipids were analyzed for DFS and OS using the Kaplan-Meier method with log-rank test. DFS was defined as the date of treatment to the date of the first relapse at any site or death from any cause without relapse. OS was calculated from treatment to death from any cause. Χ2 tests were performed to evaluate the associations between variables of interest. The univariate analyzes were performed using Cox regression analysis (including age, sex, location of primary tumor, tumor grade, T-stage, N-stage, tumor size, pre-operative CEA, pre-operative CA19-9, BMI and all types of chemotherapy-related lipid alteration). Then, the variables that exhibited statistical significance (P < 0.05) in univariate analyses were tested in the multivariate analysis with forward stepwise Cox regression model. A stratified analysis was also performed to test whether the prognostic value of chemotherapy-related HDL-C elevation was associated with the oxaliplatin combined regimens. All of the statistical analyses were performed using SPSS software (version 22) with two-tailed tested. A P value of < 0.05 was considered statistically significance.
Internal validation
A cross-validation re-sampling procedure was conducted to evaluate the robustness of the multivariate model and to validate the results [27, 28]. Briefly, one hundred less-powered simulation datasets were generated by randomly selecting 80% of the original dataset. For each simulation, the Cox multivariate models of DFS and OS were performed. The replication rate and the mean HR of each variable were also calculated to validation the consistency of the results.
ACKNOWLEDGMENTS
We thank all the patients for the participation in this study.
CONFLICTS OF INTEREST
The authors declared no conflicts of interest.
GRANT SUPPORT
The work was supported by Science and Technology Planning Project of Guangdong Province, China (NO. 201508020247), National Natural Science Foundation of China (NO. 81372887).
REFERENCES
1. Dai Z, Zheng RS, Zou XN, Zhang SW, Zeng HM, Li N and Chen WQ. [Analysis and prediction of colorectal cancer incidence trend in China]. [Article in Chinese]. Zhonghua Yu Fang Yi Xue Za Zhi. 2012; 46:598-603.
2. Chen W, Zheng R, Baade PD, Zhang S, Zeng H, Bray F, Jemal A, Yu XQ and He J. Cancer statistics in China, 2015. CA Cancer J Clin. 2016.
3. Winawer S, Fletcher R, Rex D, Bond J, Burt R, Ferrucci J, Ganiats T, Levin T, Woolf S, Johnson D, Kirk L, Litin S and Simmang C. Colorectal cancer screening and surveillance: clinical guidelines and rationale-Update based on new evidence. Gastroenterology. 2003; 124:544-560.
4. Iinuma H, Watanabe T, Mimori K, Adachi M, Hayashi N, Tamura J, Matsuda K, Fukushima R, Okinaga K, Sasako M and Mori M. Clinical significance of circulating tumor cells, including cancer stem-like cells, in peripheral blood for recurrence and prognosis in patients with Dukes’ stage B and C colorectal cancer. J Clin Oncol. 2011; 29:1547-1555.
5. Muntoni S, Atzori L, Mereu R, Satta G, Macis MD, Congia M, Tedde A, Desogus A and Muntoni S. Serum lipoproteins and cancer. Nutr Metab Cardiovasc Dis. 2009; 19:218-225.
6. Munir R, Usman H, Hasnain S, Smans K, Kalbacher H and Zaidi N. Atypical plasma lipid profile in cancer patients: cause or consequence? Biochinie. 2014; 102:9-18.
7. Vilchez JA, Martinez-Ruiz A, Sancho-Rodriguez N, Martinez-Hernandez P and Noguera-Velasco JA. The real role of prediagnostic high-density lipoprotein cholesterol and the cancer risk: a concise review. Eur J Clin Invest. 2014; 44:103-114.
8. Alexopoulos CG, Pournaras S, Vaslamatzis M, Avgerinos A and Raptis S. Changes in serum lipids and lipoproteins in cancer patients during chemotherapy. Cancer Chemother Pharmacol. 1992; 30:412-416.
9. Melichar B, Kalabova H, Krcmova L, Kasparova M, Malirova E, Melicharova K, Pecka M, Hyspler R and Solichova D. Serum homocysteine, cholesterol, retinol, alpha-tocopherol, glycosylated hemoglobin and inflammatory response during therapy with bevacizumab, oxaliplatin, 5-fluorouracil and leucovorin. Anticancer Res. 2009; 29:4813-4820.
10. Sharma M, Tuaine J, McLaren B, Waters DL, Black K, Jones LM and McCormick SP. Chemotherapy Agents Alter Plasma Lipids in Breast Cancer Patients and Show Differential Effects on Lipid Metabolism Genes in Liver Cells. PLoS One. 2016; 11:e148049.
11. Basani S and Garg A. Marked lowering of high-density lipoprotein cholesterol levels due to high dose bexarotene therapy. J Clin Lipidol. 2015; 9:832-836.
12. Stathopoulos GP, Stergiou GS, Perrea-Kostarelis DN, Dontas IA, Karamanos BG and Karayiannacos PE. Influence of 5-fluorouracil on serum lipids. Acta Oncol. 1995; 34:253-256.
13. Chi PD, Liu W, Chen H, Zhang JP, Lin Y, Zheng X, Liu W and Dai S. High-density lipoprotein cholesterol is a favorable prognostic factor and negatively correlated with C-reactive protein level in non-small cell lung carcinoma. PLoS One. 2014; 9:e91080.
14. Tamura T, Inagawa S, Hisakura K, Enomoto T and Ohkohchi N. Evaluation of serum high-density lipoprotein cholesterol levels as a prognostic factor in gastric cancer patients. J Gastroenterol Hepatol. 2012; 27:1635-1640.
15. Kotani K, Sekine Y, Ishikawa S, Ikpot IZ, Suzuki K and Remaley AT. High-density lipoprotein and prostate cancer: an overview. J Epidemiol. 2013; 23:313-319.
16. Jafri H, Alsheikh-Ali AA and Karas RH. Baseline and on-treatment high-density lipoprotein cholesterol and the risk of cancer in randomized controlled trials of lipid-altering therapy. J Am Coll Cardiol. 2010; 55:2846-2854.
17. Luo XL, Zhong GZ, Hu LY, Chen J, Liang Y, Chen QY, Liu Q, Rao HL, Chen KL and Cai QQ. Serum apolipoprotein A-I is a novel prognostic indicator for non-metastatic nasopharyngeal carcinoma. Onoctarget. 2015; 6:44037-48. doi: 10.18632/oncotarget.5823.
18. Jiang R, Yang ZH, Luo DH, Guo L, Sun R, Chen QY, Huang PY, Qiu F, Zou X, Cao KJ, Mai HQ, Guo X, Qian CN, Hong MH and Chen MY. Elevated apolipoprotein A-I levels are associated with favorable prognosis in metastatic nasopharyngeal carcinoma. Med Oncol. 2014; 31:80.
19. Cheng T, Dai X, Zhou DL, Lv Y and Miao LY. Correlation of apolipoprotein A-I kinetics with survival and response to first-line platinum-based chemotherapy in advanced non-small cell lung cancer. Med Oncol. 2015; 32:407.
20. Fiorenza AM, Branchi A and Sommariva D. Serum lipoprotein profile in patients with cancer. A comparison with non-cancer subjects. Int J Clin Lab Res. 2000; 30:141-145.
21. Zamanian-Daryoush M and DiDonato JA. Apolipoprotein A-I and Cancer. Front Pharmacol. 2015; 6:265.
22. Tan JT, Ng MK and Bursill CA. The role of high-density lipoproteins in the regulation of angiogenesis. Cardiovasc Res. 2015; 106:184-193.
23. Zamanian-Daryoush M, Lindner D, Tallant TC, Wang Z, Buffa J, Klipfell E, Parker Y, Hatala D, Parsons-Wingerter P, Rayman P, Yusufishaq MS, Fisher EA, Smith JD, Finke J, DiDonato JA and Hazen SL. The cardioprotective protein apolipoprotein A1 promotes potent anti-tumorigenic effects. J Biol Chem. 2013; 288:21237-21252.
24. Sag D, Cekic C, Wu R, Linden J and Hedrick CC. The cholesterol transporter ABCG1 links cholesterol homeostasis and tumour immunity. Nat Commun. 2015; 6:6354.
25. Su F, Grijalva V, Navab K, Ganapathy E, Meriwether D, Imaizumi S, Navab M, Fogelman AM, Reddy ST and Farias-Eisner R. HDL mimetics inhibit tumor development in both induced and spontaneous mouse models of colon cancer. Mol Cancer Ther. 2012; 11:1311-1319.
26. Gao F, Chattopadhyay A, Navab M, Grijalva V, Su F, Fogelman AM, Reddy ST and Farias-Eisner R. Apolipoprotein A-I mimetic peptides inhibit expression and activity of hypoxia-inducible factor-1alpha in human ovarian cancer cell lines and a mouse ovarian cancer model. J Pharmacol Exp Ther. 2012; 342:255-262.
27. Bria E, Milella M, Sperduti I, Alessandrini G, Visca P, Corzani F, Giannarelli D, Cerasoli V, Cuppone F, Cecere FL, Marchetti A, Sacco R, Mucilli F, et al. A novel clinical prognostic score incorporating the number of resected lymph-nodes to predict recurrence and survival in non-small-cell lung cancer. Lung Cancer. 2009; 66:365-371.
28. Vici P, Di Benedetto A, Ercolani C, Pizzuti L, Di Lauro L, Sergi D, Sperati F, Terrenato I, Dattilo R, Botti C, Fabi A, Ramieri MT, Mentuccia L, et al. Predictive significance of DNA damage and repair biomarkers in triple-negative breast cancer patients treated with neoadjuvant chemotherapy: An exploratory analysis. Oncotarget. 2015; 6:42773-80. doi: 10.18632/oncotarget.6001..