
INTRODUCTION
Esophageal cancer is the 6th leading cause of death from cancer and the 8th most common cancer in the world [1]. Epidemiological researches have demonstrated that both environmental factors (eg. alcohol consumption) and genetic factors (genetic variants) contribute to the risk of EC development [2]. Meanwhile, genome-wide association study (GWAS) offers the opportunity to investigate genetic factors involved in this complex disorder and several single nucleotide polymorphisms (SNPs) have been identified to be significantly associated with risk of EC [3]. However, results from current GWAS of EC mainly focus on individual SNPs with highly statistical significance (P-value < 5.0E-08), investigation of genetic basis from the perspective of systematic biology and integrative genomics remains scarce.
Due to the polygenic risk of complex disorders, the effect size attributable to individual genetic variants was typically modest, suggesting that individual genetic variants identified by GWAS may only accounted for a very small amount of the genetic risk and heritability of complex disorders [4]. The combined effect of multi genetic variants or genes with modest effect also plays important roles in genetic basis of complex disorders such as esophageal cancer [5]. GWAS provides us an important data source for the investigation of multi-variant/gene effect. Moreover, combining GWAS data with bioinformatics methods such as expression quantitative trait loci (eQTL) analysis, pathway based analysis, and network analysis, the integrative genomics approach could provide systematic evidence to genetic basis of disease [6].
In this study, we explored genetic basis of EC by comprehensive data mining and systematical data analysis based on GWAS data and a series of bioinformatics methods, which may provide better understanding for the molecular mechanisms that contribute to the development of EC.
RESULTS
Identification of SNPs associated with risk of esophageal cancer
By comprehensive data search and collection, we obtained a total of 7 published GWAS of esophageal cancer [21]-[27], in which the sample size ranged from four thousands to twenty thousands and the ethnic groups of samples were mainly Asian descent except one study with European descent, detecting 500 thousands to one million of SNPs from the whole genome in each GWAS. A total of 211 SNPs reported with P-value <5.0E-05 were obtained and considered as risk SNPs of esophageal cancer. Summary of GWAS including disease, ethnic groups, sample size, genotyping platform, and number of detected SNPs was shown in Table 1 and details of reported SNPs, their P-values and odds ratios were shown in Supplementary Table S1. As shown in Supplementary Table S5, results of power analysis demonstrated for two-stage designed GWAS, in the initial analysis, studies with initial sample size larger than 3000 had more than 90% power of detecting risk SNPs. While initial sample size of study [27] was 1109, the power of detecting risk SNPs with allele frequency of 0.1 and 0.9 was less than 70%. When combining initial sample and replicated sample, all studies achieved more than 90% power at any allele frequency level.
Table 1: Summary of esophageal cancer GWAS
Study |
Disease |
Ethnic groups |
Initial sample size (case/control) |
Replicated Sample size (case/control) |
Genotyping platform |
No. of detected SNPs |
No. of reported SNPs with P < 5.0E-05 |
|---|---|---|---|---|---|---|---|
Levine DM [21] |
EAC |
European |
1,516/3,209 |
874/6,911 |
Illumina |
922,031 |
13 |
Jin G [22] |
Multiple cancers (including ESCC)* |
Asian (Chinese) |
2,031/4,006 |
3,006/11,436 |
Affymetrix |
NA |
1 |
Wu C [23] |
ESCC |
Asian (Chinese) |
2,031/2,044 |
8,092/8,620 |
Affymetrix |
666,141 |
151 |
Wu C [24] |
ESCC |
Asian (Chinese) |
2,031/2,044 |
3,986/4,157 |
Affymetrix |
666,141 |
11 |
Abnet CC [25] |
ESCC and gastric cancer* |
Asian (Chinese) |
1,898/2,100 |
NA |
Illumina |
551,152 |
7 |
Wang LD [26] |
ESCC |
Asian (Chinese) |
1,077/1,733 |
7,673/11,013(Han Chinese), 303/537(Uygur-Kazakh Chinese) |
Illumina |
506,666 |
18 |
Cui R [27] |
ESCC |
Asian (Japanese) |
182/927 |
782/1,898 |
Illumina |
359,195 |
12 |
EAC: esophageal adenocarcinoma; ESCC: esophageal squamous cell carcinoma; NA: not applicable.
*Only SNPs associated with ESCC were included in this study.
Functional annotation and expression quantitative trait loci (eQTL) analysis
As shown in Supplementary Table S2, for 211 risk SNPs, related chromosome, genome position, allele change, and mapped gene/region were annotated. These 211 risk SNPs were mapped into 170 genes, which were considered as genes associated with risk of esophageal cancer. By eQTL analysis, among 211 risk SNPs, we observed 44 SNPs with significant gene expression changes in several esophageal tissues, including esophagus muscularis (sample size: 241), esophagus mucosa (sample size: 218), esophagus gastroesophageal junction (sample size: 235), with permutation adjusted P–values < 0.05. Detailed results including SNPs, esophageal tissues, gene with altered expressions and P-values were displayed in Supplementary Table S3.
Pathway enrichment analysis
By pathway enrichment analysis, with the threshold of Benjamini-adjusted P-value < 0.05, we obtained 38 significant GO terms and 17 significant KEGG pathways, which were considered as significant pathways of esophageal cancer. Meanwhile, fold enrichment of risk genes in each significant pathway were all larger than 1.5, demonstrating risk genes were significantly enriched in these pathways. The details of significant pathways including pathway ID, P-values, involved genes, and fold enrichment were shown in Table 2.
Table 2: Significant pathways of esophageal cancer
Pathway ID |
Pathway title |
Adjusted P-value* |
Associated Risk Genes Found |
% Associated Risk Genes |
Fold enrichment |
|---|---|---|---|---|---|
GO:0002377 |
immunoglobulin production |
6.79E-03 |
FOXP1, IL6, XBP1, XRCC4 |
4.44 |
7.83 |
GO:0002700 |
regulation of production of molecular mediator of immune response |
7.54E-03 |
FOXP1, IL6, TGFB2, XBP1 |
4.26 |
7.50 |
GO:0004022 |
alcohol dehydrogenase (NAD) activity |
1.50E-10 |
ADH1A, ADH1B, ADH1C, ADH4, ADH6, ADH7 |
75.00 |
132.18 |
GO:0004030 |
aldehyde dehydrogenase (NAD(P)+) activity |
1.08E-04 |
ADH4, ADH7, ALDH2 |
37.50 |
66.09 |
GO:0005178 |
integrin binding |
3.50E-03 |
ADAMTS5, FN1, ITGA6, PPAP2B, PTPN2 |
4.35 |
7.66 |
GO:0005501 |
retinoid binding |
6.21E-03 |
ADH4, ADH7, UGT2B7 |
6.82 |
12.02 |
GO:0006069 |
ethanol oxidation |
2.66E-11 |
ADH1A, ADH1B, ADH1C, ADH4, ADH6, ADH7, ALDH2 |
63.64 |
112.15 |
GO:0006493 |
protein O-linked glycosylation |
8.74E-03 |
ADAMTS5, GALNT13, MUC4, ST6GAL1 |
4.00 |
7.05 |
GO:0006656 |
phosphatidylcholine biosynthetic process |
3.32E-03 |
CHEK2, FABP5, SLC44A5 |
9.38 |
16.52 |
GO:0006805 |
xenobiotic metabolic process |
3.34E-04 |
ADH1A, ADH1B, ADH1C, ADH4, ADH6, ADH7, ALDH2, SULT1A1 |
4.40 |
7.75 |
GO:0007431 |
salivary gland development |
1.22E-03 |
FGFR2, IL6, TGFB2, XBP1 |
8.70 |
15.32 |
GO:0010883 |
regulation of lipid storage |
5.73E-03 |
IL6, PTPN2, SREBF2 |
7.14 |
12.59 |
GO:0030134 |
ER to Golgi transport vesicle |
2.11E-04 |
HLA-A, HLA-DPA1, HLA-G, KIAA0368, SREBF2 |
9.62 |
16.95 |
GO:0030176 |
integral component of endoplasmic reticulum membrane |
2.05E-04 |
CLN3, HLA-A, HLA-DPA1, HLA-G, SREBF2, TBL2, XBP1 |
5.65 |
9.95 |
GO:0030818 |
negative regulation of cAMP biosynthetic process |
4.25E-03 |
EDNRA, GNAI2, GRM3 |
8.33 |
14.69 |
GO:0031016 |
pancreas development |
7.75E-03 |
GATA6, GNAI2, IL6, XBP1 |
4.17 |
7.34 |
GO:0031069 |
hair follicle morphogenesis |
3.32E-03 |
FGFR2, RUNX1, TGFB2 |
9.38 |
16.52 |
GO:0032729 |
positive regulation of interferon-gamma production |
2.19E-03 |
HLA-A, HLA-DPA1, IL18R1, PDE4D |
7.02 |
12.37 |
GO:0033002 |
muscle cell proliferation |
3.53E-04 |
EDNRA, FGFR2, FOXP1, GATA6, IL6, PDE4D, TGFB2 |
5.07 |
8.94 |
GO:0034774 |
secretory granule lumen |
3.71E-03 |
FN1, GNAI2, IL6, TGFB2 |
5.63 |
9.93 |
GO:0042093 |
T-helper cell differentiation |
5.42E-03 |
FOXP1, IL18R1, IL6 |
7.50 |
13.22 |
GO:0042307 |
positive regulation of protein import into nucleus |
2.01E-03 |
IL18R1, IL6, KANK1, XBP1, ZIC1 |
5.32 |
9.37 |
GO:0042439 |
ethanolamine-containing compound metabolic process |
7.43E-03 |
CHEK2, CLN3, FABP5, SLC44A5 |
4.30 |
7.58 |
GO:0042987 |
amyloid precursor protein catabolic process |
1.42E-03 |
CLN3, FKBP1A, HAP1 |
14.29 |
25.18 |
GO:0043368 |
positive T cell selection |
2.16E-03 |
DOCK2, IL6, PTPN2 |
11.54 |
20.33 |
GO:0046164 |
alcohol catabolic process |
1.17E-02 |
ADH4, ADH7, ALDH2 |
5.08 |
8.96 |
GO:0046631 |
alpha-beta T cell activation |
3.06E-03 |
DOCK2, FOXP1, HLA-A, IL18R1, IL6 |
4.59 |
8.08 |
GO:0048634 |
regulation of muscle organ development |
2.68E-03 |
BDNF, FGFR2, FOXP1, GATA6, IL6 |
4.81 |
8.47 |
GO:0048659 |
smooth muscle cell proliferation |
1.91E-03 |
EDNRA, FGFR2, FOXP1, IL6, PDE4D |
5.43 |
9.58 |
GO:0050839 |
cell adhesion molecule binding |
7.84E-05 |
ADAMTS5, FN1, ITGA6, NRXN1, POSTN, PPAP2B, PTPN2, PTPRM, TRPC4 |
4.84 |
8.53 |
GO:0051965 |
positive regulation of synapse assembly |
2.16E-03 |
BDNF, CBLN1, NRXN1 |
11.54 |
20.33 |
GO:0055025 |
positive regulation of cardiac muscle tissue development |
2.77E-03 |
FGFR2, FOXP1, GATA6 |
10.34 |
18.23 |
GO:0060038 |
cardiac muscle cell proliferation |
9.07E-04 |
FGFR2, FOXP1, GATA6, TGFB2 |
9.52 |
16.78 |
GO:0060337 |
type I interferon signaling pathway |
5.32E-03 |
HLA-A, HLA-G, PTPN2, USP18 |
4.94 |
8.70 |
GO:0071354 |
cellular response to interleukin-6 |
2.09E-03 |
IL6, PHB, PTPN2 |
12.00 |
21.15 |
GO:0071556 |
integral component of lumenal side of endoplasmic reticulum membrane |
2.77E-03 |
HLA-A, HLA-DPA1, HLA-G |
10.34 |
18.23 |
GO:1901019 |
regulation of calcium ion transmembrane transporter activity |
1.42E-02 |
FKBP1A, HAP1, PDE4D |
4.69 |
8.26 |
GO:1902106 |
negative regulation of leukocyte differentiation |
5.32E-03 |
HLA-G, PTPN2, RUNX1, THOC5 |
4.94 |
8.70 |
KEGG:00010 |
Glycolysis / Gluconeogenesis |
6.91E-06 |
ADH1A, ADH1B, ADH1C, ADH4, ADH6, ADH7, ALDH2 |
10.45 |
18.41 |
KEGG:00071 |
Fatty acid degradation |
8.27E-07 |
ADH1A, ADH1B, ADH1C, ADH4, ADH6, ADH7, ALDH2 |
15.91 |
28.04 |
KEGG:00350 |
Tyrosine metabolism |
2.92E-06 |
ADH1A, ADH1B, ADH1C, ADH4, ADH6, ADH7 |
17.14 |
30.21 |
KEGG:00561 |
Glycerolipid metabolism |
1.17E-02 |
ALDH2, DGKH, PPAP2B |
5.08 |
8.96 |
KEGG:00830 |
Retinol metabolism |
6.54E-06 |
ADH1A, ADH1B, ADH1C, ADH4, ADH6, ADH7, UGT2B7 |
10.77 |
18.98 |
KEGG:00980 |
Metabolism of xenobiotics by cytochrome P450 |
9.68E-06 |
ADH1A, ADH1B, ADH1C, ADH4, ADH6, ADH7, UGT2B7 |
9.59 |
16.90 |
KEGG:00982 |
Drug metabolism |
7.40E-06 |
ADH1A, ADH1B, ADH1C, ADH4, ADH6, ADH7, UGT2B7 |
10.14 |
17.88 |
KEGG:04514 |
Cell adhesion molecules (CAMs) |
8.57E-05 |
ALCAM, HLA-A, HLA-DPA1, HLA-G, ITGA6, NRXN1, PTPRM, VCAN |
5.63 |
9.93 |
KEGG:04940 |
Type I diabetes mellitus |
5.97E-03 |
HLA-A, HLA-DPA1, HLA-G |
6.98 |
12.30 |
KEGG:05030 |
Cocaine addiction |
7.63E-03 |
BDNF, GNAI2, GRM3 |
6.12 |
10.79 |
KEGG:05204 |
Chemical carcinogenesis |
3.40E-06 |
ADH1A, ADH1B, ADH1C, ADH4, ADH6, ADH7, SULT1A1, UGT2B7 |
9.76 |
17.19 |
KEGG:05320 |
Autoimmune thyroid disease |
8.87E-03 |
HLA-A, HLA-DPA1, HLA-G |
5.66 |
9.98 |
KEGG:05321 |
Inflammatory bowel disease (IBD) |
2.96E-03 |
HLA-DPA1, IL18R1, IL6, TGFB2 |
6.15 |
10.85 |
KEGG:05330 |
Allograft rejection |
4.82E-03 |
HLA-A, HLA-DPA1, HLA-G |
7.89 |
13.91 |
KEGG:05332 |
Graft-versus-host disease |
8.75E-04 |
HLA-A, HLA-DPA1, HLA-G, IL6 |
9.76 |
17.19 |
KEGG:05410 |
Hypertrophic cardiomyopathy (HCM) |
5.64E-03 |
CACNG6, IL6, ITGA6, TGFB2 |
4.82 |
8.49 |
KEGG:05416 |
Viral myocarditis |
1.17E-02 |
HLA-A, HLA-DPA1, HLA-G |
5.08 |
8.96 |
*P-value was adjusted by Benjamini-Hochberg methods.
Pathway grouped network analysis
As shown in Supplementary Table S4, a pathway grouped network was constructed with significant interacted pathways involved and 55 pathways of EC were significantly grouped into 9 sub-networks with Group P-value < 0.05. As shown in Figure 1, Group 1 included smooth muscle cell proliferation related pathways; Group 2 included phosphatidylcholine biosynthetic process related pathways; Group 3 were cellular response to interleukin-6 involved pathways; Group 4 were muscle cell proliferation related pathways; Group 5 and Group 6 was related with cell adhesion molecule binding and Cell adhesion molecules (CAMs) respectively; Group 7 was amyloid precursor protein catabolic process; Group 8 was related with ethanol oxidation and Group 9 was negative regulation of cAMP biosynthetic process. Besides, 3 significant pathways including protein O-linked glycosylation, positive regulation of synapse assembly, glycerolipid metabolism were independent and not grouped into any cluster.
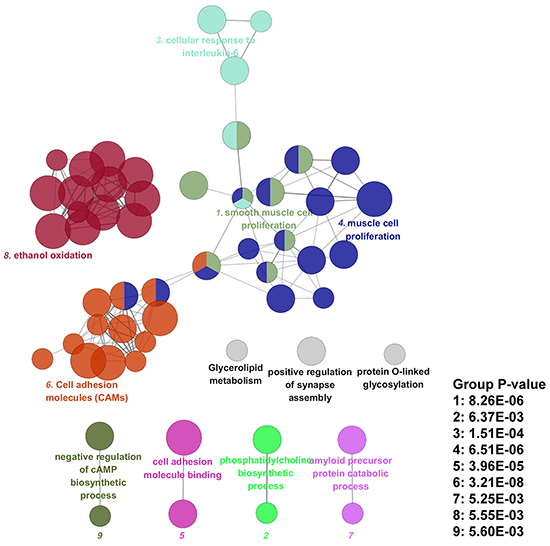
Figure 1: Pathway grouped network of esophageal cancer.
DISCUSSION
In this study, we employed an integrative genomics approach to investigate genetic risk factors and biological functions of EC. By systematic data analysis, evidence from large-scale GWAS, eQTL, pathway and network were obtained. As shown in Supplementary Figure S1, nine risk SNPs on alcohol dehydrogenase genes (eg. ADH4, ADH1C) were identified to have significantly differential gene expression levels under different genotypes on esophageal tissues including esophagus muscularis and esophagus mucosa, as alcohol drinking has been considered as an important risk factor of EC [2], and previous animal studies also demonstrated impairment of aldehyde dehydrogenase could increase accumulation of acetaldehyde-derived DNA damage in the esophagus after ethanol ingestion [7]. Our eQTL results indicated compared with non-risk alleles/genotypes, risk alleles/genotypes of these GWAS identified SNPs had differential gene expression levels, thus altered expression of risk genes might contribute to the molecular mechanisms of EC and were worthy of further investigation.
By functional annotation with genome information, 211 risk SNPs were mapped into 170 genes, which were enriched into 38 significant GO terms and 17 significant KEGG pathways by pathway enrichment analysis. Then these EC related pathways were significantly grouped into 9 sub-networks according to shared risk genes among pathways. Two pathway groups related to muscle cell proliferation were identified, with genes such as FGFR2 and FOXP1 involved. In accordance with our results, have shown FGFR2 are able to promote tumor development and progression in esophageal carcinoma [8] and FOXP1, as a member of Forkhead-box (FOX) family genes, was reported to be associated with poor prognosis of multi-cancer [9]. In addition, the alcohol related pathway group including alcohol dehydrogenase (NAD) activity, aldehyde dehydrogenase (NAD(P)+) activity, ethanol oxidation, alcohol catabolic process was identified, which provided genetic evidence and biological explanation for the risk of alcohol drinking on development of EC [2]. Meanwhile, some interleukin-6 (IL-6) mediated immunity pathways were also grouped, such as cellular response to IL-6, T-helper cell differentiation and positive T cell selection, which also demonstrated an important involvement of IL-6 on the development of EC [10]. Moreover, the identification of cell adhesion molecules (CAMs) related pathway groups were supported by previous studies reporting altered expression of CAMs during prognosis and tumor behavior in EC [11].
Results from pathway grouped network analysis demonstrated some pathways were shared among different groups, such as immune related pathways including T-helper cell differentiation, alpha-beta T cell activation and positive regulation of interferon-gamma production; as well as muscle development related pathways such as regulation of muscle organ development and smooth muscle cell proliferation, indicating EC related genes and pathways did not function independently, but functioned in the form of interacting with each other. Therefore, results from our study revealed the multi-gene effect on genetic basis of EC, supporting the view indicating that combined effect of multi genetic variants or genes with modest effect were also involved in genetic basis of complex disorders such as EC [5].
In conclusion, in this study, we explored genetic basis of EC by comprehensive data mining and systematical data analysis based on GWAS data, evidence from SNP, gene, gene expressions, pathway and network were identified, which might provide new insight for exploring the molecular mechanisms of EC.
MATERIALS AND METHODS
Identification of SNPs associated with risk of esophageal cancer
In order to identify SNPs associated with risk of esophageal cancer, GWAS of esophageal cancer were collected from GWAS catalog (https://www.genome.gov/gwastudies/), which collected all currently published GWAS of various traits. Besides, we also searched public database of Pubmed to collect recently published GWAS of esophageal cancer. Information of GWAS studies including sample size, genotyping platform, ethnic groups, reported SNPs and their P-values were collected. Due to the polygenic risk of complex disorders, individual genetic variants may only accounted for a very small amount of the genetic risk and heritability of complex disorders such as esophageal cancer [4], in order to more comprehensively capture SNPs with small effect size, we used genetic association P-value of 5.0E−05 as a criterion for identifying SNPs that are associated with risk of esophageal cancer. To detect the power of each GWAS in identifying risk SNPs, we performed power analysis by QUNTO (http://biostats.usc.edu/Quanto.html) [12]. To comprehensively investigate the power of GWAS, three levels of risk allele frequency was assumed, which were 0.1, 0.5 and 0.9 respectively. The odds ratio was assumed as 1.20, demonstrating a “weak to moderate” gene effect, and two-tailed α  was set as 0.05.
Functional annotation and expression quantitative trait loci (eQTL) analysis
To identify genes of SNPs and candidate regulatory SNPs at disease-associated loci, we annotated genome information to SNPs including related chromosome, genome position, allele changes, mapped genes by using data from 1000 Genomes Project [13] and ENCODE (Encyclopedia of DNA Elements) projects [14]. Genes mapped by risk SNPs were considered as risk genes of esophageal cancer.
Meanwhile, some GWAS identified SNPs had regulatory functions by causing differential gene expressions with different genotypes and understanding the functional consequence of genetic variants was essential for biological interpretation on genetic etiology of disease [15]. Expression quantitative trait locus (eQTL) analysis was the most common approach used to dissect the effects of genetic variation on gene expression. As esophageal cancer occurred in esophageal tissues, the expression effect of risk SNPs in these tissues was worthy of being investigated. To detect the potential impact of risk SNPs on gene expression in esophageal tissues, we performed eQTL analysis by investigating the tissue specific expression distributions of SNPs in diverse human tissues using the Genotype Tissue Expression portal (GTEx) [16], a database that contained RNA sequencing data from 1641 samples across 43 tissues from 175 individuals. For each tissue, significance correlations between genotypes and gene expression levels were determined by linear regression on quantile normalized gene-level expression values, with permutation-adjusted P–value < 0.05 as significance. As referred in [16], The eQTL was calculated for SNPs within ±1 Mb of the transcriptional start site (TSS) of each gene. If more than one target gene was identified for one SNP by eQTL analysis, gene with the most significant P-value was chosen.
Pathway enrichment analysis
To investigate whether risk genes of esophageal cancer identified from GWAS were enriched in functional pathways, we performed pathway enrichment analysis. Information from Kyoto encyclopedia of genes and genomes (KEGG) database [17] and Gene ontology (GO) terms [18] was used to annotate related pathways. The pathway enrichment test was based on hypergeometric test, the P-value was corrected by Benjamini-Hochberg methods and the significance was set as 0.05. To measure the magnitude of risk gene enrichment, we calculated the fold enrichment of involved risk genes in each pathway. The fold enrichment was obtained by calculating proportion of involved risk genes versus proportion of involved genes in human genome with a total of 29960 genes in each pathway according to the method applied in [19], with a suggested threshold of fold enrichment as 1.5 and above.
Pathway grouped network analysis
To investigate whether identified pathways were biologically interconnected, we constructed a pathway grouped network of risk genes of esophageal cancer by using a Cytoscape plug-in called “ClueGO” [20]. The relationship between pathways was defined based on their shared genes and calculated by chance corrected kappa statistics. Then the created network represented the pathways as nodes which were linked based on a predefined kappa score level. In our pathway grouped network analysis, we set the kappa score level as “0.4” as ClueGo referenced. The group P-value was determined by hypergeometric test, the P-value was corrected by Benjamini-Hochberg methods and the significance was set as 0.05. The final network was visualized by Cytoscape software (Version 3.1.1).
ACKNOWLEDGMENTS
We thank all authors from GWAS of esophageal cancer for providing their GWAS results.
CONFLICTS OF INTEREST
The authors report no biomedical financial interests or potential conflict of interest.
FINANCIAL SUPPORT
The research was supported by the National Natural Science Foundation of China (Grant No. 31540034) and the Open Project Program of Key Laboratory of Mental Health, Institute of Psychology, Chinese Academy of Sciences (Grant No. KLMH2014G03).
REFERENCES
1. Pennathur A, Gibson MK, Jobe BA and Luketich JD. Oesophageal carcinoma. Lancet. 2013; 381:400-412.
2. Wheeler JB and Reed CE. Epidemiology of esophageal cancer. The Surgical clinics of North America. 2012; 92:1077-1087.
3. Domper Arnal MJ, Ferrandez Arenas A and Lanas Arbeloa A. Esophageal cancer: Risk factors, screening and endoscopic treatment in Western and Eastern countries. World journal of gastroenterology. 2015; 21:7933-7943.
4. Manolio TA and Collins FS. Genes, environment, health, and disease: facing up to complexity. Human heredity. 2007; 63:63-66.
5. Wang K, Li M and Bucan M. Pathway-based approaches for analysis of genomewide association studies. American journal of human genetics. 2007; 81:1278-1283.
6. Zhao Z, Jin VX, Huang Y, Guda C and Ruan J. Frontiers in Integrative Genomics and Translational Bioinformatics. BioMed research international. 2015; 2015:725491.
7. Yukawa Y, Ohashi S, Amanuma Y, Nakai Y, Tsurumaki M, Kikuchi O, Miyamoto S, Oyama T, Kawamoto T, Chiba T, Matsuda T and Muto M. Impairment of aldehyde dehydrogenase 2 increases accumulation of acetaldehyde-derived DNA damage in the esophagus after ethanol ingestion. American journal of cancer research. 2014; 4:279-284.
8. Zhang C, Fu L, Fu J, Hu L, Yang H, Rong TH, Li Y, Liu H, Fu SB, Zeng YX and Guan XY. Fibroblast growth factor receptor 2-positive fibroblasts provide a suitable microenvironment for tumor development and progression in esophageal carcinoma. Clinical cancer research. 2009; 15:4017-4027.
9. Katoh M, Igarashi M, Fukuda H and Nakagama H. Cancer genetics and genomics of human FOX family genes. Cancer letters. 2013; 328:198-206.
10. Chen MF, Kuan FC, Yen TC, Lu MS, Lin PY, Chung YH, Chen WC and Lee KD. IL-6-stimulated CD11b+ CD14+ HLA-DR- myeloid-derived suppressor cells, are associated with progression and poor prognosis in squamous cell carcinoma of the esophagus. Oncotarget. 2014; 5:8716-8728. doi: 10.18632/oncotarget.2368.
11. Nair KS, Naidoo R and Chetty R. Expression of cell adhesion molecules in oesophageal carcinoma and its prognostic value. Journal of clinical pathology. 2005; 58:343-351.
12. Gauderman WJ. Sample size requirements for matched case-control studies of gene-environment interaction. Statistics in medicine. 2002; 21:35-50.
13. Auton A, Brooks LD, Durbin RM, Garrison EP, Kang HM, Korbel JO, Marchini JL, McCarthy S, McVean GA and Abecasis GR. A global reference for human genetic variation. Nature. 2015; 526:68-74.
14. The ENCODE (ENCyclopedia Of DNA Elements) Project. Science. 2004; 306:636-640.
15. Ward LD and Kellis M. Interpreting noncoding genetic variation in complex traits and human disease. Nature biotechnology. 2012; 30:1095-1106.
16. Human genomics. The Genotype-Tissue Expression (GTEx) pilot analysis: multitissue gene regulation in humans. Science. 2015; 348:648-660.
17. Ogata H, Goto S, Sato K, Fujibuchi W, Bono H and Kanehisa M. KEGG: Kyoto Encyclopedia of Genes and Genomes. Nucleic acids research. 1999; 27:29-34.
18. Gene Ontology Consortium: going forward. Nucleic acids research. 2015; 43:D1049-1056.
19. Huang da W, Sherman BT and Lempicki RA. Systematic and integrative analysis of large gene lists using DAVID bioinformatics resources. Nature protocols. 2009; 4:44-57.
20. Bindea G, Mlecnik B, Hackl H, Charoentong P, Tosolini M, Kirilovsky A, Fridman WH, Pages F, Trajanoski Z and Galon J. ClueGO: a Cytoscape plug-in to decipher functionally grouped gene ontology and pathway annotation networks. Bioinformatics. 2009; 25:1091-1093.
21. Levine DM, Ek WE, Zhang R, Liu X, Onstad L, Sather C, Lao-Sirieix P, Gammon MD, Corley DA, Shaheen NJ, Bird NC, Hardie LJ, Murray LJ, Reid BJ, Chow WH, Risch HA, et al. A genome-wide association study identifies new susceptibility loci for esophageal adenocarcinoma and Barrett’s esophagus. Nature genetics. 2013; 45:1487-1493.
22. Jin G, Ma H, Wu C, Dai J, Zhang R, Shi Y, Lu J, Miao X, Wang M, Zhou Y, Chen J, Li H, Pan S, Chu M, Lu F, Yu D, et al. Genetic variants at 6p21.1 and 7p15.3 are associated with risk of multiple cancers in Han Chinese. American journal of human genetics. 2012; 91:928-934.
23. Wu C, Kraft P, Zhai K, Chang J, Wang Z, Li Y, Hu Z, He Z, Jia W, Abnet CC, Liang L, Hu N, Miao X, Zhou Y, Liu Z, Zhan Q, et al. Genome-wide association analyses of esophageal squamous cell carcinoma in Chinese identify multiple susceptibility loci and gene-environment interactions. Nature genetics. 2012; 44:1090-1097.
24. Wu C, Hu Z, He Z, Jia W, Wang F, Zhou Y, Liu Z, Zhan Q, Liu Y, Yu D, Zhai K, Chang J, Qiao Y, Jin G, Shen Y, Guo C, et al. Genome-wide association study identifies three new susceptibility loci for esophageal squamous-cell carcinoma in Chinese populations. Nature genetics. 2011; 43:679-684.
25. Abnet CC, Freedman ND, Hu N, Wang Z, Yu K, Shu XO, Yuan JM, Zheng W, Dawsey SM, Dong LM, Lee MP, Ding T, Qiao YL, Gao YT, Koh WP, Xiang YB, et al. A shared susceptibility locus in PLCE1 at 10q23 for gastric adenocarcinoma and esophageal squamous cell carcinoma. Nature genetics. 2010; 42:764-767.
26. Wang LD, Zhou FY, Li XM, Sun LD, Song X, Jin Y, Li JM, Kong GQ, Qi H, Cui J, Zhang LQ, Yang JZ, Li JL, Li XC, Ren JL, Liu ZC, et al. Genome-wide association study of esophageal squamous cell carcinoma in Chinese subjects identifies susceptibility loci at PLCE1 and C20orf54. Nature genetics. 2010; 42:759-763.
27. Cui R, Kamatani Y, Takahashi A, Usami M, Hosono N, Kawaguchi T, Tsunoda T, Kamatani N, Kubo M, Nakamura Y and Matsuda K. Functional variants in ADH1B and ALDH2 coupled with alcohol and smoking synergistically enhance esophageal cancer risk. Gastroenterology. 2009; 137:1768-1775.