
INTRODUCTION
Colorectal cancer (CRC) is a common life threatening disease worldwide [1], with 700,000 annual mortalities making it the fourth most deadly cancer in both men and women [2]. In recent years, the 16S rRNA gene sequencing approach has been widely used as an effective tool to globally analyze the microbial community [3, 4], and multiple studies have demonstrated that breakdown of the intestinal microbiota structure can promote carcinogenesis and development of CRC [5–9]. Comparative data about microflora in relation to survival of patients with colorectal cancer are scanty, but may be of clinical significance. Flanagan et al. demonstrated a significant association between Fusobacterium nucleatum level and patient outcome and suggested that F. nucleatum may have value as a prognostic indicator [5]. Boleij et al. found that the detection of Bacteroides fragilis toxin (BFT), which was produced by Enterotoxigenic Bacteroides fragilis (ETBF), increased in the mucosa of later staged CRC [10]. These studies show there is a possibility that some type of microbe will affect the prognosis of patients with CRC. Given that infection has gradually been accepted as a major driver of inflammation, and various inflammatory mediators substantially contribute to metastasis [11, 12]. We hypothesize that inflammation might be the key point between microbiota and prognosis of CRC.
In this study, we examined the microbial structure in CRC clinical tumor samples and assessed the correlation of microbiota with clinicopathologic features and with patient survival. The status of MLH1, BRAF and KRAS expression, as well as inflammation related TNF-α, COX-2, MMP-9, β-catenin and NF-κB of cancer tissues were assessed to calculate their correlation with different microbial phylotypes. This approach may reveal the pathological process of how microbiota could affect the prognosis of CRC patients.
RESULTS
Diversity and structural changes of the tumor microbiota in CRC patients with different prognosis outcome
Libraries of 16S rRNA V4 region amplicon sequences from 180 CRC tumor samples were sequenced. A total of 16,854,578 high-quality and classifiable reads were obtained from this study, with an average of 93,636 reads per sample. At 3% dissimilarity level, a total of 41,628 OTUs in all samples and an average of 231 OTUs per sample were identified.
The value of Good’s coverage for each group was over 99%. We examined the estimators of community richness (observed species and Chao indexes) and diversity and evenness (Shannon and Simpson indexes) among groups (Figure 1A). The only significant difference was detected between the survival group and recurrent group in Chao diversity index (Chao, 257 ± 88 vs. 397 ± 89, P= 0.03), demonstrating the significantly lower diversity found in survival group.
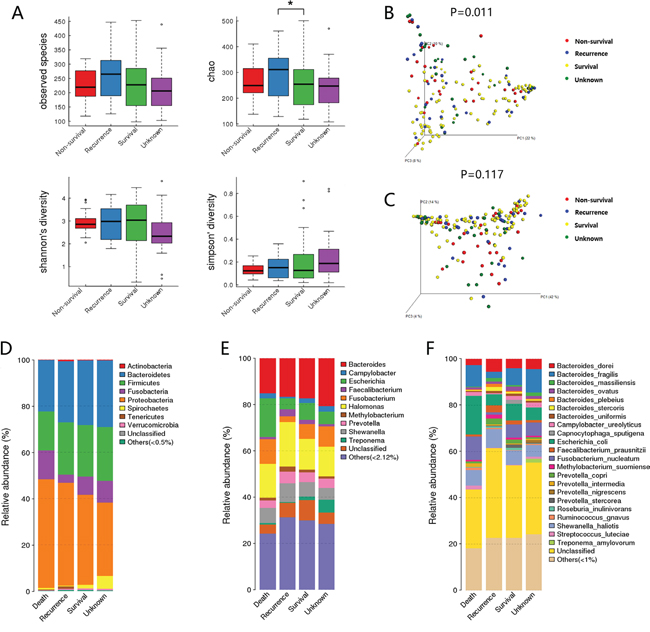
Figure 1: Diversity and structural changes of the tumor microbiota among the Non-survival group (n = 28), Recurrent group (n = 31), Survival group (n = 92) and Unknown group (n = 29). A. Alpha-diversity distances calculated using phylotype relative abundance measurements among groups. *: statistically significant P <0.05. Principal coordinates analysis (PCoA) scores plot of Bray-Curtis distance matrix B. and weighted Unifrac distance matrix C. based on the relative abundance of OTUs (97% similarity level). Each symbol represents a sample. Colors represent different groups. D. The dominant phyla of different groups. E. The dominant genera of different groups. F. The dominant species of different groups.
For beta diversity analysis, the microflora and compositions were analyzed and compared through the relative abundance of OTUs by using Bray-Curtis distance matrix and weighted Unifrac distance matrix for each group. Subsequent results of principal coordinates analysis (PCoA) exhibited the difference in bacterial community composition among groups. The first three principal component scores of Bray-Curtis distance matrix (Figure 1B) and weighted Unifrac distance matrix (Figure 1C) were 22%, 10%, 8% and 42%, 14%, 4%. Significant difference was detected in Bray-Curtis distance (P=0.011), suggesting that the community membership of each group was different.
The overall microbiota structure for each group at the phylum level is shown in Figure 1D. The dominant phyla of all groups were Proteobacteria (33.8%-49.4%), Firmicutes (16.9%-22.7%), Bacteroidetes (21.1%-27.9%), and Fusobacterium (3.38%-10.8%). When comparing the relative abundance of phyla among the groups, we found that the abundance of Proteobacteria was higher in survival group than in non-survival group (48.2% vs. 33.8%, FDR=0.063), while Fusobacterium was lower in survival group (3.38% vs. 9.71%, FDR=0.089), although the differences were not statistically significant.
The microbial composition was different at the genus level among groups. Shewanella (9.05% vs. 5.76%, FDR=0.091), Methylobacterium (2.54% vs. 1.56%, FDR=0.039), Faecalibacterium (2.99% vs. 0.93%, FDR=0.016) and Sphingomonas (1.38% vs. 0.79%, FDR=0.031) which constitute over 1% of the total bacteria in survival group, exhibited a relatively higher abundance than non-survival group. While Fusobacterium (9.23% vs. 2.70%, FDR=0.079) was relatively more abundant in non-survival group compared with survival group and the change was borderline significant. Methylobacterium (2.54% vs. 1.51%, FDR=0.09) and Mycoplasma (0.64% vs. 0%, FDR=0.01) showed higher abundance in survival group than in recurrence group. No other genus showed significant difference (Figure 1E).
In specie level, we found a higher level of B. fragilis (9.75% vs. 2.62%, FDR=0.017) in non-survival group than in survival group, while F. prausnitzii (2.96% vs. 0.92%, FDR=0.028) and Methylobacterium suomiense (1.91% vs. 0.78%, FDR=0.098) were more abundant in the survival group. Moreover, borderline statistic difference was found in F. nucleatum between non-survival group and survival group (5.66% vs. 1.08%, FDR=0.076) and F. nucleatum (5.10% vs. 1.08%, FDR=0.08) exhibited a greater abundance in the recurrence group than in survival group (Figure 1F).
Correlation of microbiota in CRC patients with clinicopathologic features
The significant difference of microbiota between survival group and non-survival group showed that B. fragilis and F. prausnitzii might be correlated with patient’s survival in CRC. Besides, F. nucleatum, a well-studied detrimental bacteria which could promote CRC development and progression, also showed higher abundance in non-survival group. Therefore, we evaluated the relationship between the level of the three bacteria and clinicopathologic characteristics of CRC patients. Based on the relative abundance of each microbiota in tumor sample, patients were divided into high and low bacteria subgroups with the median relative abundance as the cut-off, that was B. fragilis high vs B. fragilis low (Cut-off: 2.04%), F. prausnitzii high vs F. prausnitzii low (Cut-off: 0.55%), and F. nucleatum high vs. F. nucleatum low (Cut-off: 0.52%). As shown in Table 1, high abundance of F. nucleatum was significantly correlated with positive lymph node metastasis (P =0.011). Furthermore, high abundance of F. prausnitzii and F. nucleatum was significantly correlated with worse depth of invasion (P =0.015 and 0.015).
Table 1: Clinicopathological factors and microbiota in CRC patients
Characteristic |
BH |
BL |
P value |
FAH |
FAL |
P value |
FUH |
FUL |
P value |
|---|---|---|---|---|---|---|---|---|---|
Age |
|
|
0.224 |
|
|
0.761 |
|
|
0.128 |
<60 |
32 |
40 |
|
35 |
37 |
|
31 |
41 |
|
>=60 |
58 |
50 |
|
55 |
53 |
|
59 |
49 |
|
Gender |
|
|
0.543 |
|
|
0.761 |
|
|
0.361 |
Male |
56 |
52 |
|
55 |
53 |
|
51 |
57 |
|
Female |
34 |
38 |
|
35 |
37 |
|
39 |
33 |
|
Location |
|
|
0.443 |
|
|
0.646 |
|
|
0.878 |
Colon |
32 |
37 |
|
33 |
36 |
|
35 |
34 |
|
Rectum |
58 |
53 |
|
57 |
54 |
|
55 |
56 |
|
Tumor size |
|
|
0.168 |
|
|
0.443 |
|
|
0.092 |
<5cm |
51 |
60 |
|
53 |
58 |
|
50 |
61 |
|
>=5cm |
39 |
30 |
|
37 |
32 |
|
40 |
29 |
|
CEA |
|
|
0.124 |
|
|
0.356 |
|
|
0.758 |
Normal |
51 |
61 |
|
53 |
59 |
|
55 |
57 |
|
Elevated |
39 |
29 |
|
37 |
31 |
|
35 |
33 |
|
Grade of differentiation |
|
|
0.092 |
|
|
0.736 |
|
|
0.312 |
Well |
61 |
71 |
|
65 |
67 |
|
63 |
69 |
|
Poor |
29 |
19 |
|
25 |
23 |
|
27 |
21 |
|
Depth of invasion |
|
|
0.083 |
|
|
0.015* |
|
|
0.015* |
T1 and T2 |
17 |
27 |
|
15 |
29 |
|
15 |
29 |
|
T3 and T4 |
73 |
63 |
|
75 |
61 |
|
75 |
61 |
|
Lymph node metastasis |
|
|
0.036 |
|
|
0.901 |
|
|
0.011* |
Negative |
43 |
57 |
|
58 |
53 |
|
42 |
59 |
|
Positive |
47 |
33 |
|
42 |
37 |
|
48 |
31 |
|
Remote Metastasis |
|
|
1 |
|
|
0.278 |
|
|
0.718 |
Negative |
86 |
86 |
|
84 |
88 |
|
85 |
87 |
|
Positive |
4 |
4 |
|
6 |
2 |
|
5 |
3 |
|
TNM stage |
|
|
0.052 |
|
|
0.296 |
|
|
0.101 |
I and II |
41 |
54 |
|
44 |
51 |
|
42 |
53 |
|
III and IV |
49 |
36 |
|
46 |
39 |
|
48 |
37 |
|
Bonferroni-correction: α=0.017
*: statistically significant P <0.017
Abbreviation: BH: B. fragilis high, BL: B. fragilis low, FAH: F. prausnitzii high, FAL: F. prausnitzii low, FUH: F. nucleatum high, FUL: F. nucleatum low.
Prognostic value of B. fragilis, F. prausnitzii and F. nucleatum
To assess the clinical significance of the three bacteria in CRC, Kaplan-Meier analysis and the log-rank test were used to analyze the relationship between bacteria relative abundance in cancer tissue and patient’ survival. We found that the 3-year OS was significantly lower in patients with high B. fragilis and F. nucleatum than in those with low abundance of these two microbiota (P= 0.001, P= 0.003). And patients with low abundance of F. prausnitzii showed worse 3-year OS, although the difference was not significant (P= 0.06). Similarly, patients with high B. fragilis and F. nucleatum were significantly associated with poorer disease-free survival (DFS) rates than those with low abundance (P< 0.001, P= 0.001) (Figure 2). The univariate Cox regression analyses revealed that high B. fragilis (HR 2.888; P= 0.01), F. nucleatum (HR 2.533; P= 0.003), TNM stage (HR 2.325; P= 0.006) and carcino embryonie antigen (CEA) level (HR 1.945; P= 0.029) were associated with worse OS after radical surgery in these CRC patients. However, in the multivariate analysis, only B. fragilis (HR 2.010; 95% CI 1.020-3.961; P= 0.044), F. nucleatum (HR 1.993; 95% CI 1.024-3.879; P= 0.042) and TNM stage (HR 1.869; 95% CI 1.002-3.486; P= 0.049) was an independent predictor of the 3-year OS (Table 2). Furthermore, B. fragilis, F. nucleatum and TNM stage were associated with poor 3-year DFS both in univariate Cox regression analyses and multivariate analysis (Table 3).
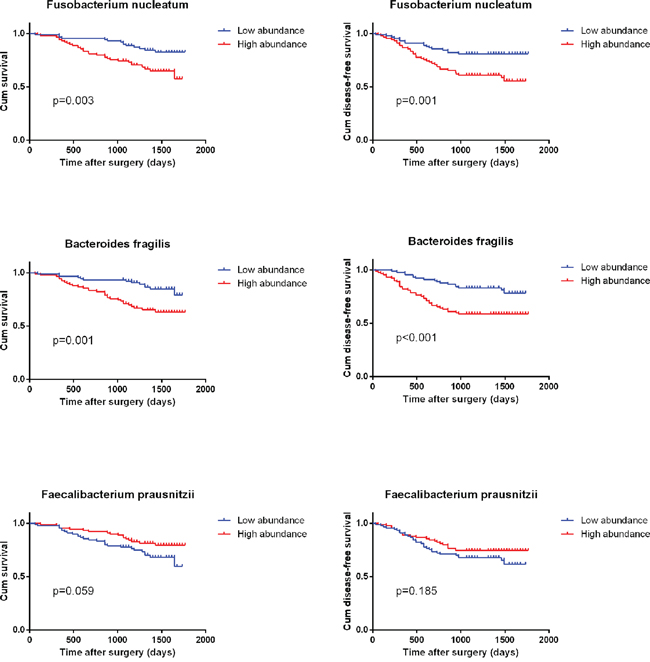
Figure 2: Kaplan–Meier survival curves for overall survival (OS) and disease free survival (DFS) in 180 CRC patients in relation to B. fragilis, F. prausnitzii and F. nucleatum level. P values were obtained by log-rank test.
Table 2: Univariate and multivariable Cox regression analyses for overall survival
Factor |
Univariate analysis |
Multivariate analysis |
||||
|---|---|---|---|---|---|---|
HR |
95%Cl |
P-value |
HR |
95%Cl |
P-value |
|
Overall survival |
|
|
|
|
|
|
Age(<60/>=60) |
1.680 |
(0.879 to 3.213) |
0.106 |
|
|
|
Gender(male/female) |
0.710 |
(0.376 to 1.339) |
0,281 |
|
|
|
Location(colon/rectum) |
0.805 |
(0.431 to 1.503) |
0.492 |
|
|
|
Tumor size (<5cm/>=5cm) |
1.588 |
(0.878 to 2.869) |
0.129 |
|
|
|
CEA(normal/elevated) |
1.945 |
(1.076 to 3.515) |
0.029* |
1.757 |
(0.960 to 3.214) |
0.067 |
Grade of differentiation (well/poor) |
1.356 |
(0.719 to 2.558) |
0.357 |
|
|
|
TNM stage (I-II/III-IV) |
2.325 |
(1.257 to 4.301) |
0.006* |
1.869 |
(1.002 to 3.486) |
0.049* |
B. fragilis (low/high) |
2.888 |
(1.508 to 5.532) |
0.001* |
2.010 |
(1.020 to 3.961) |
0.044* |
F. prausnitzii (low/high) |
0.562 |
(0.306 to 1.033) |
0.059 |
|
|
|
F. nucleatum (low/high) |
2.533 |
(1.341 to 4.783) |
0.003* |
1.993 |
(1.024 to 3.879) |
0.042* |
HR relative risk, 95% CI 95% confidence interval.
*: statistically significant P<0.05, Cox proportional hazard regression model.
Table 3: Univariate and multivariable Cox regression analyses for disease free survival
Factor |
Univariate analysis |
Multivariate analysis |
||||
|---|---|---|---|---|---|---|
HR |
95%Cl |
P-value |
HR |
95%Cl |
P-value |
|
Disease-free survival |
|
|
|
|
|
|
Age(<60/>=60) |
1.421 |
(0.807 to 2.502) |
0.216 |
|
|
|
Gender(male/female) |
0.736 |
(0.418 to 1.296) |
0,281 |
|
|
|
Location(colon/rectum) |
0.880 |
(0.503 to 1.538) |
0.651 |
|
|
|
Tumor size(<5cm/>=5cm) |
1.290 |
(0.752 to 2.213) |
0.359 |
|
|
|
CEA(normal/elevated) |
1.495 |
(0.873 to 2.558) |
0.147 |
|
|
|
Grade of differentiation (well/poor) |
1.678 |
(0.960 to 2.934) |
0.078 |
|
|
|
TNM stage (I-II/III-IV) |
2.081 |
(1.203 to 3.599) |
0.008* |
1.823 |
(1.052 to 3.160) |
0.032* |
B. fragilis (low/high) |
2.673 |
(1.504 to 4.751) |
0.001* |
2.042 |
(1.116 to 3.738) |
0.021* |
F. prausnitzii (low/high) |
0.696 |
(0.406 to 1.194) |
0.185 |
|
|
|
F. nucleatum (low/high) |
2.478 |
(1.395 to 4.404) |
0.001* |
1.829 |
(1.000 to 3.345) |
0.050* |
HR relative risk, 95% CI 95% confidence interval.
*: statistically significant P<0.05, Cox proportional hazard regression model.
Expression of inflammation related molecules in CRC tissues with different bacteria abundance
Quantitative RT-PCR was used to determine the expression of TNF, COX2, MMP9 and CTNNB (catenin beta) in tumor samples. As shown in Figure 3A, TNF was overexpressed in CRC tissues of the F. nuleatum high abundance group (P=0.0024) and F. prausnitzii low abundance group (P=0.0117) compared to their opposite groups. Higher expression of COX2 was found in B. fragilis high abundance group (P=0.0245) than in the low abundance one. And the expressions of MMP9 and CTNNB were positively correlated with high abundance of F. nuleatum (P=0.0005 and P=0.0189) and B. fragilis (P=0.0432 and P=0.0300), but negatively correlated with high abundance of F. prausnitzii (P=0.0147 and P=0.0197). Consistently, western blotting analysis further confirmed the results obtained from qRT-PCR (Figure 3B). Moreover, the expression of NF-κB, which was detected by western blot, increased in F. nuleatum high abundance and B. fragilis high abundance groups, while decreased in F. prausnitzii high abundance group.
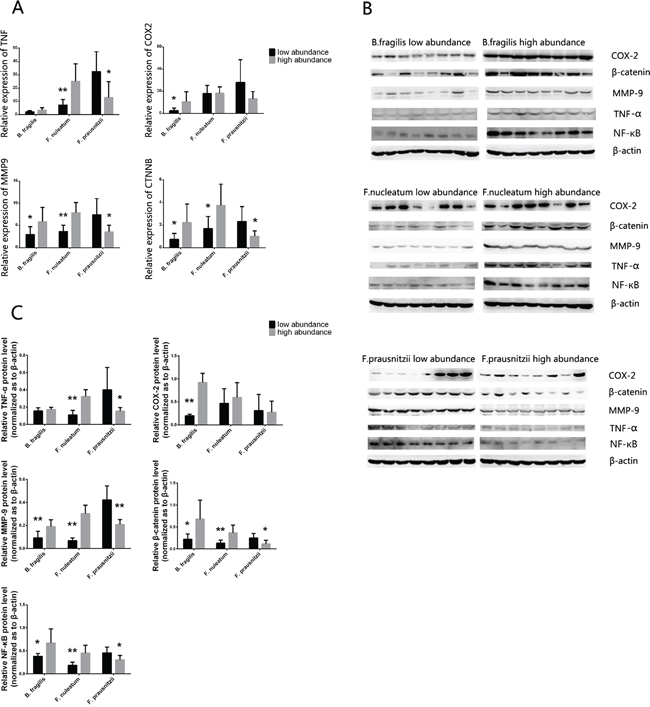
Figure 3: A. The mRNA expression level of the TNF, COX2, MMP9 and CTNNB in cancer tissues with different abundance of B. fragilis, F. nucleatum and F.prausnizii were analyzed by RT-PCR, and the protein of TNF-α, COX-2, MMP-9, β-catenin and NF-κB were analyzed by western blot B. (n = 8 samples per group). Quantitation of the signals C. were analyzed based on the result of western blot. B-actin was used as the endogenous control. P values were calculated with Student’s t test. *: statistically significant P<0.05, **: statistically significant P<0.01.
Bacteria levels related to other molecular features of cancer tissue
Immunohistochemistry was used to detect the differential expression of KRAS, BRAF and MLH1 in cancer tissues (Figure 4). By comparing immunohistochemical scores of tumor samples with high or low bacteria abundance, we observed that KRAS was highly expressed in F.nucleatm high abundance group, B. fragilis high abundance group and F. prausnitzii low abundance group. The F. nucleatm high abundance group and B. fragilis high abundance group also exhibited a higher expression of BRAF and lower expression of MLH1 (Table 4).
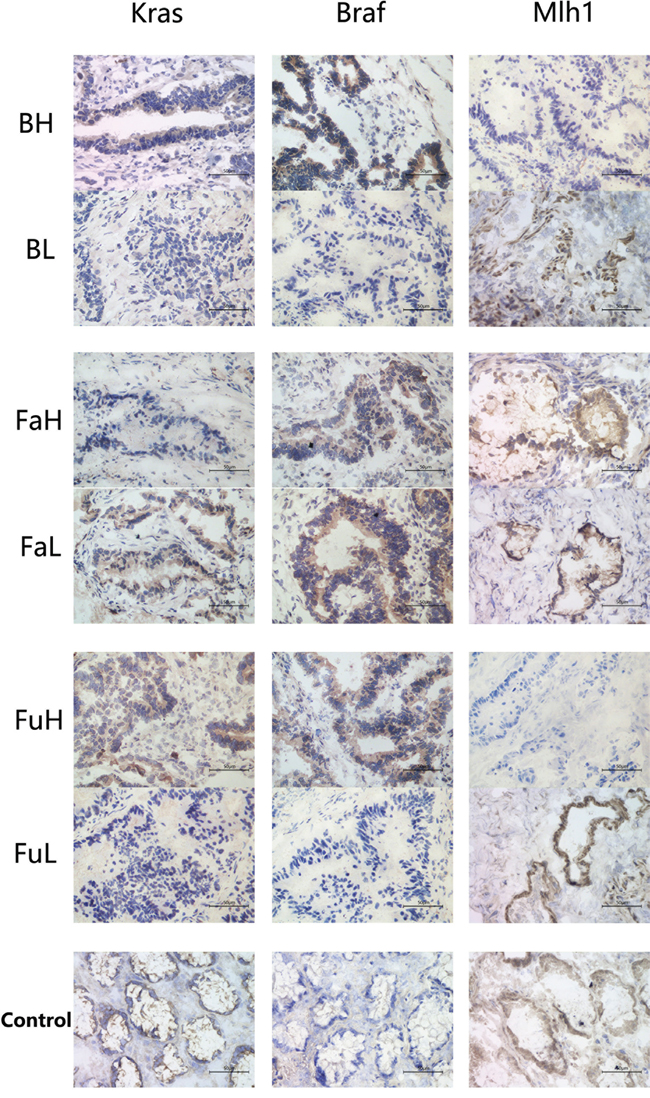
Figure 4: Immunohistochemistry was used to analysis the expression of KRAS, BRAF and MLH1 in cancer tissues with different abundance of B. fragilis, F. nucleatum and F.prausnizii respectively. And adjacent normal tissue samples were used as normal controls. Each group contains 6 samples, and each sample was made into 3 slides for staining. Abbreviation: BH: B. fragilis high, BL: B. fragilis low, FAH: F. prausnitzii high, FAL: F. prausnitzii low, FUH: F. nucleatum high, FUL: F. nucleatum low.
Table 4: Correlations of different bacteria abundance with IRS of KRAS, BRAF and MLH1 expression
Group |
Kras |
Braf |
Mlh1 |
||||||
|---|---|---|---|---|---|---|---|---|---|
Mean |
SD |
P-value |
Mean |
SD |
P-value |
Mean |
SD |
P-value |
|
B. fragilis high abundance |
4.333 |
0.0 |
0.0118* |
6.667 |
0.857 |
0.0108* |
1.667 |
0.615 |
0.0128* |
B. fragilis low abundance |
2.000 |
0.760 |
|
3.000 |
0.803 |
|
5.167 |
0.980 |
|
F. prausnitzii high abundance |
1.500 |
0.422 |
0.0025* |
7.833 |
0.601 |
0.416 |
5.667 |
1.174 |
0.5036 |
F. prausnitzii low abundance |
4.667 |
0.671 |
|
6.833 |
1.014 |
|
4.500 |
1.204 |
|
F. nucleatum high abundance |
3.667 |
0.422 |
0.0015* |
5.500 |
0.806 |
0.0051* |
2.333 |
0.803 |
0.0170* |
F. nucleatum low abundance |
1.333 |
0.333 |
|
1.333 |
0.843 |
|
6.000 |
1.000 |
|
*: statistically significant P<0.05
DISCUSSION
Nowadays, cancer stage is the most important indicator for the prognosis of CRC patients, and multiple strategies were well designed based on different TNM stage. However, new tool to indicate more accurate clinical characteristics and effective therapeutic targets are still needed, so it is meaningful to find new predictor of CRC patients’ prognosis which might lead to novel treatment method to improve patients’ survival. In our study, we are the first to compare the microbial population among groups of cancer tissues divided by different post-operation prognosis status. Differences of F. nucleatum, B. fragilis and F. prausnitzii, found between non-survival and survival group, drew our special attention, because these three bacteria have relative high abundant, all of which counted for more than 1% of microbiota in species, and they are intimately related with colorectal cancer [5-8, 13, 14]. In addition, we found a correlation between high abundance of F. nucleatum and increased lymph nodes metastasis rates, which was consistent with previous study [15]. Tumor’s depth of invasion was shown to be correlated with high F. nucleatum and low F. prausnitzii abundance. Further survival analysis confirmed the prognostic value of F. nucleatum, Fragilis and F. prausnitzii.
Another study has shown that patients with high levels of F. nucleatum had a significantly shorter survival time, which was similarly with our result [5]. But the number of patients enrolled in the cohort of that study was relatively small (32 patients). A more recent study reported a similar result using a larger databases of CRC cases in USA, which observed a correlation between high amount of tissue F. nucleatum DNA and higher CRC-specific mortality [16]. This result was promising, but the positive rate of bacteria DNA was relatively small which made the positive group less representative. ETBF, a major subtype of B. fragilis, was also associated with CRC through producing BFT [17]. A recent study suggested that BFT gene positivity was more prominent in later stage CRC, which showed a possible link between increased B. fragilis and worse prognosis of CRC [10]. In our study, we report, for the first time, that the high abundant of B. fragilis is correlated with poor patient’s clinical outcome. Furthermore, increased F.prausnitzii, a well-known human intestinal probiotic bacteria, was shown to be related with better survival status, a result that has not been reported before.
The specific mechanisms by which gut microbiota affects the development of CRC are still not well understood. One of the most promising theories is that it is thought to be through microbe-driven intestinal inflammation [18]. Interestingly, F. nucleatum, B. fragilis and F. prausnitzii are all key players in modifying intestinal inflammation levels [6, 7, 19]. In a study about colorectal adenomas, the abundance of F. nucleatum was found to positively correlate with inflammatory cytokine genes expression including that of TNF, which was consistent with our result [20]. TNF-α is produced during the inflammatory response and can promote survival, attachment, and proliferation of metastatic colon cancer cells in a mouse model of lung metastasis depending on the activation of NF-κB by inflammation and cancer cells [21]. Moreover, through activation of NF-κB and STAT3, TNF-α can enhance epithelial-mesenchymal transition which are critical steps that allow polarized epithelial tumor cells to become mesenchymal like, enhancing cell migration and invasion [22, 23]. Meanwhile, MMP-9 was also elevated in F. nucleatum high abundant group. MMP-9, known as an independent stimulus for increased cell migration [24], can be activated by inflammatory signals, such as NF-κB [25]. And, as previously mentioned, NF-κB can be activated by TNF-α in certain tumor microenvironment [21]. Furthermore, it has been demonstrated that F. nucleatum can bind to E-cadherin on epithelial cells via FadA and activates β-catenin which is a transcription factor in the Wnt signal transduction pathway [6], Wnt signaling is fundamental in CRC progression [26]. In addition, studies suggest that F. nucleatum can also generate a proinflammatory microenvironment by recruit tumor-infiltrating immune cell [27] and downregulate antitumor T cell-mediated adaptive immunity [28] to promote CRC progression.
B. fragilis, was also related with higher CTNNB expression in our study. BFT can alter epithelia structure and function including cleavage of the tumor suppressor protein, E-cadherin, resulting in enhanced nuclear Wnt/β–catenin signaling that yields increased colonic carcinoma cell proliferation and metastasis [29–31]. PGE2, a major downstream mediator of COX-2, can activates β-catenin-dependent signaling, which promotes survival and proliferation. Besides increased COX-2 can also stimulate tumor angiogenesis by inducing production of VEGF and basic fibroblast growth factor, and it can increase tumor dissemination by altering the adhesive properties of cells and increasing matrix metalloproteinase activity [32, 33]. Available evidence demonstrated that BFT, through activation of NF-κB, could stimulate intestinal epithelial cells to induce the expression of COX-2 and increased release of PGE2 [13]. In the meantime, MMP-9 is also elevated in the B. fragilis high abundance group which might also be explained by activation of NF-κB that was induced by BFT.
Several studies have shown that culture supernatant of F. prausnitzii exerts an anti-inflammatory effect both in vitro and in vivo [34]. A recent experiment demonstrated that a 15 kDa protein produced by F. prausnitzii possessed anti-inflammation properties through inhibition of NF-κB pathway in intestinal epithelial cells in an animal model [35], which is consistent with our finding. Notably, the down regulated NF-κB could decrease the expression of various inflammation related factors including β–catenin and MMP-9 [25, 36], both of which showed lower expression level in F. prausnitzii high group in our experiment and could promote CRC metastasis. Furthermore, TNF was also overexpressed in F. prausnitzii low group, which further supports the idea that F. prausnitzii possess an anti-inflammation effect, although the potential mechanism is not thoroughly understood.
Evidences have shown that overexpression of KRAS and BRAF were markers of poor prognosis [37, 38] which were fortunately consistent with our findings of prognostic values of F. nucleatum, B. fragilis and F.prausnitzii. In addition, MSI, the primary causes of which is hypermethylation of the MLH1 promoter, was also associated with clinical outcomes of CRC [39, 40], and in this study, decreased expression of Mlh-1 had also been detected in F. nucleatum high and B. fragilis high abundant samples. These findings might imply that cancers which are accompanied with high abundance of F. nucleatum and B. fragilis or low abundance of F. prausnitzii are more invasive and inclined to metastasis. Furthermore, serrated adenocarcinoma, a subtype of CRC which is developed though serrated pathway, is characterized by high frequency of KRAS and BRAF mutation and MLH1 deficiency [41, 42]. Evidence showed that this kind of CRC is likely to have less favorable 5-year survival [43]. Therefore, it came a question that whether there’s an association between bacteria F. nucleatum or B. fragilis and serrated adenocarcinoma, which might be worth exploring in future studies.
Moreover, as obvious benefits of anti-epidermal growth factor receptor therapy were shown in patients with KRAS mutations [44, 45] and sensitivity to irinotecan was found in the MLH1 deficiency cell model [46, 47], our finding poses the question as to whether patients that suffered from dysbiosis should receive more aggressive chemotherapy? This might be a promising direction of future microbiotic study.
The study has some limitations. First, our findings based on patients in a single center, and the prognostic value of these bacteria might require a multi-center study with larger data to validate this result. Second, the specific mechanism by which bacteria promote invasion and metastasis of CRC and unknown mutual effect that exist among different bacteria will surly need to be explored by well-designed animal and cell line experiments in the future.
In conclusion, our study is the first report demonstrating the prognosis value of B. fragilis and F.prausnitzii, and further validates the connection of F. nucleatum and cancer-specific mortality. Furthermore, the correlation between bacteria’s relative abundance and inflammatory factors suggests that microbiota might impact patient’s prognosis via inducing gut inflammation. Moreover, given that the tumor samples could be easily collected both in surgery and colonoscopy, our results will be useful in developing novel bacteria-related prognostic indicator for CRC, and encourage further investigation of the role played by microbiota in CRC pathology.
MATERIALS AND METHODS
CRC patients
A total of 180 CRC patients were enrolled in our study. Patients with stages I–III cancer subjected to standard curative surgery, while stage IV CRC tissues were collected from patients who received palliative surgery to relieve serious cancer related contradiction. Surgeries were performed at the general surgery department of Affiliated Hospital of Qingdao University between 2010 and 2012, and all patients who received postoperative treatment were guided by the National Comprehensive Cancer Network Guidelines. Of all the patients, there were 108 males and 72 females with a mean age of 62.2 (age range 30–88 years). The median follow-up period was 47 months with a range from 36 to 59 months. The criteria for study enrollment were histopathological diagnosis of primary CRC, newly diagnosed and untreated, no history of other tumors, and the potential to follow up. Patients who used antibiotics within 2 months before operation, or were regularly using Non-steroidal anti-inflammatory drugs, statins or probiotics were excluded from the study. Other exclusions included chronic bowel disease, other signs of infections, food allergies and dietary restrictions.
Sample preparation
CRC tumor samples and adjacent normal tissue samples (at least 5cm from the tumor site) of these 180 patients were obtained from the gastrointestinal cancer specimen bank of Affiliated Hospital of Qingdao University, Qingdao, China. To be specific, surgically resected specimens were collected immediately after tumor removal and stored at -80°C until use. The TNM staging were determined according to the American Joint Committee on Cancer system and all specimens were graded histologically according to the World Health Organization classification criteria. Written informed consents of joining the specimen bank were obtained from all the patients before surgery, and the protocols used in the study were approved by the Ethics Committee of Affiliated Hospital of Qingdao University. Clinical and pathologic data were reviewed from gastrointestinal cancer database of Affiliated Hospital of Qingdao University, Qingdao, China.
So as to preliminarily detect the species of bacteria with prognostic value, subjects included in the study were subdivided based on their different survival conditions. From those, 92 patients corresponded to the survival group (people who lived more than 3 years without any sign of recurrence or metastasis), 28 to the non-survival group (people who died within 3years after surgery for CRC related causes), 31 to the recurrence group (people who experienced recurrence or metastasis of primary tumor within 3 years but survived), and 29 to the unclear group (people who lived more than 3 years with unclear history of recurrence or metastasis).
DNA extraction
DNA was extracted from all tumor samples using CTAB method with minimal modification. Concentration of DNA was measured by fluorometer or microplate reader, and sample integrity was tested by agarose gel electrophoresis (1% concentration of agarose Gel: 1 %; 150 V; 40 min electrophoresis time). All DNA samples were stored at -20°C until used.
PCR and sequencing analysis
Amplification of the V4 region of the bacterial 16S rRNA gene was performed by polymerase chain reaction (PCR) using universal primers 319F and 806R. The reaction mix consisted of Phusion High-Fidelity PCR Master Mix (NEB, Ipswich, MA, USA) and appropriate primer/probe pairs. The PCR program was as follows: 3 min denaturation at 98°C followed by 30 cycles of 45 s at 95°C (denaturation), 45 s for annealing at 55°C and 45 s at 72°C (extension), with a final extension at 72°C for 7 min. The PCR products were purified with AMPure XP beads (Agencourt Bioscience) to remove the unspecific products prior to library construction. The library was quantitated in two ways: the average molecule length was determined using the Agilent 2100 bioanalyzer instrument (Agilent DNA 1000 Reagents), and then quantified by real-time quantitative PCR (qPCR; EvaGreen TM). Sequencing of qualified libraries was performed by the BGI-Huada Genomices institute in Shenzhen using MiSeq System, with the sequencing strategy PE250 (PE251+8+8+251) or PE300 (PE301+8+8+301) (MiSeq Reagent Kit).
Bioinformatics analysis
The sequences were clustered into operational taxonomic units (OTU) with a 97% threshold by using USEARCH (v7.0.1090) [48], and the OTU unique representative sequences were obtained. Chimeras were filtered out by using UCHIME (v4.2.40). [49] Representative OTUs were aligned to the optimized sequences and the abundance of OTUs per samples was obtained for performing further analysis. Ribosomal Database Project (RDP) Classifier v.2.2 was used to taxonomically classify OTU representative sequences in the following databases: Greengene V201305; [50] RDP (Release9 201203) [51].
Quantitative real-time PCR
In order to compare different expression level of TNF, COX2, MMP9, and CTNNB in 180 cancer tissues with different abundance of bacteria associated with patients’ prognosis, we defined 30 samples with most abundance of certain bacteria species as high abundance, similarly 30 samples with lest abundance of same species were defined as low abundance. Then, eight tissue samples were randomly chosen from each of the two sets of samples to build two group of specimens that contained high and low bacterial species abundance. Quantitative real-time PCR was used to detect the different mRNA expression level of TNF, COX2, MMP9, and CTNNB between these two groups. Briefly, total RNA was extracted using TRIzol reagent (Invitrogen). The reverse-transcription PCR (RT-PCR) was performed using Fermentas RT reagent Kit according to the manufacturer’s instructions, and the qPCR was performed using the SYBR Green 1 and measured using LightCycler 480 System (Roche, Basel, Switzerland). Primers for qRT-PCR are as follows. TNF: Forward, 5'-GCCGCATCGCCGTCTCCTAC-3′, Reverse 5′-CCTCAGCCCCCTCTGGGG TC-3′, MMP9: Forward, 5′- TTGACAGCGACAAGAAGT-3′, Reverse 5′- GGGCGAGGACCATAGA-3′, COX2: Forward, 5′- TACAATGCTGACTATGGCTAC-3′, Reverse 5′- TGATGCGTGAAGTGCTG-3′, CTNNB: Forward, 5′- GGCAGCAACAGTCTTA -3′, Reverse 5′- GTCTCAGGGAACATAGC -3′, Actin: Forward, 5′- GGAAATCGTGCGTGACATTAA -3′, Reverse, 5′- AGGAAGGAAGGCTGGAAGAG -3′. The relative expression levels were calculated by the 2-ΔΔCT method. Each assay was carried out in triplicate.
Western blot analysis
Western blotting was performed to detect the differences of TNF-α, COX-2, MMP-9, β-catenin and NF-κB in above-mentioned paired tissues. Total proteins were prepared from frozen tissue by Cellytic M cell lysis Reagent (Sigma-Aldrich Inc., St. Louis, MO, US). After being centrifuged at 12,000g for 20 min, the supernatants were loaded onto 10% SDS-PAGE gels, electrophoresed, and transferred to PVDF membrane (Millipore). Then, Membranes were incubated overnight at 4°C with TNF-α, COX-2, MMP-9, β-catenin and NF-κB antibodies (Abcam) respectively, β-actin was served as an internal loading control. After washes, membranes were incubated with appropriate secondary antibodies for 1 hr at room temperature, and bands were scanned using a ChemiDoc™ Touch Imaging System (Bio-Rad Laboratories, UK).
Immunohistochemical analysis
Briefly, tumor samples were embedded using tissue freezing medium, then fixed tissues were cut into sections by a microtome. The endogenous peroxidase activity was blocked with 3% H2O2 for 20 min and pre-incubated in normal goat serum for 20 minutes at room temperature. After blocking, the sections were incubated with primary anti-Kras (Millipore), anti-Braf (Abcam) and anti-Mlh1 (Abgent) antibody at 4°C overnight. After rinsing three times with 0.01 mol/L phosphate-buffered saline (PBS; pH = 7.4) for 10 mins, the detection of the primary antibody was achieved by addition of biotinylated secondary antibody for 1 hr at room temperature, and stained with DAB (3,3-diaminobenzidine) after washing in PBS again. The staining results were scored by two pathologists blinded to the clinical data using the German immunoreactive score (IRS). Briefly, staining intensity was graded as “0” (negative), “1” (weak), “2” (moderate) and “3” (strong); staining extent was graded as “0” (<5%), “1” (5–25%), “2” (25–50%), “3” (50–75%) or “4” (>75%). Values of the staining intensity and the staining extent were multiplied as a final IRS.
Statistical analysis
Metastats (http://metastats.cbcb.umd.edu/) and R (v3.0.3) are used to determine which taxonomic groups were significantly different between groups of samples. We adjusted the obtained P-value by a Benjamini-Hochberg false discovery rate (FDR) correction (function 'P.adjust' in the stats package of R (v3.0.3)) [52]. Continuous data are presented as mean±standard deviation, unless otherwise stated. The P-values for Bray-Curtis distance and Weighted-Unifrac distance were calculated by ANOSIM analysis. Differences between groups were analyzed using Student t test (two-tailed). The association between clinicopathological variables and differences in microbiota were examined by χ 2 tests. The categorical data were analyzed by a Fisher’s exact test. Overall survival (OS) curves were analyzed using the Kaplan–Meier method, and differences were examined using log-rank tests. Cox’s proportional hazard regression test was used to estimate univariate and multivariate hazard ratios for prognosis. P values were two sided, and those <0.05 were considered statistically significant. Analyses were performed with the SPSS software 17.0 and GraphPad Prism 5 software package (GraphPad software Inc, San Diego, CA, USA).
CONFLICTS OF INTEREST
The authors do not have any conflicts of interest with the content of the manuscript.
FUNDING
This work was supported by grants from the National Natural Science Foundation of China (grant 81270449 and 81572314), Natural Science Foundation of Shandong Provincial, China (grant ZR2012HM046), Qingdao Minsheng Science and Technology Foundation, Shandong, China (grant 14-2-3-5-nsh) and the Qingdao Science and Technology Plan Project (grant 13-1-4-220-jch).
REFERENCES
1. Ferlay J, Soerjomataram I, Ervik M, Dikshit R, Eser S, Mathers C, Rebelo M, Parkin DM, Forman D, Bray, F. GLOBOCAN 2012 v1.0, Cancer Incidence and Mortality Worldwide: IARC CancerBase No. 11 [Internet]. Lyon, France: International Agency for Research on Cancer; 2013. Available from: http://globocan.iarc.fr.
2. Torre LA, Bray F, Siegel RL, Ferlay J, Lortet-Tieulent J, Jemal A. Global cancer statistics, 2012. CA: a cancer journal for clinicians. 2015; 65:87-108.
3. Jiang B, Liang X, Chen Y, Ma T, Liu L, Li J, Jiang R, Chen T, Zhang X, Li S. Integrating next-generation sequencing and traditional tongue diagnosis to determine tongue coating microbiome. Scientific reports. 2012; 2:936.
4. Caporaso JG, Lauber CL, Walters WA, Berg-Lyons D, Lozupone CA, Turnbaugh PJ, Fierer N, Knight R. Global patterns of 16S rRNA diversity at a depth of millions of sequences per sample. Proceedings of the National Academy of Sciences of the United States of America. 2011; 108:4516-4522.
5. Flanagan L, Schmid J, Ebert M, Soucek P, Kunicka T, Liska V, Bruha J, Neary P, Dezeeuw N, Tommasino M, Jenab M, Prehn JH, Hughes DJ. Fusobacterium nucleatum associates with stages of colorectal neoplasia development, colorectal cancer and disease outcome. Eur J Clin Microbiol Infect Dis. 2014; 33:1381-1390.
6. Rubinstein MR, Wang X, Liu W, Hao Y, Cai G, Han YW. Fusobacterium nucleatum promotes colorectal carcinogenesis by modulating E-cadherin/beta-catenin signaling via its FadA adhesin. Cell host & microbe. 2013; 14:195-206.
7. Miquel S, Martin R, Rossi O, Bermudez-Humaran LG, Chatel JM, Sokol H, Thomas M, Wells JM, Langella P. Faecalibacterium prausnitzii and human intestinal health. Current opinion in microbiology. 2013; 16:255-261.
8. Bashir A, Miskeen AY, Bhat A, Fazili KM, Ganai BA. Fusobacterium nucleatum: an emerging bug in colorectal tumorigenesis. Eur J Cancer Prev. 2015; 24:373-385.
9. Kostic AD, Gevers D, Pedamallu CS, Michaud M, Duke F, Earl AM, Ojesina AI, Jung J, Bass AJ, Tabernero J, Baselga J, Liu C, Shivdasani RA, Ogino S, Birren BW, Huttenhower C, et al. Genomic analysis identifies association of Fusobacterium with colorectal carcinoma. Genome research. 2012; 22:292-298.
10. Boleij A, Hechenbleikner EM, Goodwin AC, Badani R, Stein EM, Lazarev MG, Ellis B, Carroll KC, Albesiano E, Wick EC, Platz EA, Pardoll DM, Sears CL. The Bacteroides fragilis toxin gene is prevalent in the colon mucosa of colorectal cancer patients. Clin Infect Dis. 2015; 60:208-215.
11. Qian BZ, Pollard JW. Macrophage diversity enhances tumor progression and metastasis. Cell. 2010; 141:39-51.
12. Peinado H, Lavotshkin S, Lyden D. The secreted factors responsible for pre-metastatic niche formation: old sayings and new thoughts. Seminars in cancer biology. 2011; 21:139-146.
13. Kim JM, Lee JY, Yoon YM, Oh YK, Kang JS, Kim YJ, Kim KH. Bacteroides fragilis enterotoxin induces cyclooxygenase-2 and fluid secretion in intestinal epithelial cells through NF-kappaB activation. European journal of immunology. 2006; 36:2446-2456.
14. Wang T, Cai G, Qiu Y, Fei N, Zhang M, Pang X, Jia W, Cai S, Zhao L. Structural segregation of gut microbiota between colorectal cancer patients and healthy volunteers. The ISME journal. 2012; 6:320-329.
15. Castellarin M, Warren RL, Freeman JD, Dreolini L, Krzywinski M, Strauss J, Barnes R, Watson P, Allen-Vercoe E, Moore RA, Holt RA. Fusobacterium nucleatum infection is prevalent in human colorectal carcinoma. Genome research. 2012; 22:299-306.
16. Mima K, Nishihara R, Qian ZR, Cao Y, Sukawa Y, Nowak JA, Yang J, Dou R, Masugi Y, Song M, Kostic AD, Giannakis M, Bullman S, Milner DA, Baba H, Giovannucci EL, et al. Fusobacterium nucleatum in colorectal carcinoma tissue and patient prognosis. Gut. 2015.
17. Rhee KJ, Wu S, Wu X, Huso DL, Karim B, Franco AA, Rabizadeh S, Golub JE, Mathews LE, Shin J, Sartor RB, Golenbock D, Hamad AR, Gan CM, Housseau F, Sears CL. Induction of persistent colitis by a human commensal, enterotoxigenic Bacteroides fragilis, in wild-type C57BL/6 mice. Infection and immunity. 2009; 77:1708-1718.
18. Sears CL and Garrett WS. Microbes, microbiota, and colon cancer. Cell host & microbe. 2014; 15:317-328.
19. Wu S, Rhee KJ, Albesiano E, Rabizadeh S, Wu X, Yen HR, Huso DL, Brancati FL, Wick E, McAllister F, Housseau F, Pardoll DM, Sears CL. A human colonic commensal promotes colon tumorigenesis via activation of T helper type 17 T cell responses. Nature medicine. 2009; 15:1016-1022.
20. McCoy AN, Araujo-Perez F, Azcarate-Peril A, Yeh JJ, Sandler RS, Keku TO. Fusobacterium is associated with colorectal adenomas. PloS one. 2013; 8:e53653.
21. Luo JL, Maeda S, Hsu LC, Yagita H, Karin M. Inhibition of NF-kappaB in cancer cells converts inflammation- induced tumor growth mediated by TNFalpha to TRAIL-mediated tumor regression. Cancer cell. 2004; 6:297-305.
22. Wu Y, Deng J, Rychahou PG, Qiu S, Evers BM, Zhou BP. Stabilization of snail by NF-kappaB is required for inflammation-induced cell migration and invasion. Cancer cell. 2009; 15:416-428.
23. Yang J, Weinberg RA. Epithelial-mesenchymal transition: at the crossroads of development and tumor metastasis. Developmental cell. 2008; 14:818-829.
24. Zucker S, Vacirca J. Role of matrix metalloproteinases (MMPs) in colorectal cancer. Cancer metastasis reviews. 2004; 23:101-117.
25. Elinav E, Nowarski R, Thaiss CA, Hu B, Jin C, Flavell RA. Inflammation-induced cancer: crosstalk between tumours, immune cells and microorganisms. Nature reviews Cancer. 2013; 13:759-771.
26. Schwitalla S, Fingerle AA, Cammareri P, Nebelsiek T, Goktuna SI, Ziegler PK, Canli O, Heijmans J, Huels DJ, Moreaux G, Rupec RA, Gerhard M, Schmid R, Barker N, Clevers H, Lang R, et al. Intestinal tumorigenesis initiated by dedifferentiation and acquisition of stem-cell-like properties. Cell. 2013; 152:25-38.
27. Kostic AD, Chun E, Robertson L, Glickman JN, Gallini CA, Michaud M, Clancy TE, Chung DC, Lochhead P, Hold GL, El-Omar EM, Brenner D, Fuchs CS, Meyerson M, Garrett WS. Fusobacterium nucleatum potentiates intestinal tumorigenesis and modulates the tumor-immune microenvironment. Cell host & microbe. 2013; 14:207-215.
28. Mima K, Sukawa Y, Nishihara R, Qian ZR, Yamauchi M, Inamura K, Kim SA, Masuda A, Nowak JA, Nosho K, Kostic AD, Giannakis M, Watanabe H, Bullman S, Milner DA, Harris CC, et al. Fusobacterium nucleatum and T Cells in Colorectal Carcinoma. JAMA oncology. 2015; 1:653-661.
29. Wu S, Shin J, Zhang G, Cohen M, Franco A, Sears CL. The Bacteroides fragilis toxin binds to a specific intestinal epithelial cell receptor. Infection and immunity. 2006; 74:5382-5390.
30. Sears CL. Enterotoxigenic Bacteroides fragilis: a rogue among symbiotes. Clinical microbiology reviews. 2009; 22:349-369, Table of Contents.
31. Wu S, Lim KC, Huang J, Saidi RF, Sears CL. Bacteroides fragilis enterotoxin cleaves the zonula adherens protein, E-cadherin. Proceedings of the National Academy of Sciences of the United States of America. 1998; 95:14979-14984.
32. Tsujii M, Kawano S, DuBois RN. Cyclooxygenase-2 expression in human colon cancer cells increases metastatic potential. Proceedings of the National Academy of Sciences of the United States of America. 1997; 94:3336-3340.
33. Jones MK, Wang H, Peskar BM, Levin E, Itani RM, Sarfeh IJ, Tarnawski AS. Inhibition of angiogenesis by nonsteroidal anti-inflammatory drugs: insight into mechanisms and implications for cancer growth and ulcer healing. Nature medicine. 1999; 5:1418-1423.
34. Sokol H, Pigneur B, Watterlot L, Lakhdari O, Bermudez-Humaran LG, Gratadoux JJ, Blugeon S, Bridonneau C, Furet JP, Corthier G, Grangette C, Vasquez N, Pochart P, Trugnan G, Thomas G, Blottiere HM, et al. Faecalibacterium prausnitzii is an anti-inflammatory commensal bacterium identified by gut microbiota analysis of Crohn disease patients. Proceedings of the National Academy of Sciences of the United States of America. 2008; 105:16731-16736.
35. Quevrain E, Maubert MA, Michon C, Chain F, Marquant R, Tailhades J, Miquel S, Carlier L, Bermudez-Humaran LG, Pigneur B, Lequin O, Kharrat P, Thomas G, Rainteau D, Aubry C, Breyner N, et al. Identification of an anti-inflammatory protein from Faecalibacterium prausnitzii, a commensal bacterium deficient in Crohn's disease. Gut. 2015.
36. Grivennikov SI. Inflammation and colorectal cancer: colitis-associated neoplasia. Seminars in immunopathology. 2013; 35:229-244.
37. Roth AD, Tejpar S, Delorenzi M, Yan P, Fiocca R, Klingbiel D, Dietrich D, Biesmans B, Bodoky G, Barone C, Aranda E, Nordlinger B, Cisar L, Labianca R, Cunningham D, Van Cutsem E, et al. Prognostic role of KRAS and BRAF in stage II and III resected colon cancer: results of the translational study on the PETACC-3, EORTC 40993, SAKK 60-00 trial. J Clin Oncol. 2010; 28:466-474.
38. Therkildsen C, Bergmann TK, Henrichsen-Schnack T, Ladelund S, Nilbert M. The predictive value of KRAS, NRAS, BRAF, PIK3CA and PTEN for anti-EGFR treatment in metastatic colorectal cancer: A systematic review and meta-analysis. Acta oncologica. 2014; 53:852-864.
39. Gryfe R, Kim H, Hsieh ET, Aronson MD, Holowaty EJ, Bull SB, Redston M, Gallinger S. Tumor microsatellite instability and clinical outcome in young patients with colorectal cancer. The New England journal of medicine. 2000; 342:69-77.
40. Watanabe T, Wu TT, Catalano PJ, Ueki T, Satriano R, Haller DG, Benson AB, 3rd, Hamilton SR. Molecular predictors of survival after adjuvant chemotherapy for colon cancer. The New England journal of medicine. 2001; 344:1196-1206.
41. Phipps AI, Limburg PJ, Baron JA, Burnett-Hartman AN, Weisenberger DJ, Laird PW, Sinicrope FA, Rosty C, Buchanan DD, Potter JD, Newcomb PA. Association between molecular subtypes of colorectal cancer and patient survival. Gastroenterology. 2015; 148:77-87.e72.
42. Jass JR. Classification of colorectal cancer based on correlation of clinical, morphological and molecular features. Histopathology. 2007; 50:113-130.
43. Garcia-Solano J, Perez-Guillermo M, Conesa-Zamora P, Acosta-Ortega J, Trujillo-Santos J, Cerezuela-Fuentes P, Makinen MJ. Clinicopathologic study of 85 colorectal serrated adenocarcinomas: further insights into the full recognition of a new subset of colorectal carcinoma. Human pathology. 2010; 41:1359-1368.
44. Douillard JY, Siena S, Cassidy J, Tabernero J, Burkes R, Barugel M, Humblet Y, Bodoky G, Cunningham D, Jassem J, Rivera F, Kocakova I, Ruff P, Blasinska-Morawiec M, Smakal M, Canon JL, et al. Final results from PRIME: randomized phase III study of panitumumab with FOLFOX4 for first-line treatment of metastatic colorectal cancer. Ann Oncol. 2014; 25:1346-1355.
45. Van Cutsem E, Kohne CH, Hitre E, Zaluski J, Chang Chien CR, Makhson A, D'Haens G, Pinter T, Lim R, Bodoky G, Roh JK, Folprecht G, Ruff P, Stroh C, Tejpar S, Schlichting M, et al. Cetuximab and chemotherapy as initial treatment for metastatic colorectal cancer. The New England journal of medicine. 2009; 360:1408-1417.
46. Vilar E, Scaltriti M, Balmana J, Saura C, Guzman M, Arribas J, Baselga J, Tabernero J. Microsatellite instability due to hMLH1 deficiency is associated with increased cytotoxicity to irinotecan in human colorectal cancer cell lines. British journal of cancer. 2008; 99:1607-1612.
47. Magrini R, Bhonde MR, Hanski ML, Notter M, Scherubl H, Boland CR, Zeitz M, Hanski C. Cellular effects of CPT-11 on colon carcinoma cells: dependence on p53 and hMLH1 status. International journal of cancer. 2002; 101:23-31.
48. Edgar RC. UPARSE: highly accurate OTU sequences from microbial amplicon reads. Nature methods. 2013; 10:996-998.
49. Edgar RC, Haas BJ, Clemente JC, Quince C, Knight R. UCHIME improves sensitivity and speed of chimera detection. Bioinformatics (Oxford, England). 2011; 27:2194-2200.
50. DeSantis TZ, Hugenholtz P, Larsen N, Rojas M, Brodie EL, Keller K, Huber T, Dalevi D, Hu P, Andersen GL. Greengenes, a chimera-checked 16S rRNA gene database and workbench compatible with ARB. Applied and environmental microbiology. 2006; 72:5069-5072.
51. Cole JR, Wang Q, Cardenas E, Fish J, Chai B, Farris RJ, Kulam-Syed-Mohideen AS, McGarrell DM, Marsh T, Garrity GM, Tiedje JM. The Ribosomal Database Project: improved alignments and new tools for rRNA analysis. Nucleic acids research. 2009; 37:D141-145.
52. White JR, Nagarajan N, Pop M. Statistical methods for detecting differentially abundant features in clinical metagenomic samples. PLoS computational biology. 2009; 5:e1000352.