
INTRODUCTION
Recent reports have demonstrated the potential value of automated image analysis and claimed it as an alternative to conventional clinical histopathologic analysis. The methodology allows the identification and quantification of novel features or the capture of spatial heterogeneity across a tissue section; however neither of which are currently part of routine histopathologic assessment [1, 2]. We have previously shown that automated image analysis complements, rather than replaces, routine histopathology by standardizing the quantification of prognostic histopathologic features in CRC [3]. Unless automated analysis significantly adds to standard practice there will remain a significant barrier to clinical implementation. Here we demonstrate a workflow which utilizes image analysis to extract standardized big data from histopathologic tissue sections and machine learning to distill the most significant resultant parameters addressing a specific clinical question. Furthermore we show how the image analysis based quantification of a tissue sample can be integrated into existing clinical parameters where the aim is to augment rather than replace gold standard practice. The study demonstrates the value of the approach using colorectal cancer as a worked example.
Patients with colorectal cancer (CRC) are staged by the Tumor, Node and Metastasis (TNM) system, although genetic analyses are increasingly a routine part of diagnosis and sub-classification [4–6]. TNM staging is good for prediction of disease progression across the patient population, however it is much less successful at predicting the outcome for individual patients [7]. This is exemplified by the fact that although surgical resection is hoped to be curative for stage II patients, 20% of these patients go on to experience disease-specific death [8]. It is imperative to identify these high risk stage II patients for the inclusion in future clinical trials or to ascertain if detailed follow up could be beneficial [9].
There have been multiple attempts to improve on patient prognosis and to identify novel clinical targets through molecular biomarker analysis and novel histopathologic grading systems, where the invasive margin of CRC is of particular significance [10–12]. Although these features may have prognostic value they have not been adopted into routine clinical practice for several reasons, including observer variability and non-standardized quantification [13–15]; both of which might be overcome using automated image analysis. Furthermore, there could exist unrecognized morphological features containing targetable or prognostic information within the complex and heterogeneous CRC microenvironment. We therefore built an image analysis algorithm which standardized the quantification of a range of candidate prognostic features from the invasive margin of CRC and which have previously shown prognostic significance: tumor budding (TB) [16, 17], poorly differentiated clusters (PDC) [11, 18], lymphatic vessel invasion (LVI) [19], lymphatic vessel density (LVD) [20, 21] and the tumor to stroma ratio [22, 23]. These known features were furthermore compared to other morphometric and spatial parameters captured without bias and measured using hierarchical image analysis.
RESULTS
Image analysis and processing workflow
We have developed a novel image analysis algorithm which quantified candidate histopathologic features in an objective and standardized manner while simultaneously capturing a large, extracted set of unbiased features (123 features in total). The most informative features were subsequently distilled through decision tree modelling. The image processing workflow (Figure 1) was designed to identify the most significant conventional or novel feature-set capable of classifying high or low risk of disease specific death in stage II CRC patients. The workflow was carried out across a training set of 50 patients and the significant parameters identified were validated across a cohort of 134 patients.
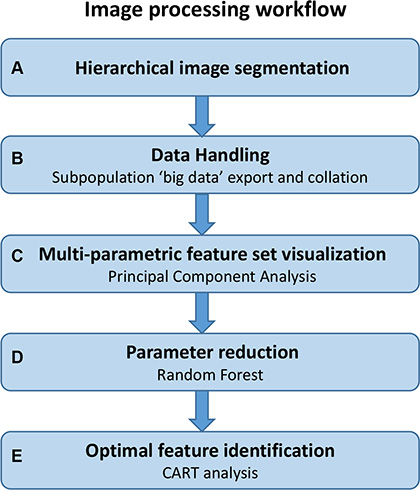
Figure 1: Image processing workflow. Steps involved in the imaging process workflow described in this study; from initial image analysis through to the identification of significant parameters by decision tree modelling. This workflow is amenable to any multi-parametric data set where significant parameters and their clinically applicable cut-offs need to be identified.
Image segmentation and data export
The algorithm automatically segmented the immunofluorescence labelled digital tissue sections in a hierarchical format (Figure 2A). Immunofluorescence allowed the accurate digital segmentation of stroma, tumor glands (pan cytokeratin (panCK)), invasive tumor subpopulations (panCK), lymphatic vasculature (D2- 40) and all nuclei (DAPI). These objects were sub-classified into candidate histopathologic features prior to quantification: tumor buds, poorly differentiated clusters, lymphatic vessel invasion, minimal lymphatic vessel invasion (less than 5 tumor cells invading vessel), lymphatic vessel density and tumor to stroma ratio. These parameters were specifically included in the algorithm for standardized quantification as they have been shown to have prognostic value but are difficult to accurately reproduce. Furthermore morphometric, density, spatial and fluorescence intensity and texture measurements were captured and exported from the hierarchically segmented objects in an unbiased manner (Figure 2B and 2C). In such a fashion, parameters were extracted from objects across each level of image analysis (Figure 2A). The hierarchical and spatial re-classifying of objects was integrated into the algorithm to capture an aspect of the complex tumor heterogeneity that exists across the invasive front of the CRC microenvironment. The full 123 parameter data-set for each patient sample was subsequently exported and collated (Supplementary Table 1). An extended description of algorithm results and associated Figures is listed in Supplementary Document 1.
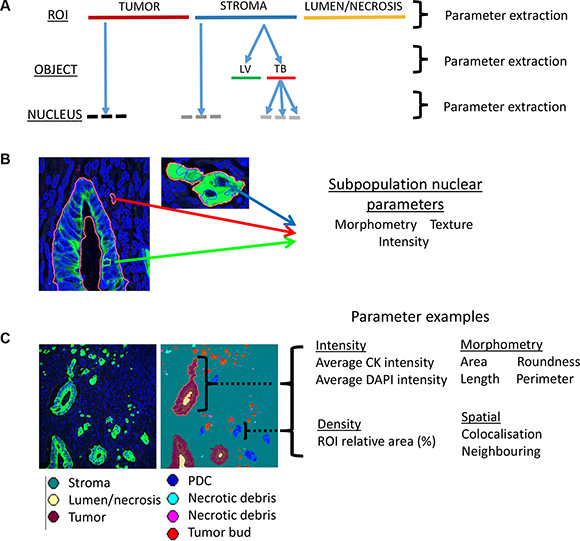
Figure 2: Automated data extraction from analyzed images. (A) Image based parameters are extracted from each of the hierarchical layers of the image analysis algorithm. The top layer (ROI level) segments tumor from lumen/necrosis and from stroma. The ‘object level’ contains segmented objects such as a lymphatic vessel (LV) or tumor bud (TB) which exist exclusively within an ROI in the layer above e.g. the stroma. The final layer of the hierarchy is the ‘nucleus level’ and contains all segmented nuclei. Nuclei are further segregated into either an object (e.g. tumor) in the ROI level or object (e.g tumor bud) in the object level. The hierarchical approach allows for the capture of heterogeneity across the invasive microenvironment. (B) Extraction of parameter classes across nuclei segregated within three distinct heterogeneous objects/ROIs: Tumor gland (nucleus highlighted by green arrow), stroma (nucleus highlighted by red arrow) and tumor bud (nucleus highlighted by blue arrow). (C) Visualization of the extraction of different parameter classes and example parameters across the heterogeneous objects (e.g. tumor gland; purple, poorly differentiated cluster (PDC); blue) within a digital tissue image (panCK; green, DAPI; blue).
Visualization of the multi-parametric feature-set
The complex and high dimensional multi-parametric feature-set was visualized in a 2D scatter plot after principal component analysis (PCA) was performed (Figure 3). The 2 plotted principal components explained 72% variance in the full 50 patient training set data. Performing PCA allowed the evaluation of the effectiveness of the full multi-parametric feature-set to categorize patients within the full training cohort into high or low risk of disease specific death. In the stage II subpopulation of the training set there was only one outlier patient who survived follow up and which clustered within the poor outcome group (Figure 3B). The clustering of the full multi-parametric feature-set across the 50 patient training cohort allowed patient categorization on disease specific death with 100% specificity, 78.6% sensitivity and an area under the ROC curve of 0.89. When analyzing the 29 stage II patient subpopulation of the training set, the results were 100% specificity, 93.3% sensitivity and an area under the ROC of 0.94.
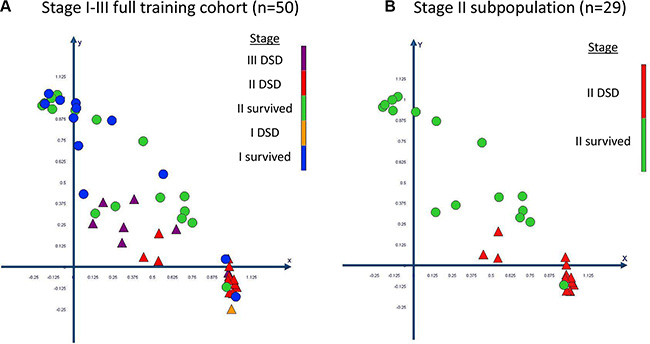
Figure 3: Visualization and clustering of the multi-parametric feature set through principal component analysis (PCA). The data is plotted in a scatter plot for (A) the full training set and (B) for its stage II subpopulation. Patients who died specifically of CRC are plotted as triangles and patients who survived follow up are plotted as circles. The PCA resulted in the significant categorization of patients at a high and low risk of disease specific death. DSD = disease specific death.
Parameter reduction
Although clustering of the multi-parametric data resulted in the significant categorization of CRC patients on disease specific death, PCA did not report which of the parameters held prognostic significance. To eliminate redundant parameters, while retaining a robust stratification model, we performed random forest analysis.
The 123 parameters within the full multi-parametric feature-set and the full 50 patient training set data were the input for random forest analysis. After analysis the 123 parameters were ranked by their associated Gini score and the least significant parameter was removed. This process was performed iteratively until the removal of a parameter affected the predictive value of the model in a negative manner. The method resulted in a set of 37 parameters (Supplementary Table 1) which had the ability to categorize patients on risk of CRC specific death with the same predictive value as the full multi-parametric feature-set (100% specificity, 76.7% sensitivity, area under the ROC curve of 0.89).
Novel histopathologic feature identification
Random forest removed 86 redundant parameters from the full multi-parametric feature-set. The remaining 37 significant parameters were used as input to construct a Classification and Regression Tree (CART) model. The CART model exported a single decision tree where parameter relationships and optimal cut-offs for each branch-point within the tree can be reported. CART therefore allows clinically transferable tests to be created from the calculated cut-offs within the optimal parameters reported.
In this study a single parameter was exported within the decision tree as the optimal model. This parameter was the “sum area of poorly differentiated clusters” (AreaPDC) across the invasive front of each tissue section. The inclusion of any further image-based parameters did not, therefore, add to the significance of the model. This single parameter had the ability to significantly categorize the 50 patients from the training cohort by disease specific death with a specificity of 96.3%, a sensitivity of 82.6% and an area under the receiver operator curve (ROC) of 0.9. When the 29 stage II subpopulation of the training cohort was analyzed separately the results were more significant and returned a specificity of 100%, a sensitivity of 93.75% with an area under the ROC of 0.96. The CART model performed 10 fold self-test validation on the full 50 patient training cohort data setwhich reported a specificity of 83.3% and sensitivity of 75% and an area under the ROC of 0.8.
The CART model provided the optimal cut-off from the continuous data captured from the full 50 patient training set across the novel parameter AreaPDC. This cut-off, 35,647 μm2, was applied to categorize the patients into groups of high and low risk of disease specific death. Kaplan-Meier curves were subsequently plotted and reported that the AreaPDC was a significant predictor of poor survival and shorter disease specific survival times in both the full 50 patient training cohort (p < 0.0001) and its 29 patient stage II subpopulation (p < 0.0001) (Supplementary Figure 6). Univariate cox-regression reports that the parameter AreaPDC is a highly significant predictor of disease specific death in the training cohort (HR = 20; 95% CI, 4.6–87.9).
Validation of image based prognostic features
The analysis algorithm was executed across tissue sections cut from the 134 stage II patient validation set. This was performed primarily to validate the novel prognostic parameter of AreaPDC which we identified in this study. Secondly to compare the prognostic significance of the image analysis quantified set of candidate histopathologic features and the novel parameter.
The validation set patients were separated into categorical groups of either above or below the training set cut-offs for each parameter. Optimal validated cut-offs and their prognostic significance for the training set are listed in Supplementary Table 2. Disease specific death statistics were calculated as univariate Cox-regression and Kaplan-Meier analysis for the validation set data. Univariate Cox-regression reported that tumor budding (HR = 2.5; 95% CI, 1–6), minimal lymphatic vessel invasion (HR = 2.5; 95% CI, 1–6), poorly differentiated clusters (HR = 3; 95% CI, 1.2–9), tumor to stroma ratio (HR = 0.1; 95% CI, 0.03–0.6) and the AreaPDC (HR = 4; 95% CI, 1.5– 11) were significant predictors of disease specific death within the validation set whereas lymphatic vessel density and lymphatic vessel invasion were not (Table 1). The novel parameter AreaPDC returned a higher associated significance (p = 0.007) than any of the candidate histopathologic parameters apart from the tumor to stroma ratio which reported the same significance (p = 0.007). No single parameter identified through image analysis had a higher prognostic significance than the clinically reported pT stage (HR = 4.26; 95% CI, 1.76–10.33, p = 0.001).
Table 1: Validation set patient data
Clinicopathologic parameters |
patient number (n) |
Univariate |
|||
|---|---|---|---|---|---|
HR |
95% CI |
P value |
|||
|
Lower |
Upper |
|
||
Clinical pathology report |
|||||
Stage |
|
|
|
|
|
II |
134 |
|
|
|
|
Gender |
|
0.93 |
0.6 |
1.45 |
0.76 |
M |
69 |
|
|
|
|
F |
65 |
|
|
|
|
Age at Diagnosis |
|
1.4 |
0.82 |
2.41 |
0.22 |
≤ 70 |
52 |
|
|
|
|
71–79 |
39 |
|
|
|
|
≥ 80 |
43 |
|
|
|
|
pT Stage |
|
4.26 |
1.76 |
10.33 |
0.001 |
pT3 |
102 |
|
|
|
|
pT4 |
32 |
|
|
|
|
Differentiation |
|
2.17 |
1.14 |
4.13 |
0.018 |
Well |
3 |
|
|
|
|
Moderate |
109 |
|
|
|
|
Poor |
22 |
|
|
|
|
Histology |
|
0.82 |
0.27 |
2.49 |
0.72 |
AC |
121 |
|
|
|
|
MC |
7 |
|
|
|
|
AC/MC |
6 |
|
|
|
|
Site |
|
0.87 |
0.5 |
1.51 |
0.61 |
Rectal |
42 |
|
|
|
|
Right side |
47 |
|
|
|
|
Left side |
45 |
|
|
|
|
Tumor Diameter* |
|
1.7 |
0.66 |
4.42 |
0.27 |
High |
44 |
|
|
|
|
Low |
90 |
|
|
|
|
Total Node Examined |
|
0.6 |
0.24 |
1.5 |
0.27 |
< 12 |
35 |
|
|
|
|
≥ 12 |
99 |
|
|
|
|
EM LVI |
|
2.8 |
1.1 |
7.3 |
0.04 |
Yes |
20 |
|
|
|
|
No |
114 |
|
|
|
|
Image Analysis |
|||||
Tumor Budding |
|
2.49 |
1.03 |
5.99 |
0.04 |
High |
44 |
|
|
|
|
Low |
90 |
|
|
|
|
Minimal LVI |
|
2.46 |
1 |
6.05 |
0.05 |
High |
35 |
|
|
|
|
Low |
99 |
|
|
|
|
LVI |
|
1.9 |
0.75 |
5.15 |
0.16 |
High |
27 |
|
|
|
|
Low |
107 |
|
|
|
|
Tumor to stroma ratio |
|
0.13 |
0.03 |
0.57 |
0.007 |
High |
76 |
|
|
|
|
Low |
58 |
|
|
|
|
LVD |
|
1.39 |
0.46 |
4.16 |
0.56 |
High |
25 |
|
|
|
|
Low |
109 |
|
|
|
|
Number PDC |
|
3.03 |
1.08 |
8.5 |
0.04 |
High |
18 |
|
|
|
|
Low |
116 |
|
|
|
|
Area PDC |
|
4.02 |
1.46 |
11.1 |
0.007 |
High |
65 |
|
|
|
|
Low |
69 |
|
|
|
|
NPI |
|
7.5 |
3 |
18.5 |
0.00001 |
High |
22 |
|
|
|
|
Low |
112 |
|
|
|
|
Patient data was extracted from the clinical pathology report and categorized prior to univariate Cox-regression (top half of table). Image analysis data was categorized into above or below training set cut-off (bottom half of table) prior to univariate Cox-regression. Novel Prognostic Index (NPI) of integrated Area PDC, pT stage and differentiation is bordered by double line. HR = hazard ratio, CI = confidence interval. EM LVI = Extramural lymphovascular invasion, LVI = lymphatic vessel invasion, LVD = lymphatic vessel density, PDC = poorly differentiated clusters. *No entry in pathology report for tumor diameter in 18 cases. Parameters in bold were significant; significance was set at (p ≤ 0.05).
Kaplan-Meier curves were plotted for the significant parameters utilizing the categorized validation cohort data to assess disease specific survival over time (Figure 4). Patients in the high cut-off group for tumor budding (p = 0.05), poorly differentiated clusters (p = 0.02), minimal lymphatic vessel invasion (p = 0.05), AreaPDC (p = 0.003) as well as patients in the lower cut-off group for the tumor to stroma ratio (p = 0.004) had a higher risk of disease specific death and significantly shorter survival times than patients in the alternative group. The Kaplan-Meier analysis confirmed the novel parameter of AreaPDC to hold the highest significance of the risk of disease specific death over time than any of the other histopathologic parameters, although this was less than clinical pT staging (p = 0.0009).
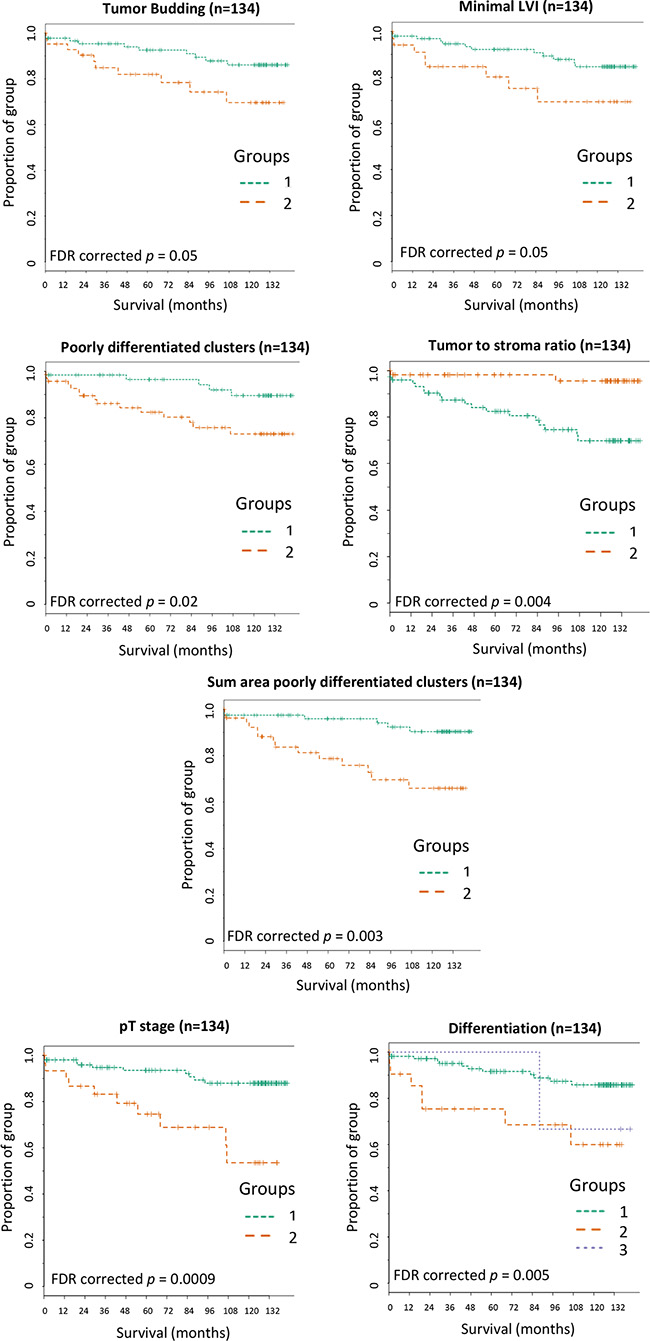
Figure 4: Kaplan-Meier survival curves for the significant histopathologic parameters captured across the validation set. Patients within group 1 were below the training set cut-off for the associated parameter and patients within group 2 were above cut-off. (A) Tumor budding: training set cut-off of 287 buds. (B) Minimal LVI: training set cut-off of 16 events. (C) Poorly differentiated clusters: training set cut-off of 35 clusters. (D) Tumor to stroma ratio: training set cut-off of 21% tumor area of the total tissue. (E) Sum area poorly differentiated clusters (AreaPDC): training set cut-off of 35647 μm2. (F) pT stage: pT3 = group1 and pT4 = group 2. (G) Differentiation: Well = group 1, Moderate = group 2 and Poor = group 3. FDR = false discovery rate corrected p values.
Novel prognostic index augments clinical staging
The significant parameters reported by univariate cox-regression (Table 1), from either image analysis or the clinical pathology report, were entered into a multivariate backward elimination Cox-regression model. This was performed to identify which parameters added significant value to an integrative model in its ability to predict CRC specific death within the validation set. The integration of AreaPDC (p = 0.02), T stage (p = 0.03) and differentiation (p = 0.04) increased the significance of a final predictive model. The image analysis parameters of tumor budding (p = 0.8), poorly differentiated clusters (p = 0.51), minimal lymphatic vessel invasion (p = 0.8) and the tumor to stroma ratio (p = 0.55) or the clinical parameter of extra-mural lymphovascular invasion (EM LVI) (p = 0.18) did not add further significance to the model and were therefore excluded (Table 2A).
Table 2A: Parameters entered into the backwards elimination Cox Regression model
Variables in the equation |
Multivariate Cox Regression Model (Ordinal Variables) |
|||
|---|---|---|---|---|
HR |
95% CI |
P value |
||
|
Lower |
Upper |
|
|
Area PDC |
3.3 |
1.1 |
9.3 |
0.005 |
pT stage |
2.9 |
1.1 |
7.3 |
0.030 |
Differentiation |
2.2 |
1 |
4.9 |
0.046 |
Variables not in the equation |
||||
EMLVI |
|
|
|
NS |
Tumor to stroma ratio |
|
|
|
NS |
TB |
|
|
|
NS |
PDC |
|
|
|
NS |
Minimal LVI |
|
|
|
NS |
Variables which add significance (top half of table) and variables which do not add significance (bottom half of table) to an integrative model to predict disease specific death. NS = Non-significant. Area PDC = area of poorly differentiated clusters, EMLVI = extramural lymphovascular invasion, TB = tumor budding, PDC = poorly differentiated clusters, Minimal LVI = minimal lymphatic vessel invasion.
The three significant parameters within the forward conditional model were compiled into a novel prognostic index. Patients with an above cut-off score in two or more of the three significant parameters were classified as a “high-risk” of disease specific death group and the remainder of the patients were classified with a “low-risk” score. The novel prognostic index was the sole significant parameter to predict disease specific death (HR = 7.5; 95% CI, 3–18.5, p = 0.00001) (Table 1) when entered into a backward elimination Cox regression model along with its composite parts (Table 2B). The novel prognostic index’s prediction of CRC specific death reported a significant improvement on classical pT staging (HR = 4.26; 95% CI, 1.76–10.33, p = 0.001) within this stage II CRC patient validation cohort.
Table 2B: Parameters entered into the backwards elimination Cox Regression model
Variables in the equation |
Multivariate Cox Regression Model (Ordinal Variables) |
|||
|---|---|---|---|---|
HR |
95% CI |
P value |
||
|
Lower |
Upper |
|
|
NPI |
7.5 |
3 |
18.4 |
0.00001 |
Variables not in the equation |
||||
Area PDC |
|
|
|
NS |
pT stage |
|
|
|
NS |
Differentiation |
|
|
|
NS |
Variables which add significance (top half of table) and variables which do not add significance (bottom half of table) to an integrative model to predict disease specific death. NS = Non-significant. Area PDC = area of poorly differentiated clusters.
Kaplan-Meier curves were plotted to assess the significance of the novel prognostic index in patient survival over time (Figure 5). The novel prognostic index significantly categorized stage II CRC patients with a high risk of CRC specific death over an 11.5 year follow up (p < 0.0001).
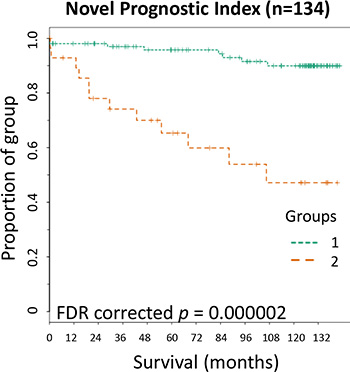
Figure 5: Kaplan-Meier survival curve for the Novel Prognostic Index. Novel Prognostic Index; patients within group 2 were within above cut-off in two or more of the composite parameters while those in group 1 were within above cut-off of one or no composite parameters. FDR = false discovery rate corrected p values.
DISCUSSION
We have demonstrated that a novel feature, area of poorly differentiated clusters (AreaPDC) identified through image analysis can augment traditional histopathologic staging of stage II CRC, moving toward a more personalized prognosis. Furthermore the evidence that the involvement of poorly differentiated clusters is highly significant in disease progression directs future research into the elucidation of their molecular phenotype and thereby identifying novel targets to inhibit their invasive characteristics. The novel feature (AreaPDC) was distilled through decision tree modelling from a large hierarchical and multi-parametric feature-set which contained both candidate histopathologic features and ones captured in an unbiased manner. The data was entered into the model with no knowledge a priori of which image based parameter would hold clinical significance. The multi-parametric feature-set itself was captured through a novel image analysis algorithm developed within this study and which was executed across digitized CRC tissue sections from a training and validation cohort. The patients within the validation cohort were significantly categorized into high and low risk of disease specific death (HR = 4; 95% CI, 1.5–11), depending on their sum area of poorly differentiated clusters (AreaPDC) being above or below the cut-off of 35647 μm2. AreaPDC was more informative than previously reported prognostic features which were simultaneously captured across each patient sample through the bespoke image analysis algorithm, including number of tumor budding [16, 17] number of poorly differentiated clusters [11, 18], tumor to stroma ratio [22, 23] and lymphatic vessel invasion [19]. Although these previous studies reported prognostic significance in CRC as individual parameters, none have simultaneously co-registered all of the quantified features across a single tissue section. We have demonstrated here that tumor budding, poorly differentiated clusters, tumor to stroma ratio and lymphatic vessel invasion also hold univariate significance in the prediction of disease specific death but that they become redundant and add no further independent valuewhen integrated into a multi-variable model which includes the AreaPDC. Furthermore predictive significance increased upon the creation of a novel prognostic index where AreaPDC was integrated with the significant clinical data parameters of differentiation and pT stage (HR = 7.5; 95% CI, 3–18.5, p = 0.00001). Although the use of continuous data is optimal within regression models [24], translatable tests, at least for the foreseeable future, rely on a validated cut-point to inform on clinical decision making. The novel feature AreaPDC was therefore dichotomized using the validated CART reported cut-off prior to entering into regression models which included pre-existing categorical clinical data (pT stage and differentiation). Therefore the potentially translatable novel prognostic index predicts disease specific death in a stage II CRC validation cohort with more accuracy than the standalone conventional pT staging, however further validation of this index will be required.
Previous studies have demonstrated the advantages of image analysis reported large data sets captured in an unbiased manner [1] or to quantify set histopathologic features [3, 25]. Uniquely, the image analysis algorithm developed in this study captured a combination of both in a standardized and objective manner and demonstrated the validity in principle of such methodology. The quantified data was captured in a continuous format which allowed optimal cut-offs for parameters to be calculated and subsequently validated. The multi-parametric feature-set was analyzed in two separate decision tree models. Random forest was utilized to negate redundant parameters which added no value to the predictive binary outcome of disease specific death. A Random forest model [26], consisting of 5000 trees, ranked and reduced the parameters according to their Gini score and significance in the model and is an ideal model for handling large data sets. It is not applicable to a clinical prognostic index as it does not inform on cut-offs or the combinations of parameters which yield the optimal output to stratify patients. A CART model [27], which produces a single decision tree and works more accurately on smaller data sets, was subsequently run across the significant parameters identified through random forest. CART provides optimal and validated cut-offs for each parameter at each branch point within a model and is therefore amenable to the identification of a clinically transferable histopathologic marker or a combination of markers.
The semi-quantification of current and emerging histopathologic features in CRC may suffer from poor reproducibility and inter- and intra-observer variability [10, 14, 15]. Previous studies in tumor budding and poorly differentiated clusters have concentrated on their number [16–18, 28] and not their area; which would prove difficult to accurately report by eye. Image analysis offers the standardization and the fully reproducible quantification of features, such as the accurate reporting of the area of poorly differentiated clusters (AreaPDC). This study employed immunofluorescence for the multiplexing, co-registering and accurate quantification of the features captured across the CRC tissue section. Lymphatic vessel invasion and mesenchymal transitioned invading cancer cells may prove particularly obscure under classical H&E stained tissue. We acknowledge that although advantageous for initial investigative purposes, immunofluorescence may not be applicable to routine clinical use. However, the single novel parameter AreaPDC can be quantified through chromogenic immunohistochemistry using a wide spectrum cytokeratin antibody and a much simplified image analysis algorithm making it amenable to most clinical laboratories. This translational impact would still rely on the wider adoption of digital pathology in routine clinical practice but which is predicted in the near future [29]. Although there are molecular tests to predict poor outcome in stage II CRC patients [30] they tend to homogenize tissue which destroys spatial heterogeneity. Image analysis may unlock a wealth of valuable histopathologic information form the heterogeneous tumor microenvironment, while retaining the spatial resolution of interacting host and tumor subpopulations. In time this can be integrated with molecular genetic data [31]. The area of poorly differentiated clusters, identified as a distinct subpopulation, were the most significant predictor of disease specific death and exemplifies heterogeneous data which may be lost through molecular testing.
Image analysis across tissue microarrays (TMAs) yielded novel prognostic features in breast cancer although the authors acknowledged that analyzing whole slide images could report a more significant model [1]. We found that quantifying the candidate histopathologic features across a single core of a TMA per patient yielded insignificant results (data not shown). We therefore adopted a whole slide imaging approach which allowed the identification of the invasive front of the tumor section and the capture of high resolution images from within this region. We concentrated our analysis on the invasive front as the candidate histopathologic features of interest are predominantly located in, and conventionally reported from, this region. The data captured across these images allowed the significant categorization of high risk of disease specific death CRC patients. Further investigation would need to be performed to identify the optimal number of images required to be captured across the whole section in order to yield reproducible results across potential further validation cohorts.
We utilized proprietary software for the image analysis and data mining aspects of this study. We endeavored to ensure that the overall workflow presented here for novel feature identification from multi-parametric data is possible within open source software thus making it amenable to most clinical research labs. Both random forest and CART can be executed within the statistical package R (http://www.statmethods.net/advstats/cart.html) while image analysis based multi-parametric feature extraction can be performed in Image J (http://imagej.nih.gov/ij/) or Cell Profiler (http://www.cellprofiler.org/). Similarly the workflow is not limited to the specific immunofluorescence assay, candidate histopathologic features or multi-parametric feature set utilized within this study but can be applied across any digital pathology specimen.
TNM staging aided by the core clinical data-set [8, 32] has long remained the gold-standard for the prediction of CRC disease progression. Although, there exists debate on how TNM staging can be improved upon while retaining it as central to CRC prognosis [33]. Therefore it would seem pertinent to include the pathological reporting which already exists into novel integrative models. The novel prognostic index reported here returned a higher significance of high-risk patient identification than the sum of its parts. This study therefore demonstrates the value of systematic reporting incorporated into a novel prognostic index over the reporting of a single feature in isolation. Although image analysis will unlikely completely replace conventional histopathology it can be applied to standardize the quantification of certain histopathologic features and play a vital role in identifying novel prognostic and targetable parameters, such as poorly differentiated clusters, amenable to clinical translation and integration in order to address urgent clinical needs.
MATERIALS AND METHODS
Patient samples
Tissue samples were residual diagnostic tissue stored within the NHS Lothian Department of Pathology archive. The research was undertaken under the approval of the NHS Lothian NRS BioResource and ethical approval for the study (13/ES/0126) was granted by the East of Scotland Research Ethics Service.
Training set (n = 50): Twenty nine stage II patient samples were selected on colorectal specific death (15 survived follow up: good outcome and 14 died of disease: poor outcome) from a Scottish prospectively collected CRC cohort. Patient follow up was for at least 15 years. Thirteen stage I (12 with good outcome and 1 with poor outcome) and 8 stage III (all of whom died of disease) patients were randomly selected from the cohort for comparison. Patient samples were collected, after surgical resection, between the years of 1996 and 2003, from hospitals across Scotland. No patients within the training cohort underwent neoadjuvant or adjuvant therapy. Patient data is listed in Supplementary Table 2.
Validation set (n = 134): A separate validation set comprised all cases of stage II CRC treated in Edinburgh (Scotland) hospitals over 2 concurrent years (years 2002 and 2003), resulting in a cohort of 147 patients. Clinical follow up was up to 11.5 years. Due to insufficient available material 13 patients were excluded leaving a remaining 134 patients within the validation set; 20 of whom died of disease during the follow up period. Of the 134 patients tested within the validation set 9 rectal cancer patients underwent adjuvant therapy and 3 colon cancer patients under went adjuvant chemotherapy. Patient data is listed in Table 1.
Immunofluorescence and image capture
Samples were prepared for multiplexed immunofluorescence with DAPI (nuclei) and antibodies against pan-cytokeratin (epithelial cells) and D2-40 (lymphatic endothelium), as previously outlined [3]. Briefly, a 4 μm section was cut from a FFPE tissue block, deparaffinised and rehydrated. Microwave based antigen retrieval (Tris-EDTA, pH9 buffer), endogenous peroxidase (3% H202) and protein block (Dako, X0909) steps were undertaken prior to immunofluorescence. Immunofluorescence was performed using antibodies against wide specificity cytokeratin (pan-cytokeratin) (primary antibody: Dako, Z0622, 1:150; Alexa Fluor 555 secondary antibody: Thermo Fisher Scientific, A21428, 1:25) and lymphatic endothelium (D2-40, primary antibody: Dako, M3619, 1:2000; HRP labelled secondary antibody: Dako, K4001 and Cy5 Tyramide, Perkin Elmer, SAT705A001EA, 1:100). Tissue sections were counterstained in DAPI Prolong Anti-fade mountant (Thermo Fisher Scientific, P36931).
All images were captured on the HistoRx PM-2000 imaging platform (HistoRx Ltd., Branford, CT, USA). Whole slide images were captured with a 4x objective through the pan-cytokeratin (Alexa Fluor 555/Cy3) channel. For each tissue section, the invasive front was identified manually from the whole slide image and 15 high-resolution images were captured, in an evenly spaced distribution across the invasive front, through a 20x objective, with the following settings: DAPI (200 ms exposure), Cy3 (35 ms exposure) and Cy5 (200 ms exposure), thus visualizing nuclei, pan-cytokeratin (panCK) and lymphatics with D2-40 labelling respectively. All patient samples were treated in a standardized manner as described above. Images are exported from the PM- 2000 platform as .TIFF files at highest resolution. Each field of view is exported as three separate greyscale.TIFF files; one for each associated wavelength.
Image analysis
The novel image analysis algorithm was created within the Definiens image analysis software packages: Tissue Studio® and Developer XD™ (Definiens AG, Munich). Images were imported into Definiens as .TIFF files. Initial image segmentation utilized an image analysis algorithm created in Tissue Studio® as described previously [3]. All segmented objects were further classified within a hierarchical system where the top level was automatically segmented through machine-based learning using Definiens Composer Technology™ into Regions of Interest (ROIs): ‘tumor’, ‘necrosis/lumen’, ‘no tissue’ and ‘stroma’. Next, the object level of the image analysis hierarchy captured all panCK and D2-40 positive objects in the stroma. The final layer of image analysis identified nuclei through the DAPI channel. Each nucleus was exclusively segregated into relevant subpopulations existing in the analysis layers above. The Tissue Studio® analyzed workspace was subsequently imported into Developer XD™ for bespoke object classification, optimization and parameter export. A full description of the image analysis methods, with accompanying figures and settings for the Definiens’ rulesets are listed in Supplementary Document 2.
Multi-parametric data extraction
The algorithm quantified the total number of objects within each classification as well as extracting morphometric, spatial relationships, texture and fluorescence measurements from the objects across the segmented hierarchical image layers. The parameters captured from each of the 15 images taken per tissue section were either averaged or summed (depending on the nature of the parameter) to equate to one data-point per parameter per patient. In total 123 image-based parameters were extracted per tissue section and these made up the multi-parametric feature-set for each patient sample. A table containing the full list of the extracted parameters, and their collation method per patient sample, is located in Supplementary Table 1.
Statistical analysis
Optimal training set cut-offs
The unprocessed, continuous data for each candidate histopathologic feature (tumor budding, poorly differentiated clusters, lymphatic vessel invasion, minimal lymphatic vessel invasion, tumor to stroma ratio and lymphatic vessel density) alongside patient outcome data was loaded into X-Tile software [34] to calculate the optimal cut-offs to categorize patients into high or low risk of disease-specific death. The significance of these cut-offs were corrected by cross-validation within Monte-Carlo simulations (n = 1000). Training set cut-offs were subsequently applied to the validation set to categorize the stage II patient population.
Modelling to identify significant parameters
Principle Component Analysis and Cox regression calculations (univariate and multivariate backwards elimination with a stopping rule based on Aikaike´s Information Criteria) were performed in SPSS (IBM, New York, USA). From the 123 multi-parametric feature set the most informative features which differentiated between binary disease specific survival were identified by inputting the continuous data for each parameter into a random forest (n = 5000) decision tree model [26] and exporting the associated Gini score. The continuous data from each informative parameter was subsequently input into a classification and regression tree (CART) [27] decision tree strategy to identify optimal combinations of and clinical cut-offs of novel significant histopathologic features (Salford Predictive Miner, Salford Systems, San Diego, USA). To avoid over-fitting within the decision tree modelling, validation was performed during the decision tree modelling for both random forest (out of bag) and CART (10 fold self-test). Kaplan Meier curves and associated Benjamini-Hochberg false discovery rate corrected p values were calculated using TMA Navigator (http://www.tmanavigator.org) [35].
ACKNOWLEDGMENTS
We would like to acknowledge Frances Rae for securing ethics and patient follow-up data as well as John O’Connor for cutting the tissue sections.
CONFLICTS OF INTEREST
The authors declare that they have no conflicting interests.
FUNDING
Funding for the study was provided by the NHS Lothian Health Board.
REFERENCES
1. Beck AH, Sangoi AR, Leung S, Marinelli RJ, Nielsen TO, van de Vijver MJ, West RB, van de Rijn M, Koller D. Systematic analysis of breast cancer morphology uncovers stromal features associated with survival. Sci Transl Med. 2011; 3:108ra113.
2. Nawaz S, Heindl A, Koelble K, Yuan Y. Beyond immune density: critical role of spatial heterogeneity in estrogen receptor-negative breast cancer. Mod Pathol. 2015; 28:766–777.
3. Caie PD, Turnbull AK, Farrington SM, Oniscu A, Harrison DJ. Quantification of tumour budding, lymphatic vessel density and invasion through image analysis in colorectal cancer. J Transl Med. 2014; 12:156.
4. Ueno H, Mochizuki H, Akagi Y, Kusumi T, Yamada K, Ikegami M, Kawachi H, Kameoka S, Ohkura Y, Masaki T, Kushima R, Takahashi K, Ajioka Y, et al. Optimal Colorectal Cancer Staging Criteria in TNM Classification. J Clin Oncol. 2012.
5. Compton CC. Colorectal carcinoma: diagnostic, prognostic, and molecular features. Mod Pathol. 2003; 16:376–388.
6. Stoffel EM, Boland CR. Genetics and Genetic Testing in Hereditary Colorectal Cancer. Gastroenterology. 2015.
7. Nagtegaal ID, Quirke P, Schmoll HJ. Has the new TNM classification for colorectal cancer improved care? Nat Rev Clin Oncol.2012; 9:119–123.
8. Compton CC. Optimal pathologic staging: defining stage II disease. Clin Cancer Res. 2007; 13:6862s–6870s.
9. Morris EJ, Maughan NJ, Forman D, Quirke P. Who to treat with adjuvant therapy in Dukes B/stage II colorectal cancer? The need for high quality pathology. Gut. 2007; 56:1419–1425.
10. Jass JR, Love SB, Northover JM. A new prognostic classification of rectal cancer. Lancet. 1987; 1:1303–1306.
11. Ueno H, Hase K, Hashiguchi Y, Shimazaki H, Tanaka M, Miyake O, Masaki T, Shimada Y, Kinugasa Y, Mori Y, Kishimoto M, Kameoka S, Sato Y, et al. Site-specific tumor grading system in colorectal cancer: multicenter pathologic review of the value of quantifying poorly differentiated clusters. Am J Surg Pathol. 2014; 38:197–204.
12. Roxburgh CS, McMillan DC, Richards CH, Atwan M, Anderson JH, Harvey T, Horgan PG, Foulis AK. The clinical utility of the combination of T stage and venous invasion to predict survival in patients undergoing surgery for colorectal cancer. Ann Surg. 2014; 259:1156–1165.
13. Deans GT, Heatley M, Anderson N, Patterson CC, Rowlands BJ, Parks TG, Spence RA. Jass’ classification revisited. J Am Coll Surg. 1994; 179:11–17.
14. Puppa G, Senore C, Sheahan K, Vieth M, Lugli A, Zlobec I, Pecori S, Wang LM, Langner C, Mitomi H, Nakamura T, Watanabe M, Ueno H, et al. Diagnostic reproducibility of tumour budding in colorectal cancer: a multicentre, multinational study using virtual microscopy. Histopathology. 2012; 61:562–575.
15. Kingston EF, Goulding H, Bateman AC. Vascular invasion is underrecognized in colorectal cancer using conventional hematoxylin and eosin staining. Dis Colon Rectum. 2007; 50:1867–1872.
16. Lugli A, Karamitopoulou E, Zlobec I. Tumour budding: a promising parameter in colorectal cancer. Br J Cancer. 2012; 106:1713–1717.
17. Ueno H, Murphy J, Jass JR, Mochizuki H, Talbot IC. Tumour ‘budding’ as an index to estimate the potential of aggressiveness in rectal cancer. Histopathology. 2002; 40:127–132.
18. Kim JW, Shin MK, Kim BC. Clinicopathologic impacts of poorly differentiated cluster-based grading system in colorectal carcinoma. J Korean Med Sc. 2015; 30:16–23.
19. Barresi V, Reggiani Bonetti L, Vitarelli E, Di Gregorio C, Ponz de Leon M, Barresi G. Immunohistochemical assessment of lymphovascular invasion in stage I colorectal carcinoma: prognostic relevance and correlation with nodal micrometastases. Am J Surg Pathol. 2012; 36:66–72.
20. Matsumoto K, Nakayama Y, Inoue Y, Minagawa N, Katsuki T, Shibao K, Tsurudome Y, Hirata K, Nagata N, Itoh H. Lymphatic microvessel density is an independent prognostic factor in colorectal cancer. Dis Colon Rectum. 2007; 50:308–314.
21. Cacchi C, Arnholdt HM, Jahnig H, Anthuber M, Probst A, Oruzio DV, Markl B. Clinical significance of lymph vessel density in T3 colorectal carcinoma. Int J Colorectal Dis. 2012; 27:721–726.
22. Huijbers A, Tollenaar RA, v Pelt GW, Zeestraten EC, Dutton S, McConkey CC, Domingo E, Smit VT, Midgley R, Warren BF, Johnstone EC, Kerr DJ, Mesker WE. The proportion of tumor-stroma as a strong prognosticator for stage II and III colon cancer patients: validation in the VICTOR trial. Ann Oncol. 2013; 24:179–185.
23. Park JH, Richards CH, McMillan DC, Horgan PG, Roxburgh CS. The relationship between tumour stroma percentage, the tumour microenvironment and survival in patients with primary operable colorectal cancer. Ann Oncol. 2014; 25:644–651.
24. Royston P, Altman DG, Sauerbrei W. Dichotomizing continuous predictors in multiple regression: a bad idea. Stat Med. 2006; 25:127–141.
25. Angell HK, Gray N, Womack C, Pritchard DI, Wilkinson RW, Cumberbatch M. Digital pattern recognition-based image analysis quantifies immune infiltrates in distinct tissue regions of colorectal cancer and identifies a metastatic phenotype. Br J Cancer. 2013; 109:1618–1624.
26. Breiman L. Random forests. Machine learning. 2001; 45:5–32.
27. Chou PA. Optimal partitioning for classification and regression trees. IEEE Trans Pattern Anal Mach Intell. 1991; 340–354.
28. Ueno H, Kajiwara Y, Shimazaki H, Shinto E, Hashiguchi Y, Nakanishi K, Maekawa K, Katsurada Y, Nakamura T, Mochizuki H, Yamamoto J, Hase K. New criteria for histologic grading of colorectal cancer. Am J Surg Pathol. 2012; 36:193–201.
29. Brachtel E, Yagi Y. Digital imaging in pathology—current applications and challenges. J Biophotonics. 2012; 5:327–335.
30. Kopetz S, Tabernero J, Rosenberg R, Jiang ZQ, Moreno V, Bachleitner-Hofmann T, Lanza G, Stork-Sloots L, Maru D, Simon I, Capella G, Salazar R. Genomic Classifier ColoPrint Predicts Recurrence in Stage II Colorectal Cancer Patients More Accurately Than Clinical Factors. The oncologist. 2015; 20:127–133.
31. Yuan Y. Modelling the spatial heterogeneity and molecular correlates of lymphocytic infiltration in triple-negative breast cancer. J R Soc Interface. 2015; 12.
32. Maurice B Loughrey PQ, Neil A Shepherd. Final Standards and datasets for reporting cancers. Dataset for colorectal cancer histopathology reports July 2014.
33. Quirke P, Williams GT, Ectors N, Ensari A, Piard F, Nagtegaal I. The future of the TNM staging system in colorectal cancer: time for a debate? The Lancet Oncology. 2007; 8:651–657.
34. Camp RL, Dolled-Filhart M, Rimm DL. X-tile: a new bio-informatics tool for biomarker assessment and outcome-based cut-point optimization. Clin Cancer Res. 2004; 10:7252–7259.
35. Lubbock AL, Katz E, Harrison DJ, Overton IM. TMA Navigator: Network inference, patient stratification and survival analysis with tissue microarray data. Nucleic Acids Res. 2013; 41:W562–568.