
INTRODUCTION
Hypoxia is widely recognized as an important factor boosting aggressiveness in many kinds of cancers, including glioblastoma (GBM) [1–5]. Clinical and experimental investigations demonstrated that hypoxia promotes GBM progression [1, 6, 7], contributes to the maintenance of stem like cells (glioma stem like cells, GSCs) [3, 5] and activates angiogenesis and vascular mimicry, including trans-differentiation of GSCs into endothelial cells [2, 4, 8]. GSCs are suggested to be the driving force behind GBM growth and progression [9, 10], and hypoxia promotes GSC maintenance by inducing a cohort of important genes such as hypoxia inducible factors (HIFs, including HIF1α and HIF2α) [5, 11], mesenchymal markers [6, 7], ZNF217 [12], CDH5 [2] and others. However, the significance of hypoxia for GBM growth, and the mechanisms underlining hypoxia-induced GBM tumorigenesis are not yet fully understood.
Hypoxia-inducible protein 2 (HIG2), also known as HILPDA (hypoxia inducible lipid droplet associated), was identified as a hypoxia-induced gene in several tissues and cancers [13]. HIG2 is a potential diagnostic marker for renal cell carcinoma and a promising target for molecular therapy [14]. HIG2 potentiated WNT pathway and lipid metabolism activation [14], both of which are important for glioma tumorigenesis [15, 16]. In addition, HIG2 can promote tumor cell growth by inhibiting apoptosis [13]. However, the expression patterns and biological significance of HIG2 in gliomas is not fully explored. Given the importance of hypoxia in tumorigenesis and that HIG2 is a specific hypoxia-induced gene, we investigated HIG2 expression and evaluated its significance and biological function in GBM.
RESULTS
HIG2 is overexpressed in gliomas and is correlated with tumor grade
We first examined HIG2 mRNA levels by qPCR in a cohort of glioma samples, including 14 grade II astrocytomas (A), 15 grade III anaplastic astrocytomas (AA), 31 grade IV GBMs and 5 normal brain samples. HIG2 levels were increased in grade II-IV gliomas (P<0.05) compared with normal tissues, and were higher in grade IV GBMs than in lower grade gliomas and normal tissues (P<0.05, Figure 1A). In addition, HIG2 was more highly expressed in the mesenchymal subtype as revealed by TCGA data analysis (Figure S1). We examined HIG2 protein levels by western blot in two normal brain, five A, five AA and five GBM samples. HIG2 was consistently more highly expressed in glioma tissues than in normal brain tissues, especially in GBMs (Figure 1B).
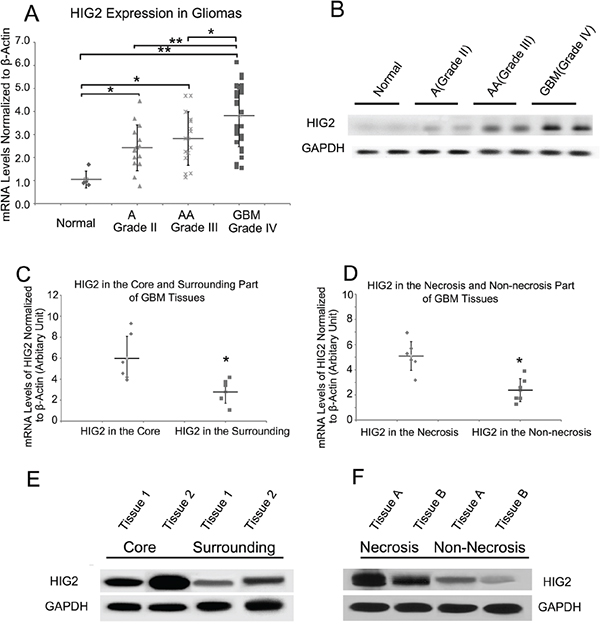
Figure 1: HIG2 expression is elevated in gliomas as compared to normal brain tissue, and is more highly expressed in the tumor core and in necrotic regions. qPCR analysis of HIG2 expression in normal brain tissues, astrocytomas (A), anaplastic astrocytomas (AA) and GBMs A. Representative western blots showing HIG2 is more highly expressed in GBMs than in normal and low-grade glioma tissues B. qPCR and western blot analyses revealed that HIG2 is more highly expressed in the core GBM tumor C & E. and necrotic areas D & F. β-Actin and GAPDH were used as loading controls for qPCR and western blotting, respectively. *P<0.05, **P<0.001.
We performed a multivariate analysis to evaluate possible factors influencing HIG2 expression, including age at diagnosis, gender, tumor grade and KPS (Karnofsky performance status), using the REMBRANDT (Repository of Molecular Brain Neoplasia Data) database of the National Cancer Institute (NCI; http://caintegrator-info.nci.nih.gov/rembrant). We found that tumor grade was an independent factor associated with HIG2 levels (P<0.001, Table S1). These results demonstrated that HIG2 was highly expressed in gliomas and its expression increases with tumor grade.
HIG2 is highly expressed in the GBM tumor core and palisading site
Immunohistochemistry (IHC) in GBM tissues revealed greater HIG2 staining in necrotic and palisading areas, where hypoxia is induced during tumor growth (Figure S2). Core tumor tissues and adjacent normal tissues, along with necrotic and non-necrotic tissues, were obtained during patient surgeries. qPCR and western blot analyses showed higher HIG2 levels in the core part of the tumor and necrotic areas (Figure 1C–1F), consistent with IHC results, indicating HIG2 was upregulated under hypoxic conditions.
HIG2 promotes proliferation and invasion in GBM cell lines and GSCs
We examined HIG2 expression in GBM cell lines, including traditional serum-cultured cell lines (TSCCs, including U87, U251 and A172) and GSC cell lines, with normal NSC and astrocyte cell lines as controls. Consistent with results from glioma tissues, HIG2 was more highly expressed in both TSCC and GSC cell lines compared to normal NSC and astrocyte cells as shown by qPCR and western blot (Figure 2A–2C; P<0.05). We then used shRNA lentiviruses to knock down HIG2 in U87 and GSC5 cells. HIG2 knockdown was confirmed by qPCR (downregulated by 74% and 81% in U87 and GSC5 cells, respectively) and western blot (Figure S3). Growth curve analyses showed that HIG2 knockdown inhibited U87 and GSC5 cell proliferation (Figure 2D). Knockdown also inhibited cell invasion as measured by transwell invasion assays (Figure 2E–2F) and increased U87 cell apoptosis frequency as revealed by Annexin V/PI flow cytometry (Figure S4).
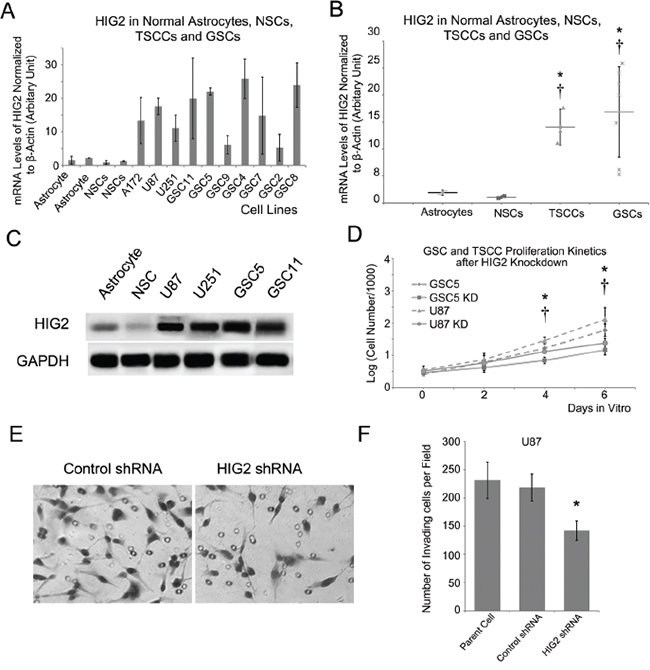
Figure 2: HIG2 is highly expressed in GBM cell lines and promotes GBM cell proliferation and invasion. HIG2 is overexpressed in GBM cell lines, including TSCCs and GSCs, compared to normal astrocytes (*P<0.05) and NSCs (†P<0.05) A & B. Representative western blots showing HIG2 in TSCCs and GSCs, but little-to-no detection in astrocytes and NSCs C. (D) HIG2 knockdown inhibited GSC proliferation in U87 (*P<0.05) and GSC cells (†P<0.05) D. Transwell invasion assay showing that HIG2 knockdown inhibited U87 cell invasiveness E & F.
Hypoxia and hypoxia mimics upregulate HIG2
GSC and TSCC GBM cell lines were cultured under hypoxic (1% O2) or normoxic (20% O2) conditions for 24 h. Hypoxia increased HIG2 levels 1.6-5.8 fold in GSC and TSCC cell lines (Figure 3A–3C). However, HIG2 was not upregulated in NSC cells, indicating the hypoxia-induced HIG2 upregulation is tumor specific. In addition, treatment of GSC and TSCC cells with the hypoxia mimics, deferoxamine (DFO) and cobalt chloride (CoCl2), also increased HIG2 levels (Figure 3D). Hypoxia- or hypoxia mimic-induced HIG2 upregulation can be blocked by inhibitors of hypoxia-induced genes, such as echinomycin or polyamide (Figure 3E–3F). HIG2 knockdown also inhibited GBM cell growth and invasiveness under hypoxic conditions (Figure S5–S6).
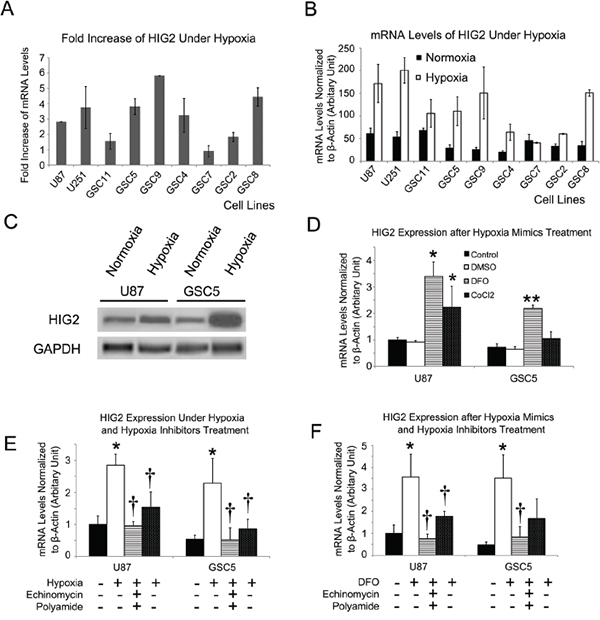
Figure 3: HIG2 is increased under hypoxia in TSCCs and GSCs. HIG2 fold-increase and relative mRNA levels in TSCCs and GSCs after exposure to hypoxia for 24 h A & B. Representative western blots showing increased HIG2 under 1% O2 hypoxic conditions for 24 h in TSCCs and GSCs C. HIG2 mRNA was increased after treatment with hypoxia mimics (DFO and CoCl2) D. *P<0.05 and **P<0.05 compared to DMSO-treated groups. Hypoxia inhibitors echinomycin or polyamide inhibited HIG2 expression induced by hypoxia or hypoxia mimics E & F. *P<0.05 compared to control group; †P<0.05 compared to hypoxia or hypoxia mimics.
HIG2 and HIFs upregulate one another under hypoxic conditions
Hypoxia inducible factors (HIFs, mainly including HIF1α and HIF2α) are important activators of hypoxia-induced phenotypic effects [2, 3, 6, 7]. We examined whether HIFs affect HIG2 expression. First, shRNA lentiviruses were used to knockdown HIF1α or HIF2α in GSCs and TSCCs. HIF1α knockdown decreased HIG2 expression in both TSCCs and GSC cells (Figure 4A–4B), while HIF2α knockdown reduced HIG2 expression in GSC, but not U87 and U251 cells (Figure 4A). These differential effects are likely due to the specific expression of HIF2α in GSCs [2, 5].
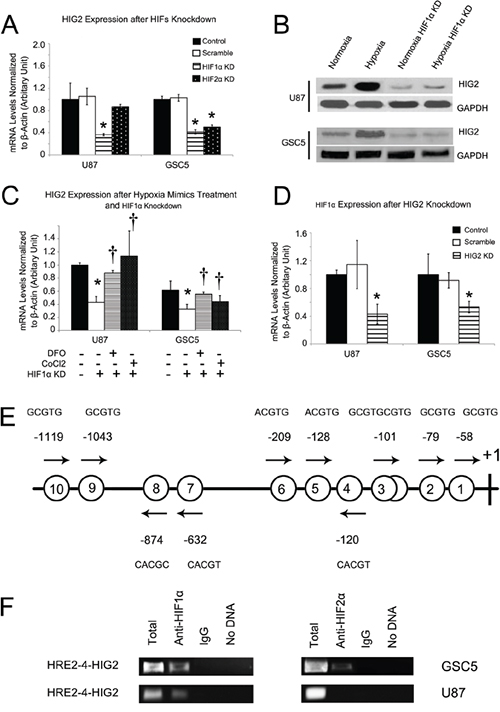
Figure 4: HIFs regulate HIG2 expression, and HIG2 regulates HIF1α. HIG2 was inhibited after HIF1α knockdown in both TSCCs and GSCs and also after HIF2α knockdown in TSCs A. Western blot showing HIG2 upregulation under hypoxia conditions and downregulation with HIF1α inhibition B. HIF1α knockdown also inhibited HIG2 upregulation induced by hypoxia mimics C. †P<0.05 compared to hypoxia mimics. HIF1α was downregulated after HIG2 knockdown in both TSCCs and GSCs D. Location of putative hypoxia response elements (HRE) in the -1190/+133 HIG2 gene promoter E. Putative HREs are represented by circled numbers and sequences are displayed. ChIP using HIF1α or HIF2α antibodies and the primer spanning the 1st to 6th HREs in the HIG2 promoter F. *P<0.05 compared to control group.
HIF1α knockdown also attenuated HIG2 expression in GSC and TSCC cells under hypoxic conditions (Figure S7A). HIF2α knockdown consistently reduced HIG2 expression fold increase in GSC, but not TSCC cells under hypoxic conditions (Figure S7A). In addition, HIF1α knockdown inhibited HIG2 upregulation induced by the hypoxia mimics, DFO and CoCl2 (Figure 4C).
HIG2 knockdown in TSCCs and GSCs also reduced HIF1α expression (Figure 4D) and attenuated its fold increase under hypoxic conditions (Figure S7B), indicating a positive feedback relationship between HIG2 and HIFs during hypoxia.
HIFs directly interact with the HIG2 promoter in GBM cells
As transcriptional factors, HIFs regulate gene expression by binding to promoters, and were reported to bind to putative hypoxia response elements (HREs; RCGTG, R=A or G) [17]. The -1190/+133 HIG2 promoter region contains 10 putative HRE elements, including 9 single sites (HRE1, –58; HRE2, –79; HRE4, -120; HRE5, -128; HRE6, -209; HRE7, -632; HRE8, -874; HRE9, -1043; HRE10, -1119) and one head-to-head tandem (HRE3; –101/–93, Figure 4E), suggesting that HIFs may directly activate HIG2 transcription. We performed ChIP to investigate whether HIFs directly bind to the HIG2 promoter in GBM cells. HIF1α reportedly binds to the proximal HIG2 promoter [18]. Primers were designed spanning the 1st to 6th HREs (HRE1 to HER6, HER1-6-HIG2) in the HIG2 promoter region, and PCR was performed with GSC5 and U87 cell nuclear extracts after immunoprecipitation with anti-HIF antibodies. Both HIF1α and HIF2α bound to the HER1-6-HIG2 region in these cells (Figure 4F). However, for serum cultured U87 cells, the HER1-6-HIG2 region was bound by HIF1α, but not HIF2α. The difference may be due to the specific expression of HIF2α in GSCs [5]. These results demonstrated that both HIF1α and HIF2α upregulated HIG2 expression by directly binding the HIG2 promoter in GBM cells.
High HIG2 expression predicts poor GBM patient prognosis
The REMBRANDT database was used to investigate whether HIG2 might have therapeutic benefits for glioma patients. Survival of glioma patients with intermediate, low or high HIG2 levels was analyzed. No patient showed more than two-fold HIG2 downregulation, and almost half of the patients showed more than two-fold upregulation. Patients with elevated HIG2 expression had a decreased probability of survival compared to patients with intermediate HIG2 levels (P<0.001, Figure 5A). To exclude the influence of tumor grade on the survival analysis, we analyzed GBM patient survival. HIG2 levels and decreased patient survival were correlated (P<0.05, Figure 5B). Analysis of the TCGA database further confirmed that elevated HIG2 mRNA was negatively associated with overall survival (P<0.001, Figure 5C) and disease free survival (P=0.050043, Figure 5D) in GBM patients.
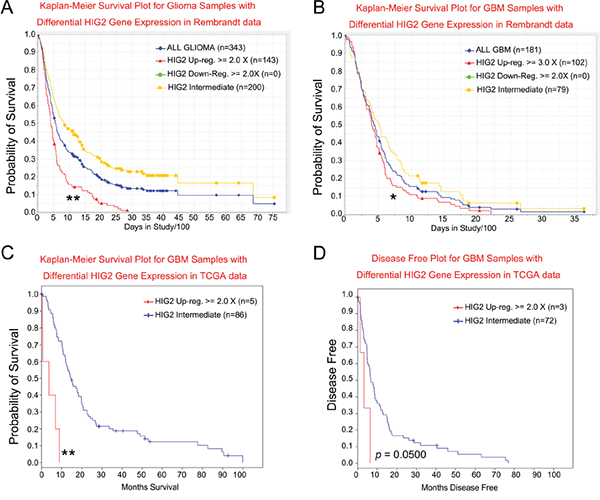
Figure 5: HIG2 level correlates with patient survival for all glioma A. and GBM patients B. in the NCI Rembrandt database. HIG2 levels correlate with overall C. and disease-free survival D. for GBM patients in TCGA database. *P<0.05, **P<0.001 for HIG2 high vs intermediate.
We then performed a multivariate Cox regression analysis for prognostic factors that may influence GBM patient survival, including HIG2 expression, age at diagnosis, gender, KPS, extent of resection and temozolomide chemotherapy. We found that HIG2 expression was an independent predictive variable for shortened survival in all glioma (P<0.05, Table S2) and GBM patients (P<0.05, Table S3).
HIG2 is closely correlated with angiogenesis genes in GBM
We used the ARACNe algorithm to assemble a genome-wide list of HIG2-specific transcriptional interactions based on information between pairwise genes [2, 19–22]. Three datasets from independent groups were used to identify candidate HIG2-interacting genes: TCGA [23, 24], the unified validation database from Verhaak, et al. [24], and the high grade glioma dataset from Gravendeel, et al. [25]. Next, DPI with a tolerance of 20% was performed to screen genes that potentially interacted with HIG2 directly (directly interacting genes (DIGs) of HIG2) [20]. Our analyses produced three DIG sets from the above databases. Genes present in all three DIG sets were considered the most likely to interact with HIG2. This included 10 genes (sorted by coefficient with HIG2): ADM, VEGFA, ANGPTL4, SLC39A14, PLOD2, BNIP3L, SPAG4, EGLN3, ADFP and NRN1 (Figure 6A). Notably, most of the genes are involved in angiogenesis in GBM and are promising therapeutic targets, especially VEGFA. Because targeted therapies against VEGF are important GBM treatment strategies [6, 26, 27], we explored the relationship between HIG2 and VEGFA.
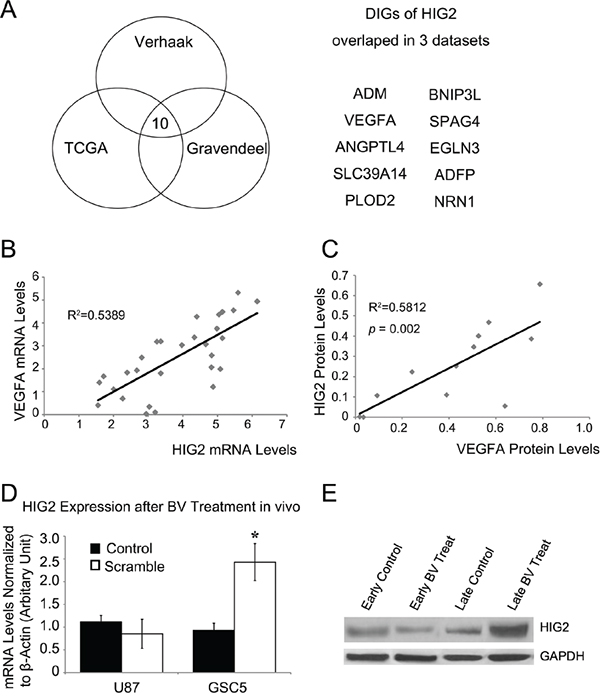
Figure 6: HIG2 is correlated with VEGFA and is upregulated after anti-VEGF treatment. Bioinformatics analyses from 3 datasets revealed putative direct-interacting genes (DIGs) for HIG2 A. Correlation analysis of HIG2 and VEGFA expression in GBM samples by qPCR (P<0.05) B. HIG2 and VEGFA western blot signal intensities relative to GAPDH were quantified by densitometry and correlation analysis, showing that HIG2 is correlated with VEGFA (P<0.05) C. HIG2 mRNA and protein levels in intracranial U87 xenograft tumors at early or late stages D & E. *P<0.05 compared to control.
HIG2 and VEGF expression are correlated and contribute to bevacizumab resistance in GBM
Angiogenesis is an important mechanism that sustains GBM tumor growth, and VEGFA is a key angiogenesis regulator [28–30]. bevacizumab (Avastin®, Genentech, Inc., San Francisco, CA, USA), a humanized monoclonal antibody against VEGFA, is currently the most promising GBM adjuvant therapy [26, 31]. Association analysis revealed a positive correlation between HIG2 and VEGFA levels in GBM samples (P<0.05, Figure 6B–6C & S8).
Resistance to anti-VEGF therapies has been a critical problem in clinical practice [32, 33]. Because VEGFA is a key regulator of the HIG2-DIGs pathway, we explored the effect of bevacizumab on HIG2 expression in U87 implanted nude mice xenografts. HIG2 was downregulated at early stages (2 weeks after treatment) during bevacizumab treatment (Figure 6D–6E). However, at late stages (when mice developed signs and symptoms of advanced tumor growth; about 3–4 weeks for control mice and 5–7 weeks for bevacizumab-treated mice), tumors progressed and HIG2 expression was upregulated (Figure 6D–6E). These results indicated that HIG2 is induced during the late stages of anti-VEGF treatment.
DISCUSSION
Key features in GBM tumorigenesis include invasion and angiogenesis [34]. Tumor cell growth also induces necrosis in the tumor core, resulting in a hypoxic microenvironment [35]. Hypoxia triggers a series of molecular effects, including angiogenesis, blood vessel mimicry, tumor cell motility and invasion, mesenchymal transformation and maintenance of stem like cells [2, 5, 35]. Bevacizumab therapy can alleviate clinical symptoms, but ultimately promotes tumor aggression, due at least partially to hypoxia caused by decreased blood vessel growth [32]. These results indicate that hypoxia enhances GBM malignancy. Therefore, exploring hypoxia activated pathways is important for identifying effective therapeutic strategies. Many hypoxia-induced genes are known, such as HIFs, VEGFA, ADM and others. Among these, HIFs are considered most important and have been widely studied [2, 3, 5, 7]]. However, effective therapeutic strategies have not yet been developed to target hypoxia-induced tumorigenesis.
HIG2 was first described as a hypoxia-induced gene and was later shown to be involved in lipid droplet metabolism and WNT signaling [18, 36]. HIG2 is highly expressed in several malignant tumors, including ovarian cancer [37], cervical cancer [36], head-and-neck squamous cell carcinomas [38], renal cell carcinoma [14, 18, 37, 39]], lymphoma [40] and colorectal cancer [13], and was shown to be induced by hypoxia [13, 18, 41]. Given that hypoxia is an important contributor in glioma tumorigenesis, we studied the significance of HIG2 expression in these tumors. HIG2 was upregulated by HIFs through transcriptional activation under conditions of hypoxia. We showed that HIG2 is highly expressed in gliomas and is correlated with tumor grade. In addition, HIG2 overexpression independently predicts poor prognosis for both glioma and GBM patients. HIG2 is a thus marker for high tumor grade and poor prognosis. HIG2 expression also contributes to GBM cell proliferation and invasiveness, and is a promising therapeutic target to inhibit GBM growth.
Although HIG2 has been studied in several tissues, its biological role is not clear. We demonstrated that HIG2 is closely correlated with ADM, VEGFA and other angiogenesis-related genes via bioinformatics analyses, indicating HIG2 may play a role in GBM angiogenesis, which is a hallmark of GBM [34]. Anti-angiogenesis agent, bevacizumab, was recently approved to treat GBM [27]. However, bevacizumab almost invariably induced drug resistance and tumor progression. As one key point in the angiogenesis- related molecular network, VEGFA inhibition may trigger activation of other genes to compensate for the blockade by several mechanisms. For example, anti-angiogenesis-induced blood vessel regression and subsequent hypoxia [42, 43] can promote GBM progression [32, 33]. We analyzed the effect of bevacizumab treatment on HIG2 expression and showed that HIG2 and VEGFA levels are positively correlated in GBM. Interestingly, HIG2 expression was downregulated in tumor xenografts at early stages following bevacizumab treatment, while at late stages, HIG2 was upregulated. This compensative HIG2 induction after bevacizumab treatment was probably induced by hypoxia, because we also observed upregulation of HIF1α, CA12, VEGFA (data not shown) and other hypoxia indicators. HIG2 upregulation may contribute to bevacizumab resistance by inhibiting apoptosis, promoting lipid biosynthesis and stimulating the WNT signal pathway [14, 16, 44]. In addition, given the positive correlation between HIG2 and VEGFA expression and that HIG2 increased HIF1α expression, HIG2 may upregulate VEGFA expression thus promoting angiogenesis and ultimately bevacizumab resistance.
Our results suggest that HIG2 is a promising novel therapeutic target for GBM, especially for overcoming resistance to bevacizumab treatment. HIG2 may exert tumorigenic roles by activating the WNT pathway or lipid droplet metabolism [18]. However, the exact roles of HIG2 in bevacizumab resistance and the therapeutic effects of HIG2 inhibition require further study. It will be important to evaluate the therapeutic effects of bevacizumab treatment combined with HIG2 inhibition. Further exploration of the mechanisms of HIG2-induced tumor progression will provide novel therapeutic targets for GBM.
MATERIALS AND METHODS
Glioma samples
Brain tumor samples were obtained as reported previously [2, 12] and were used for quantitative RT-PCR (qPCR), western blot and IHC (Supplementary Materials and Methods). Core tumor and surrounding tissues were obtained from patients who underwent total tumor resection. Core GBM tissues were harvested from the bulk of the tumor and surrounding tissues were harvested 1–3 cm from the tumor border. Necrotic tumor tissues were harvested from patients with obvious necrosis, and non-necrotic tissues were harvested from the same patients far from the necrotic area. Tissues used for qPCR and western blots were frozen and stored at −80°C immediately after surgery. Informed consent was obtained from each patient and experiments were approved by the local ethics committee.
Culture of primary GSCs and NSCs
Primary GSCs, human glioblastoma U251MG and U87MG cells (U251 and U87) and normal human NSCs were cultured as described previously [2, 12] (Supplementary Materials and Methods). The study protocol was approved by the Institutional Review Committee (IRB) of Xijing Hospital of the Fourth Military Medical University and written informed consent was obtained from patients. To induce hypoxia, cells were cultured in a sealed Modular Incubator Chamber (Billups-Rothenberg Inc., Del Mar, CA) flushed with 1% O2, 5% CO2 and 94% N2 at 37°C for 24 h. To evaluate tumor cell apoptosis rate and invasion potential, Annexin V-propidium iodide (PI) flow cytometry and transwell invasion assays were performed as described previously (Supplementary Materials and Methods) [45].
Quantitative real-time PCR
RNA was extracted from cultured cells and brain tumor tissues using Trizol Reagent (Invitrogen). Extracted RNA was reverse transcribed into cDNA and qPCR analysis was performed on an ABI7700 system using SYBR Green PCR Core Reagents in 20 μL reactions (Applied Biosystems, Warrington, UK). Water instead of template was used as the negative control. Primers used for qPCR analysis are listed in Table S4. All samples were assayed in triplicate and the relative amount of target transcripts normalized to the number of human β-actin transcripts in the same sample. Specificity was verified by melting curve analysis and agarose gel electrophoresis. Relative fold changes were calculated using the ΔΔCt method with the threshold cycle values of each sample.
Western blotting
Western bots were performed as described previously [2] (Supplementary Materials and Methods). All analyses were done in duplicate. Results were scanned and quantified using ImageJ software, and target protein levels were normalized to GAPDH.
Immunohistochemistry
Paraffin embedded, 1-μm formalin fixed tissue sections were mounted on microscope slides and processed as previously described [2, 9, 45]. Tissue sections were stained using anti-human HIG2 (1:100; Santa Cruz Biotechnology). Sections were treated with a heat-induced epitope retrieval technique using a citrate buffer at pH 6.0. Then sections were blocked for endogenous peroxidase and biotin before incubation with primary antibodies for 3 h at room temperature. The Elite Vector Stain ABC System (Vector Laboratories, Burlingham, CA) was used for detection with diaminobenzidine (DAB) as the chromogen. Nuclei were counterstained with haematoxylin.
Intracranial xenograft tumors
Intracranial xenograft experiments were performed as described previously. Briefly, 5x10⁵ cells were resuspended in 10 μl of phosphate buffered saline (PBS) and stereotactically injected into the right striatums of nude mice brains (6–8 weeks old; n = 6 each; Center of Experimental Animals, Fourth Military Medical University, Xian, China), following administration of general anaesthesia. Coordinates for stereotactical injections were 2 mm to the right of the midline, 0.5 mm anterior to the coronal suture and 3 mm deep. For treatment experiments, bevacizumab (Avastin; Roche/Genentech) (10 mg/kg) or vehicle was administered by intraperitoneal injection twice a week. For short-term early studies, mice were treated for 4 weeks; for long-term studies, mice were treated until they developed signs and symptoms of advanced tumor growth. At the final time point of short- and long-term studies, mice were euthanized with CO2 in accordance with animal welfare guidelines, after which brains were removed and processed for analysis. All animal experiments were in strict accordance with the Animal Experiments guidelines in force at the Fourth Military Medical University.
ARACNe network reconstruction and informatics analysis
ARACNe (Algorithm for the Reconstruction of Accurate Cellular Networks), an information-theoretic algorithm for inferring transcriptional interactions [20], was used to identify a repertoire of candidate transcriptional regulators of interesting genes, as described previously [2, 21, 22] (Supplementary Materials and Methods). Three datasets were used for expression profile analysis: TCGA [23, 24], a unified validation dataset form Verhaak, et al. [24] and a high grade glioma dataset from Gravendeel, et al. [25].
shRNA infection
shRNA lentivirus particles targeting HIF1α, HIF2α and HIG2 and a scramble non-targeting shRNA were purchased from Sigma. Cells were infected with shRNA lentiviruses according to the manufacturer’s protocol. Briefly, GSCs and U87 cells were dissociated into single cells with Accutase and gentle trituration, and then incubated with lentivirus for 24 h. After approximately 48 h, 2 ug/ml puromycin was used to select infected cells.
Chromatin immunoprecipitation (ChIP)
ChIP was performed as described [2, 46]. Cultured cell lysates were precleared with Protein A/G beads (Santa Cruz) and incubated at 4°C overnight with 1 μg of polyclonal antibody specific for HIF1α (Santa Cruz), HIF2α (Novus), or normal rabbit immunoglobulins (Santa Cruz). DNA was eluted in 200 μl of water and 1 μl was analyzed by PCR. Primers used for ChIP PCR analysis were as follows: forward: 5’-TACAGCAGAGATGGCAGTCG-3’, reverse: 5’- CACAAAACTCACCGGAGACA-3’.
Statistical analysis
Statistical analyses were performed using Student’s t-tests and one-way analysis of variance (ANOVA) with least squared difference post hoc tests as appropriate. All P values are 2-tailed. P<0.05 was considered statistically significant. Statistical analyses were done using SPSS v.13.0.0 (SPSS, Inc., Chicago, IL).
CONFLICTS OF INTEREST
The authors declare no conflicts of interest.
GRANT SUPPORT
This study was partially supported by the National Natural Science Foundation of China (81502143, 81402975, 81302174) and the Promotion Program by Xijing Hospital (XJZT14M12, XJZT15D18). This project was sponsored by Undergraduate Research & Creative Projects at the Experimental Teaching Center of Basic Medicine, Fourth Military Medical University.
REFERENCES
1. Thiepold AL, Luger S, Wagner M, Filmann N, Ronellenfitsch MW, Harter PN, Braczynski AK, Dutzmann S, Hattingen E, Steinbach JP, Senft C, Rieger J, Bahr O. Perioperative cerebral ischemia promote infiltrative recurrence in glioblastoma. Oncotarget. 2015; 6:14537-14544. doi: 10.18632/oncotarget.3994.
2. Mao XG, Xue XY, Wang L, Zhang X, Yan M, Tu YY, Lin W, Jiang XF, Ren HG, Zhang W, Song SJ. CDH5 is specifically activated in glioblastoma stem like cells and contributes to vasculogenic mimicry induced by hypoxia. Neuro Oncol. 2013; 15:865–879.
3. Bar EE, Lin A, Mahairaki V, Matsui W, Eberhart CG. Hypoxia increases the expression of stem-cell markers and promotes clonogenicity in glioblastoma neurospheres. Am J Pathol. 2010; 177:1491-1502.
4. Seidel S, Garvalov BK, Wirta V, von Stechow L, Schanzer A, Meletis K, Wolter M, Sommerlad D, Henze AT, Nister M, Reifenberger G, Lundeberg J, Frisen J, Acker T. A hypoxic niche regulates glioblastoma stem cells through hypoxia inducible factor 2 alpha. Brain. 2010; 133:983-995.
5. Li Z, Bao S, Wu Q, Wang H, Eyler C, Sathornsumetee S, Shi Q, Cao Y, Lathia J, McLendon RE, Hjelmeland AB, Rich JN. Hypoxia-inducible factors regulate tumorigenic capacity of glioma stem cells. Cancer Cell. 2009; 15:501-513.
6. Xu H, Rahimpour S, Nesvick CL, Zhang X, Ma J, Zhang M, Zhang G, Wang L, Yang C, Hong CS, Germanwala AV, Elder JB, Ray-Chaudhury A, Yao Y, Gilbert MR, Lonser RR, et al. Activation of hypoxia signaling induces phenotypic transformation of glioma cells: implications for bevacizumab antiangiogenic therapy. Oncotarget. 2015; 6:11882-11893. doi: 10.18632/oncotarget.3592.
7. Joseph JV, Conroy S, Pavlov K, Sontakke P, Tomar T, Eggens-Meijer E, Balasubramaniyan V, Wagemakers M, den Dunnen WF, Kruyt FA. Hypoxia enhances migration and invasion in glioblastoma by promoting a mesenchymal shift mediated by the HIF1alpha-ZEB1 axis. Cancer Lett. 2015; 359:107-116.
8. Soda Y, Marumoto T, Friedmann-Morvinski D, Soda M, Liu F, Michiue H, Pastorino S, Yang M, Hoffman RM, Kesari S, Verma IM. Transdifferentiation of glioblastoma cells into vascular endothelial cells. Proc Natl Acad Sci U S A. 2011; 108:4274-4280.
9. Mao XG, Zhang X, Xue XY, Guo G, Wang P, Zhang W, Fei Z, Zhen HN, You SW, Yang H. Brain Tumor Stem-Like Cells Identified by Neural Stem Cell Marker CD15. Transl Oncol. 2009; 2:247-257.
10. Chen R, Nishimura MC, Bumbaca SM, Kharbanda S, Forrest WF, Kasman IM, Greve JM, Soriano RH, Gilmour LL, Rivers CS, Modrusan Z, Nacu S, Guerrero S, Edgar KA, Wallin JJ, Lamszus K, et al. A hierarchy of self-renewing tumor-initiating cell types in glioblastoma. Cancer Cell. 2010; 17:362-375.
11. Soeda A, Park M, Lee D, Mintz A, Androutsellis-Theotokis A, McKay RD, Engh J, Iwama T, Kunisada T, Kassam AB, Pollack IF, Park DM. Hypoxia promotes expansion of the CD133-positive glioma stem cells through activation of HIF-1alpha. Oncogene. 2009; 28:3949-3959.
12. Mao XG, Yan M, Xue XY, Zhang X, Ren HG, Guo G, Wang P, Zhang W, Huo JL. Overexpression of ZNF217 in glioblastoma contributes to the maintenance of glioma stem cells regulated by hypoxia-inducible factors. Lab Invest. 2011; 91:1068-1078.
13. Kim SH, Wang D, Park YY, Katoh H, Margalit O, Sheffer M, Wu H, Holla VR, Lee JS, DuBois RN. HIG2 promotes colorectal cancer progression via hypoxia-dependent and independent pathways. Cancer Lett. 2013; 341:159-165.
14. Togashi A, Katagiri T, Ashida S, Fujioka T, Maruyama O, Wakumoto Y, Sakamoto Y, Fujime M, Kawachi Y, Shuin T, Nakamura Y. Hypoxia-inducible protein 2 (HIG2), a novel diagnostic marker for renal cell carcinoma and potential target for molecular therapy. Cancer Res. 2005; 65:4817-4826.
15. Zhu X, Morales FC, Agarwal NK, Dogruluk T, Gagea M, Georgescu MM. Moesin is a glioma progression marker that induces proliferation and Wnt/beta-catenin pathway activation via interaction with CD44. Cancer Res. 2013; 73:1142-1155.
16. Lewis CA, Brault C, Peck B, Bensaad K, Griffiths B, Mitter R, Chakravarty P, East P, Dankworth B, Alibhai D, Harris AL, Schulze A. SREBP maintains lipid biosynthesis and viability of cancer cells under lipid- and oxygen-deprived conditions and defines a gene signature associated with poor survival in glioblastoma multiforme. Oncogene. 2015; 34:5128-5140.
17. Mole DR, Blancher C, Copley RR, Pollard PJ, Gleadle JM, Ragoussis J, Ratcliffe PJ. Genome-wide association of hypoxia-inducible factor (HIF)-1alpha and HIF-2alpha DNA binding with expression profiling of hypoxia-inducible transcripts. J Biol Chem. 2009; 284:16767-16775.
18. Gimm T, Wiese M, Teschemacher B, Deggerich A, Schodel J, Knaup KX, Hackenbeck T, Hellerbrand C, Amann K, Wiesener MS, Honing S, Eckardt KU, Warnecke C. Hypoxia-inducible protein 2 is a novel lipid droplet protein and a specific target gene of hypoxia-inducible factor-1. FASEB J. 2010; 24:4443-4458.
19. Margolin AA, Wang K, Lim WK, Kustagi M, Nemenman I, Califano A. Reverse engineering cellular networks. Nat Protoc. 2006; 1:662-671.
20. Margolin AA, Nemenman I, Basso K, Wiggins C, Stolovitzky G, Dalla Favera R, Califano A. ARACNE: an algorithm for the reconstruction of gene regulatory networks in a mammalian cellular context. BMC Bioinformatics. 2006; 7:S7.
21. Song SJ, Mao XG, Wang C, Han AG, Yan M, Xue XY. LGR5/GPR49 is implicated in motor neuron specification in nervous system. Neurosci Lett. 2015; 584:135-140.
22. Mao XG, Song SJ, Xue XY, Yan M, Wang L, Lin W, Guo G, Zhang X. LGR5 is a Proneural Factor and is Regulated by OLIG2 in Glioma Stem-Like Cells. Cell Mol Neurobiol. 2013; 36:851-865.
23. TCGA. Comprehensive genomic characterization defines human glioblastoma genes and core pathways. Nature. 2008; 455:1061-1068.
24. Verhaak RG, Hoadley KA, Purdom E, Wang V, Qi Y, Wilkerson MD, Miller CR, Ding L, Golub T, Mesirov JP, Alexe G, Lawrence M, O’Kelly M, Tamayo P, Weir BA, Gabriel S, et al. Integrated Genomic Analysis Identifies Clinically Relevant Subtypes of Glioblastoma Characterized by Abnormalities in PDGFRA, IDH1, EGFR, and NF1. Cancer Cell. 2010; 17:98-110.
25. Gravendeel LA, Kouwenhoven MC, Gevaert O, de Rooi JJ, Stubbs AP, Duijm JE, Daemen A, Bleeker FE, Bralten LB, Kloosterhof NK, De Moor B, Eilers PH, van der Spek PJ, Kros JM, Sillevis Smitt PA, van den Bent MJ, et al. Intrinsic gene expression profiles of gliomas are a better predictor of survival than histology. Cancer Res. 2009; 69:9065-9072.
26. Gilbert MR, Dignam JJ, Armstrong TS, Wefel JS, Blumenthal DT, Vogelbaum MA, Colman H, Chakravarti A, Pugh S, Won M, Jeraj R, Brown PD, Jaeckle KA, Schiff D, Stieber VW, Brachman DG, et al. A randomized trial of bevacizumab for newly diagnosed glioblastoma. N Engl J Med. 2014; 370:699-708.
27. Vredenburgh JJ, Desjardins A, Herndon JE, 2nd, Marcello J, Reardon DA, Quinn JA, Rich JN, Sathornsumetee S, Gururangan S, Sampson J, Wagner M, Bailey L, Bigner DD, Friedman AH, Friedman HS. Bevacizumab plus irinotecan in recurrent glioblastoma multiforme. J Clin Oncol. 2007; 25:4722-4729.
28. Batchelor TT, Sorensen AG, di Tomaso E, Zhang WT, Duda DG, Cohen KS, Kozak KR, Cahill DP, Chen PJ, Zhu M, Ancukiewicz M, Mrugala MM, Plotkin S, Drappatz J, Louis DN, Ivy P, et al. AZD2171, a pan-VEGF receptor tyrosine kinase inhibitor, normalizes tumor vasculature and alleviates edema in glioblastoma patients. Cancer Cell. 2007; 11:83-95.
29. Bao S, Wu Q, Sathornsumetee S, Hao Y, Li Z, Hjelmeland AB, Shi Q, McLendon RE, Bigner DD, Rich JN. Stem cell-like glioma cells promote tumor angiogenesis through vascular endothelial growth factor. Cancer Res. 2006; 66:7843-7848.
30. Blagosklonny MV. Antiangiogenic therapy and tumor progression. Cancer Cell. 2004; 5:13-17.
31. Van Meir EG, Hadjipanayis CG, Norden AD, Shu HK, Wen PY, Olson JJ. Exciting new advances in neuro-oncology: the avenue to a cure for malignant glioma. CA Cancer J Clin. 2010; 60:166-193.
32. Piao Y, Liang J, Holmes L, Henry V, Sulman E, de Groot JF. Acquired resistance to anti-VEGF therapy in glioblastoma is associated with a mesenchymal transition. Clin Cancer Res. 2013; 19:4392-4403.
33. Keunen O, Johansson M, Oudin A, Sanzey M, Rahim SA, Fack F, Thorsen F, Taxt T, Bartos M, Jirik R, Miletic H, Wang J, Stieber D, Stuhr L, Moen I, Rygh CB, et al. Anti-VEGF treatment reduces blood supply and increases tumor cell invasion in glioblastoma. Proc Natl Acad Sci U S A. 2011; 108:3749-3754.
34. Tate MC, Aghi MK. Biology of angiogenesis and invasion in glioma. Neurotherapeutics. 2009; 6:447-457.
35. Rong Y, Durden DL, Van Meir EG, Brat DJ. ‘Pseudopalisading’ necrosis in glioblastoma: a familiar morphologic feature that links vascular pathology, hypoxia, and angiogenesis. J Neuropathol Exp Neurol. 2006; 65:529-539.
36. Denko N, Schindler C, Koong A, Laderoute K, Green C, Giaccia A. Epigenetic regulation of gene expression in cervical cancer cells by the tumor microenvironment. Clin Cancer Res. 2000; 6:480-487.
37. Nishimura S, Tsuda H, Ito K, Takano M, Terai Y, Jobo T, Kigawa J, Sugiyama T, Yaegashi N, Aoki D. Differential expression of hypoxia-inducible protein 2 among different histological types of epithelial ovarian cancer and in clear cell adenocarcinomas. Int. J. Gynecol. Cancer. 2010; 20:220-226.
38. Sorensen BS, Toustrup K, Horsman MR, Overgaard J, Alsner J. Identifying pH independent hypoxia induced genes in human squamous cell carcinomas in vitro. Acta Oncol. 2010; 49:895-905.
39. Seo T, Konda R, Sugimura J, Iwasaki K, Nakamura Y, Fujioka T. Expression of hypoxia-inducible protein 2 in renal cell carcinoma: A promising candidate for molecular targeting therapy. Oncol. Lett. 2010; 1:697-701.
40. Wang X, Bjorklund S, Wasik AM, Grandien A, Andersson P, Kimby E, Dahlman-Wright K, Zhao C, Christensson B, Sander B. Gene expression profiling and chromatin immunoprecipitation identify DBN1, SETMAR and HIG2 as direct targets of SOX11 in mantle cell lymphoma. PLoS One. 2010; 5:e14085.
41. Jiang C, Sun J, Dai Y, Cao P, Zhang L, Peng S, Zhou Y, Li G, Tang J, Xiang J. HIF-1A and C/EBPs transcriptionally regulate adipogenic differentiation of bone marrow-derived MSCs in hypoxia. Stem Cell. Res. Ther. 2015; 6:21.
42. Blagosklonny MV. Hypoxia-inducible factor: Achilles’ heel of antiangiogenic cancer therapy (review). Int J Oncol. 2001; 19:257-262.
43. Blagosklonny MV. How Avastin potentiates chemotherapeutic drugs: action and reaction in antiangiogenic therapy. Cancer Biol Ther. 2005; 4:1307-1310.
44. Mattijssen F, Georgiadi A, Andasarie T, Szalowska E, Zota A, Krones-Herzig A, Heier C, Ratman D, De Bosscher K, Qi L, Zechner R, Herzig S, Kersten S. Hypoxia-inducible lipid droplet-associated (HILPDA) is a novel peroxisome proliferator-activated receptor (PPAR) target involved in hepatic triglyceride secretion. J Biol Chem. 2014; 289:19279-19293.
45. Mao XG, Hutt-Cabezas M, Orr BA, Weingart M, Taylor I, Rajan AK, Odia Y, Kahlert U, Maciaczyk J, Nikkhah G, Eberhart CG, Raabe EH. LIN28A facilitates the transformation of human neural stem cells and promotes glioblastoma tumorigenesis through a pro-invasive genetic program. Oncotarget. 2013; 4:1050-1064. doi: 10.18632/oncotarget.1131.
46. Carro MS, Lim WK, Alvarez MJ, Bollo RJ, Zhao X, Snyder EY, Sulman EP, Anne SL, Doetsch F, Colman H, Lasorella A, Aldape K, Califano A, Iavarone A. The transcriptional network for mesenchymal transformation of brain tumours. Nature. 2010; 463:318-325.