Corrections:
Correction: The heparan sulfate mimetic PG545 interferes with Wnt/β-catenin signaling and significantly suppresses pancreatic tumorigenesis alone and in combination with gemcitabine
Metrics: PDF 1412 views | ?
1 College of Korean Medicine, Kyung Hee University, Seoul, South Korea
2 Korean Medicine Clinical Trial Center, Kyung Hee University, Seoul, South Korea
3 Department of Biochemistry and Molecular Biology, MN, USA
4 Progen Pharmaceuticals Ltd, Brisbane, Queensland, Australia
5 Experimental Pathology, Mayo Clinic College of Medicine, Rochester, MN, USA
* These authors contributed equally to this work
** These authors are senior authors
Published: September 24, 2019
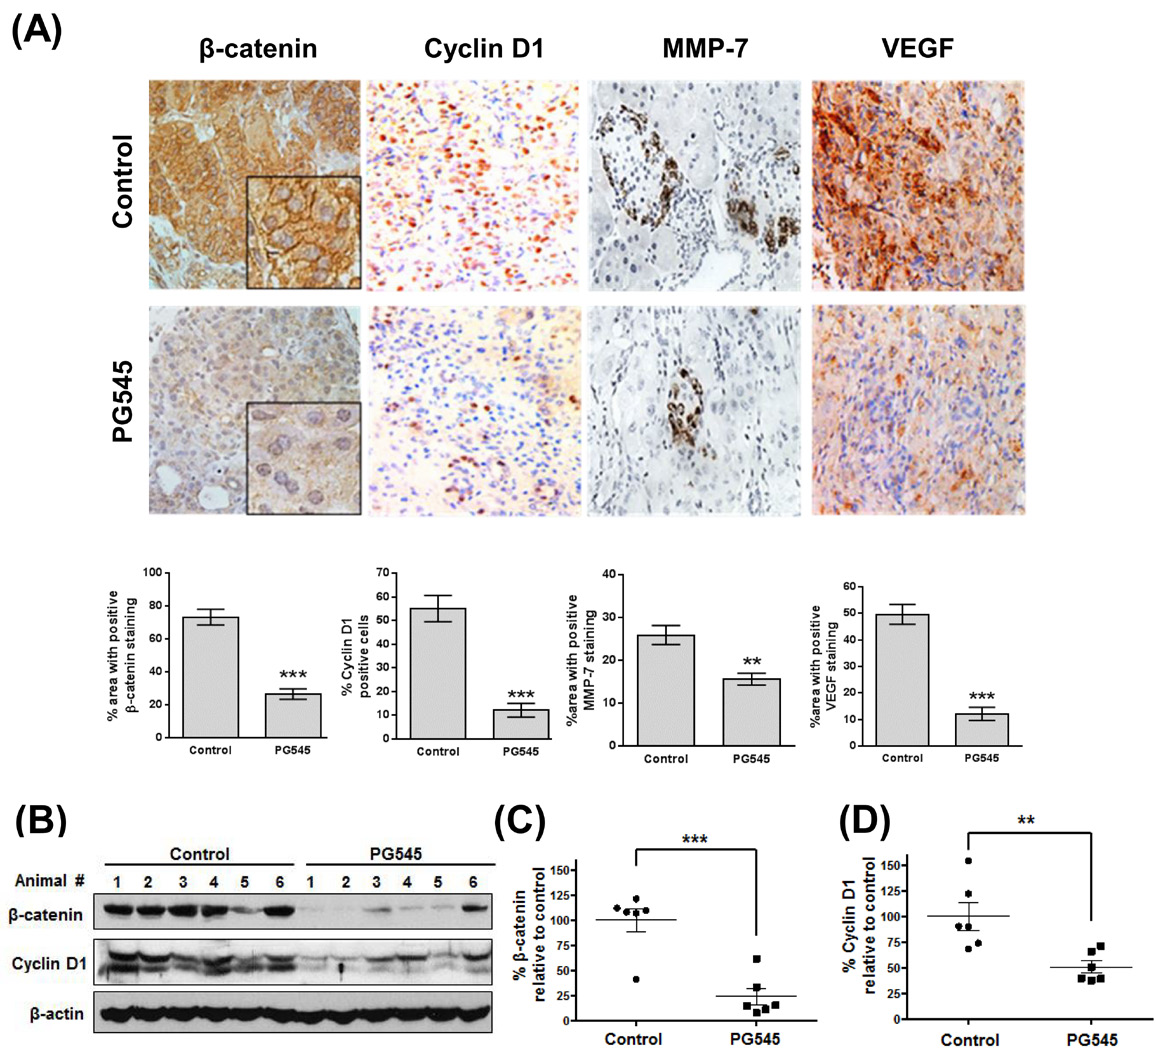
This article has been corrected: The IHC pictures of ‘Control #1 group’ and ‘PG545 #2 group’ have been removed from Figure 6. In addition, the ‘Cyclin D1 in Control 1 group’ is mistakenly similar to the IHC picture of ‘PCNA in Gem group’ already presented in Figure 5F. The corrected Figure 6 is shown below. The authors declare that these corrections do not change the results or conclusions of this paper.
Original article: Oncotarget. 2015; 6:4992-5004. DOI: https://doi.org/10.18632/oncotarget.3214.

Figure 6: PG545 inhibits β-catenin signaling in AsPC-1 orthotopic xenograft mouse model. (A) Immunohistochemical analysis of β-catenin and β-catenin-regulated proteins, Cyclin D1, MMP-7 and VEGF in pancreatic tumor tissues from mice. Quantitation of staining was performed using 10 fields per analyte. **P < 0.01, ***P < 0.001. (B) Frozen tumor tissues were homogenized on ice and the extracts were subjected to Western blotting. (C) β-catenin and (D) Cyclin D1 levels were quantified by Image J software and plotted relative to the control group in Fig. 6B. **P < 0.01, ***P < 0.001 vs. control.
 All site content, except where otherwise noted, is licensed under a Creative Commons Attribution 4.0 License.
PII: 27216

