Oncotarget published "THSB2 as a prognostic biomarker for patients diagnosed with metastatic pancreatic ductal adenocarcinoma" which reported that patients newly diagnosed with metastatic pancreatic ductal adenocarcinoma generally have poor survival, with heterogeneous rates of progression.
In a previous retrospective study, these authors discovered that circulating thrombospondin-2 could, in combination with CA19-9, better distinguish patients with PDAC versus healthy controls. Specifically, they interrogated the association of THBS2 level, alone or in combination with CA19-9, with progression by 90 days and/or survival to 180 days.
Dr. Kenneth S. Zaret from and Dr. Erica L. Carpenter from The University of Pennsylvania said, "Pancreatic ductal adenocarcinoma (PDAC) is often diagnosed at advanced stages of disease, with unresectable tumors that respond poorly to systemic therapy."
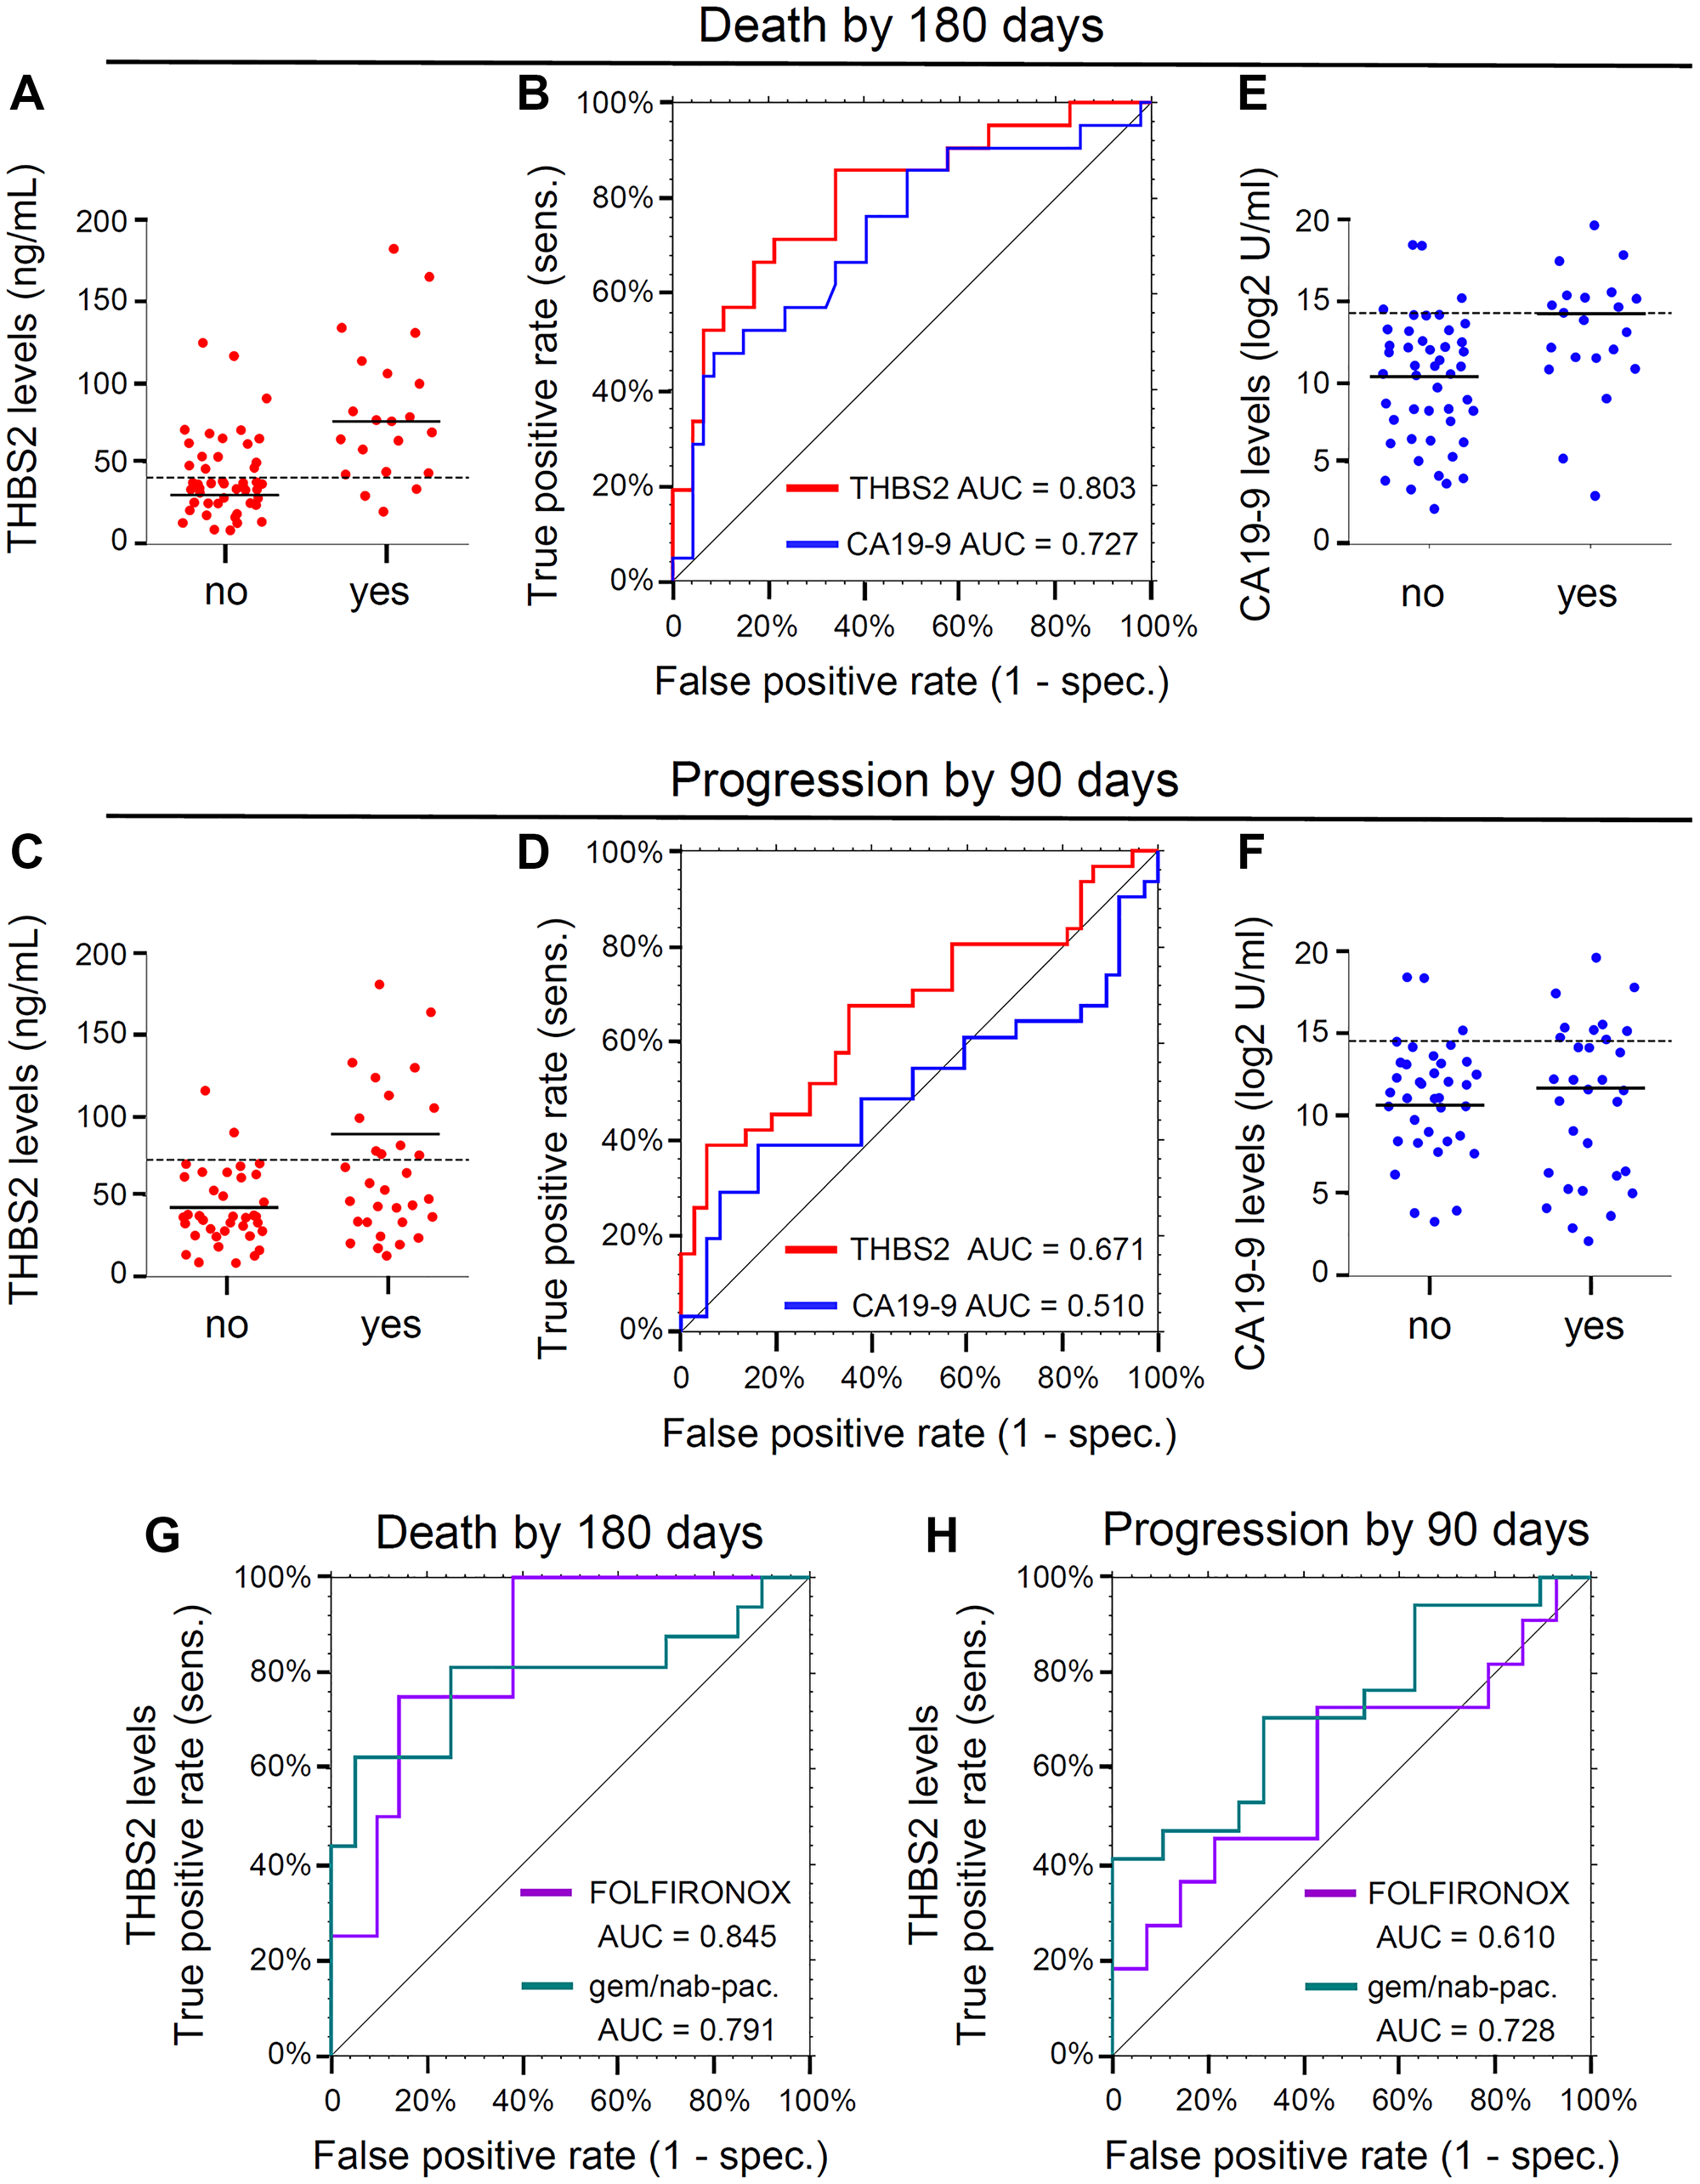
Figure 1: (A) Dot plots displaying THBS2 concentrations dichotomized by the event “Death by 180 days” (no, n = 47; yes, n = 21). Dashed line, the cut point 40.7 for THBS2 obtained by maximizing Youden's Index. Solid lines, median values. (B) ROC curves for the event “Death by 180 days.” THBS2 ROC curve is represented in red (n = 68; AUC = 0.803, 95% CI 0.686–0.921) and CA19-9 ROC curve is represented in blue (n = 68, AUC = 0.727, 95% CI 0.589–0.865). “sens” is sensitivity and “spec.” is specificity. (C) Dot plots displaying THBS2 concentrations dichotomized by the event “Progression by 90 day” (no, n = 37; yes, n = 31). Dashed line, the cut point of 72.9 for THBS2 obtained by maximizing Youden's Index. Solid lines, median values. (D) ROC curves for the event “Progression by 90 days.” THBS2 ROC curve is represented in red (n = 68; AUC=0.671, 95% CI 0.538–0.804) and CA19-9 ROC curve is represented in blue (n = 68, AUC = 0.510, 95% CI 0.362–0.658). “sens” is sensitivity and “spec.” is specificity. (E) Dot plots displaying Log2 CA19-9 concentrations dichotomized by the event “Death by 180 days” (no, n = 47; yes, n = 21). Solid lines, median values. Dashed line, the cut point of 1.84 for Log2CA19-9 obtained by maximizing Youden's Index. (F) Dot plots displaying CA19-9 concentrations dichotomized by the event “Progression by 90 day” (no, n = 37; yes, n = 31). Solid lines, median values. Dashed line, the cut point of 2.33 for Log2CA19-9 obtained by maximizing Youden's Index. (G) THBS2 ROC curves for the event “Death by 180 days” for two subgroups defined by first-line therapy: FOLFIRINOX (purple, n = 25, AUC = 0.845, 95% CI: 0.665–1.000), gemcitabine plus nab-paclitaxel (gem/nab-pac.) with or without HCQ (green, n = 36, AUC = 0.791, 95% CI: 0.623–0.958). “sens” is sensitivity and “spec.” is specificity. (H) THBS2 ROC curves for the event “Progression by 90 days” for two subgroups defined by first-line therapy: FOLFIRINOX (purple, n = 25, AUC = 0.610, 95% CI: 0.371–0.845) gemcitabine plus nab-paclitaxel (gem/nab-pac.) with or without HCQ (green, n = 36, AUC = 0.728, 95% CI: 0.558–0.897). “sens” is sensitivity and “spec.” is specificity.
The low incidence of PDAC and the absence of a known genetic or familial predisposition in most cases make it challenging to develop biomarkers with necessary sensitivity and specificity for early detection. In addition, recent studies indicate that PDAC may progress more rapidly than previously appreciated.
Carbohydrate antigen 19-9 has been used as a diagnostic and prognostic marker for PDAC, but has insufficient power for broad utility. These same authors previously discovered candidate PDAC biomarkers with an induced pluripotent stem cell line, derived from a recurrent, late stage PDAC tumor. Definitive surgical therapy is not an accepted option for mPDAC, and therefore these individuals are often offered systemic chemotherapy with a variety of potential regimens.
There is considerable heterogeneity in the time to disease progression and death that has been difficult to predict for each patient.
There is considerable heterogeneity in the time to disease progression and death that has been difficult to predict for each patient.
The Zaret/Carpenter Research Team concluded in their Oncotarget Research Output that research into the biology underlying the THBS2 prognostic signal may reveal targetable or other measurable differences in good and poor prognostic groups.
Sign up for free Altmetric alerts about this article
DOI - https://doi.org/10.18632/oncotarget.28099
Full text - https://www.oncotarget.com/article/28099/text/
Correspondence to - Kenneth S. Zaret - [email protected] and Erica L. Carpenter - [email protected]
Keywords - pancreatic cancer, metastasis, biomarkers, prognosis, THBS2
About Oncotarget
Oncotarget is a biweekly, peer-reviewed, open access biomedical journal covering research on all aspects of oncology.
To learn more about Oncotarget, please visit https://www.oncotarget.com or connect with:
SoundCloud - https://soundcloud.com/oncotarget
Facebook - https://www.facebook.com/Oncotarget/
Twitter - https://twitter.com/oncotarget
LinkedIn - https://www.linkedin.com/company/oncotarget
Pinterest - https://www.pinterest.com/oncotarget/
Reddit - https://www.reddit.com/user/Oncotarget/
Oncotarget is published by Impact Journals, LLC please visit https://www.ImpactJournals.com or connect with @ImpactJrnls
Media Contact
[email protected]
18009220957x105