Corrections:
Correction: Systematic identification and comparison of expressed profiles of lncRNAs and circRNAs with associated co-expression and ceRNA networks in mouse germline stem cells
Metrics: PDF 1625 views | ?
1Renji Hospital, Key Laboratory for the Genetics of Developmental and Neuropsychiatric Disorders (Ministry of Education), Bio-X Institutes, School of Medicine, Shanghai Jiao Tong University, Shanghai, 200240, China
2State Key Laboratory of Oncogenes and Related Genes, Shanghai Cancer Institute, Renji Hospital, Shanghai Jiao Tong University School of Medicine, Shanghai, 200032, China
3Key Laboratory of Fertility Preservation and Maintenance of Ministry of Education, Ningxia Medical University, Yinchuan, 750004, China
4Shanghai Key Laboratory of Reproduction Medicine, Shanghai, 200025, China
*These authors contribute equally to this work
Published: June 15, 2018
This article has been corrected: The correct figure 4 (D, E) is given below:
The authors declare that this correction does not change the results and conclusions of this paper.
Original article: Oncotarget. 2017; 8:26573-26590. DOI: https://doi.org/10.18632/oncotarget.15719.
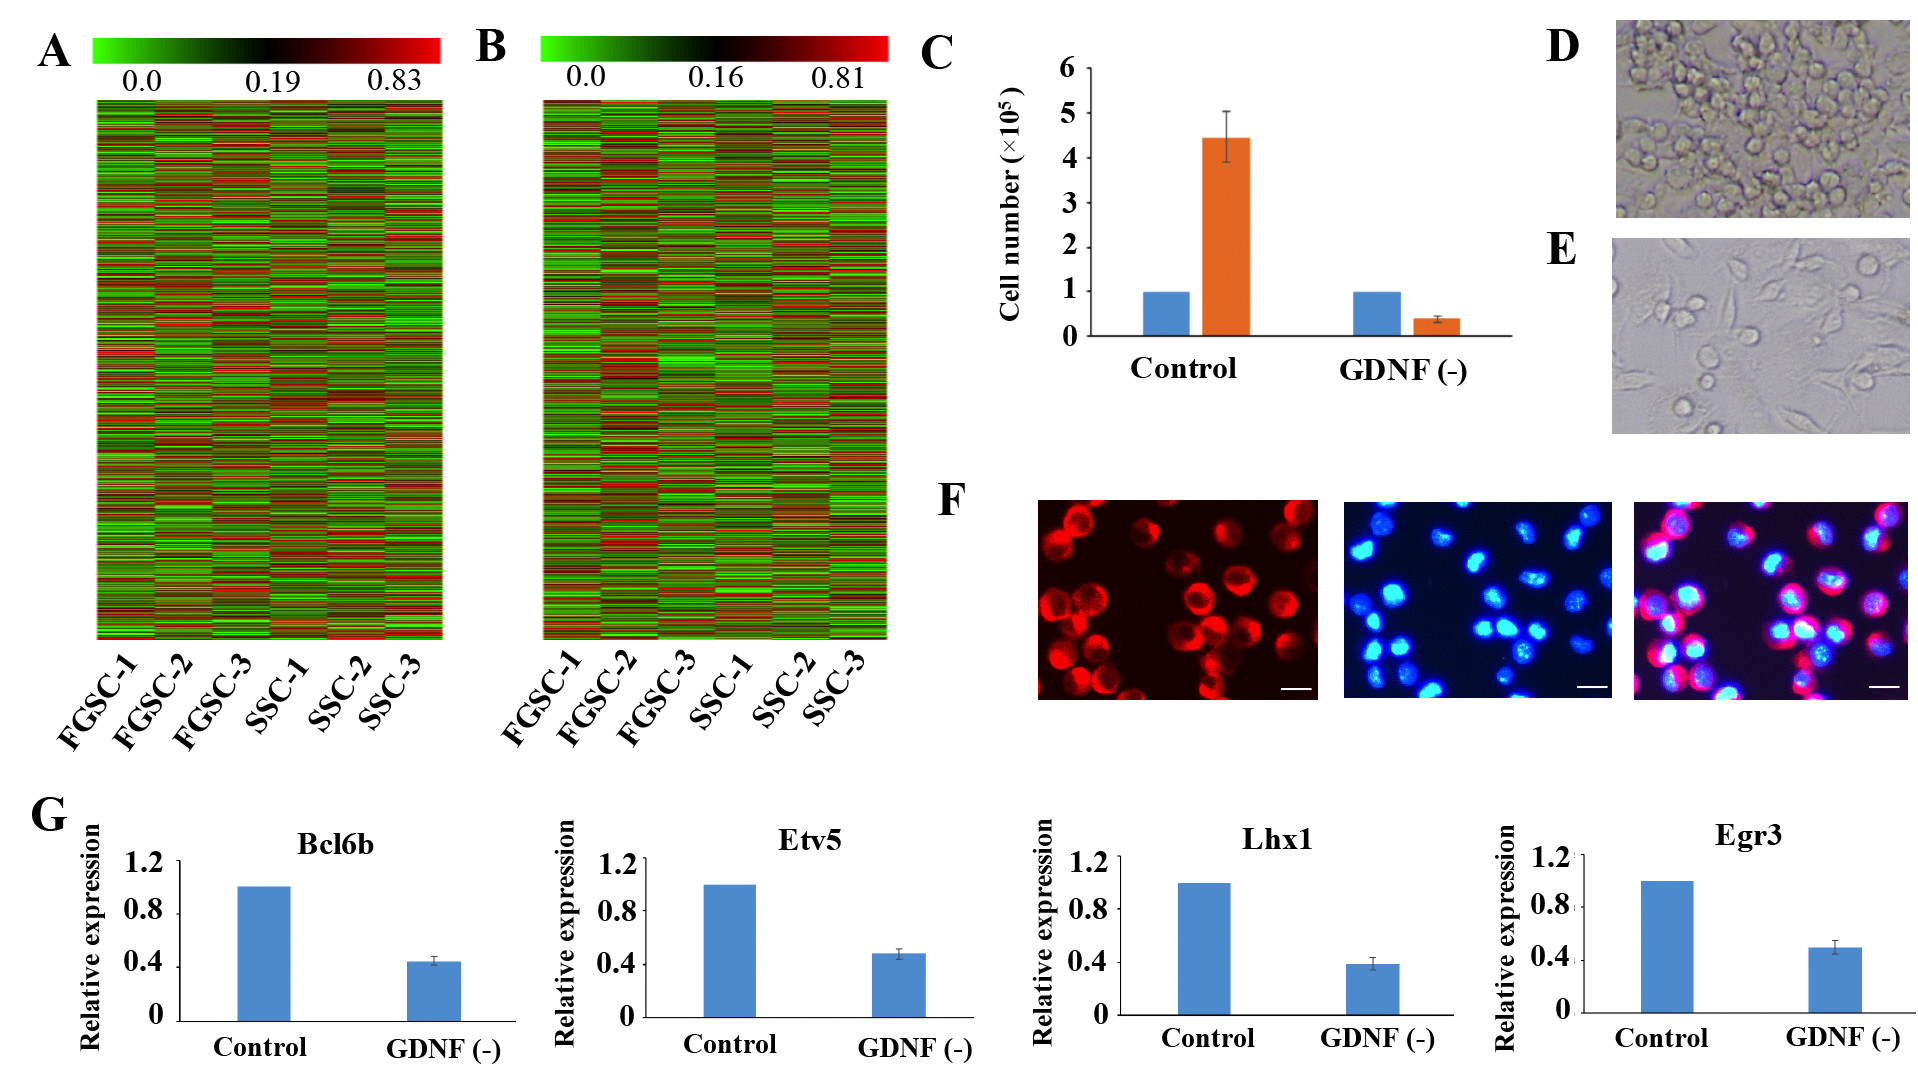
Figure 4: Similar lncRNA profiles and self-renewal mechanisms shared by mouse SSCs and FGSCs. (A–B). Heat map showing expression profiles of mRNAs (A) and lncRNAs (B). The maps are based on the expression values of all expressed lncRNAs and mRNAs detected by high-throughput sequencing. The color scale indicates the expression values; the intensity increases from green to red. Each column represents one sample, and each row represents a transcript. (C–E) Proliferation of FGSCs in culture was dependent on the glial cell line-derived neurotrophic factor GDNF. Cells plated at 1.0 × 10⁵ per well into culture medium without GDNF did not proliferate (average 0.4 × 10⁵ per well) after a week. FGSCs were cultured with culture medium containing GDNF as the control. Error bars indicate the standard deviation (SD). Each experiment was conducted three times. (F) The FGSCs was detected by immunofluorescence analysis with the antibodies against GFRA1. Left, GFRA1 immunofluorescence. Middle, DAPI immunofluorescence. Right, merge for GFRA1 and DAPI immunofluorescence Scale bars: 10 μm. (G) Withdrawal of GDNF for a week resulted in a significant change in the expression levels of self-renewal-related genes that showed the largest response to the GDNF signal, including Bcl6b, Etv5, Lhx1, and Egr3. GAPDH was used as an internal control. Error bars indicate the standard deviation (SD). Each experiment was conducted three times.
 All site content, except where otherwise noted, is licensed under a Creative Commons Attribution 4.0 License.
PII: 25674